Fincash » Mutual Funds » Lump Sum Investment in Mutual Funds
Table of Contents
- What do you mean by Lump Sum Investment in Mutual Funds?
- Best Mutual Fund for Lump Sum Investment in 2025 – 2026
- Best Mutual Funds based on Last 1 Month
- Things to be Considered During Lump Sum Investment
- Mutual Fund Lump Sum Return Calculator
- Advantages and Disadvantages of One-Time Investment in Mutual Fund
- Conclusion
Top 5 Funds
Lump Sum Investment in Mutual Funds
Do you know that you can invest a lump sum amount in Mutual Funds? If yes, then it's good. However, if no, then don’t worry. This article will guide you through the same. Lump sum investment in Mutual Funds refers to a situation when an individual invests money in Mutual Funds at one-time. Here, the deposit does not take place at multiple times. There is a lot of difference between the SIP and lump sum mode of investment. So, let us understand the concept of Lump sum investment in Mutual Funds, best mutual funds for lump sum investment, things to be considered during lump sum investment, Mutual Fund Lump sum return calculator, and other related aspects through this article.

What do you mean by Lump Sum Investment in Mutual Funds?
Lump sum investment in Mutual Fund is a scenario where individuals invest in Mutual Funds for only once. However, in contrast to SIP mode of investment where individuals deposit small amounts in lump sum mode, individuals deposit a considerable amount. In other words, it is a one-shot technique of Investing in Mutual Funds. Lump sum mode of investing in suitable for investors who have excess funds that are lying ideal in their Bank account and are looking to for channels to earn more Income by investing in Mutual Funds.
Best Mutual Fund for Lump Sum Investment in 2025 – 2026
Before you invest in Mutual Funds through lump sum mode, individuals need to consider various parameters such as AUM, investment amount, and much more. So, based on these parameters some of the best Mutual Funds for Lump sum investment are as follows.
Best Lump Investment in Equity Mutual Funds
Equity Funds are the schemes that invest their corpus in equity and equity-related instruments of various companies. These schemes are considered to be a good option for long-term investment. Though individuals can invest lump sum amount in equity funds yet the recommended technique of investing in equity funds is either through SIP or Systematic Transfer Plan (STP) mode. In STP mode, individuals first deposit a considerable money in Debt fund such as Liquid Funds and then the money is transferred at regular intervals in equity funds. Some of the Equity Mutual Funds that can be considered for investment are as follows.
Fund NAV Net Assets (Cr) Min Investment 3 MO (%) 6 MO (%) 1 YR (%) 3 YR (%) 5 YR (%) 2023 (%) Nippon India Small Cap Fund Growth ₹158.379
↑ 0.48 ₹55,491 5,000 -2.4 -9.2 5.6 21.7 39 26.1 ICICI Prudential Infrastructure Fund Growth ₹182.77
↑ 0.55 ₹7,214 5,000 2.6 -3.8 7.1 28.1 38.9 27.4 Motilal Oswal Midcap 30 Fund Growth ₹94.5278
↑ 1.44 ₹26,028 5,000 -4.3 -10.9 14.9 27 36.9 57.1 IDFC Infrastructure Fund Growth ₹48.045
↑ 0.19 ₹1,563 5,000 0.9 -6.6 5.3 25.9 36.1 39.3 L&T Emerging Businesses Fund Growth ₹75.9538
↑ 0.35 ₹13,334 5,000 -5.3 -12.2 3.3 18.4 35.7 28.5 Note: Returns up to 1 year are on absolute basis & more than 1 year are on CAGR basis. as on 23 Apr 25
Talk to our investment specialist
Best Lump Sum Investment in Debt Mutual Funds
Debt Funds invest their fund money in different Fixed Income instruments like treasury bills, corporate Bonds, and much more. These schemes are considered as a good option for short and medium term. Many individuals choose to invest lump sum money in Debt Mutual Funds. Some of the Best Debt Funds that can be chosen for lump sum investment are as follows.
Fund NAV Net Assets (Cr) Min Investment 3 MO (%) 6 MO (%) 1 YR (%) 3 YR (%) 2023 (%) Debt Yield (YTM) Mod. Duration Eff. Maturity Aditya Birla Sun Life Medium Term Plan Growth ₹39.349
↑ 0.01 ₹2,206 1,000 5.3 7.1 14.5 14.3 10.5 7.89% 3Y 7M 17D 4Y 10M 24D DSP BlackRock Credit Risk Fund Growth ₹48.7473
↑ 0.01 ₹207 1,000 15.7 17.7 22.4 14 7.8 7.81% 2Y 2M 8D 2Y 11M 12D Franklin India Credit Risk Fund Growth ₹25.3348
↑ 0.04 ₹104 5,000 2.9 5 7.5 11 0% Aditya Birla Sun Life Credit Risk Fund Growth ₹21.9652
↑ 0.01 ₹970 1,000 6.4 8.2 17.1 10.7 11.9 8.29% 2Y 5M 16D 3Y 9M 29D UTI Bond Fund Growth ₹73.4955
↑ 0.05 ₹320 1,000 4 5.6 11 10.2 8.5 7.17% 6Y 5M 1D 9Y 11M 5D Note: Returns up to 1 year are on absolute basis & more than 1 year are on CAGR basis. as on 23 Apr 25
Best Hybrid Funds for Lump Sum Investment
Hybrid funds also known as Balanced Fund invest their money in both equity and fixed income instruments. These schemes are suitable for individuals looking for Capital generation along with regular income. Also known as balanced schemes, individuals can choose to invest lump sum amount in hybrid schemes. Some of the best hybrid funds for lump sum investment are listed below.
Fund NAV Net Assets (Cr) Min Investment 3 MO (%) 6 MO (%) 1 YR (%) 3 YR (%) 5 YR (%) 2023 (%) JM Equity Hybrid Fund Growth ₹117.677
↑ 0.42 ₹768 5,000 1.2 -6.3 6.3 20.9 27.8 27 HDFC Balanced Advantage Fund Growth ₹503.855
↑ 2.07 ₹90,375 5,000 3.3 0.4 9.8 19.6 25.8 16.7 ICICI Prudential Equity and Debt Fund Growth ₹381.88
↑ 2.55 ₹40,962 5,000 6.5 1.9 12 18.6 27.3 17.2 UTI Multi Asset Fund Growth ₹72.4021
↑ 0.35 ₹5,285 5,000 3.1 0.1 10.4 18.5 18.1 20.7 ICICI Prudential Multi-Asset Fund Growth ₹734.593
↑ 0.66 ₹55,360 5,000 5.3 3.3 13.2 18.3 26.1 16.1 Note: Returns up to 1 year are on absolute basis & more than 1 year are on CAGR basis. as on 23 Apr 25
Best Index Funds for Lump Sum Investment
The Portfolio of an index fund consists of the shares and other instruments in the same proportion as they are in the index. In other words, these schemes mimic the performance of an index. These are passively managed funds and can be considered as a good option for lump sum investment. Some of the best Index Funds that can be chosen for lump sum investment are as follows.
Fund NAV Net Assets (Cr) 3 MO (%) 6 MO (%) 1 YR (%) 3 YR (%) 5 YR (%) 2023 (%) LIC MF Index Fund Sensex Growth ₹149.299
↑ 0.96 ₹84 4.5 -0.2 8.7 12.1 20.3 8.2 Nippon India Index Fund - Sensex Plan Growth ₹40.5201
↑ 0.26 ₹839 4.7 0.1 9.3 12.6 20.8 8.9 SBI Nifty Index Fund Growth ₹213.77
↑ 1.42 ₹9,192 4.9 -0.3 9.5 13 21.8 9.5 IDBI Nifty Index Fund Growth ₹36.2111
↓ -0.02 ₹208 9.1 11.9 16.2 20.3 11.7 Franklin India Index Fund Nifty Plan Growth ₹195.184
↑ 1.28 ₹701 4.9 -0.3 9.5 12.9 21.5 9.5 Note: Returns up to 1 year are on absolute basis & more than 1 year are on CAGR basis. as on 23 Apr 25
Best Mutual Funds based on Last 1 Month
"The primary investment objective of the Scheme is to seek capital appreciation by investing predominantly in units of MLIIF - WGF. The Scheme may, at the discretion of the Investment Manager, also invest in the units of other similar overseas mutual fund schemes, which may constitute a significant part of its corpus. The Scheme may also invest a certain portion of its corpus in money market securities and/or units of money market/liquid schemes of DSP Merrill Lynch Mutual Fund, in order to meet liquidity requirements from time to time. However, there is no assurance that the investment objective of the Scheme will be realized." DSP BlackRock World Gold Fund is a Equity - Global fund was launched on 14 Sep 07. It is a fund with High risk and has given a Below is the key information for DSP BlackRock World Gold Fund Returns up to 1 year are on Seek capital appreciation by investing predominantly in equity and equity related securities of indian companies engaged in banking and financial Services. Sundaram Financial Services Opportunities Fund is a Equity - Sectoral fund was launched on 10 Jun 08. It is a fund with High risk and has given a Below is the key information for Sundaram Financial Services Opportunities Fund Returns up to 1 year are on The investment objective of the Scheme will be to generate returns that correspond closely to the returns generated by IDBI Gold Exchange Traded Fund (IDBI GOLD ETF). IDBI Gold Fund is a Gold - Gold fund was launched on 14 Aug 12. It is a fund with Moderately High risk and has given a Below is the key information for IDBI Gold Fund Returns up to 1 year are on The investment objective of the scheme is to seek long term capital appreciation by investing atleast 80% of its net assets in equity/equity related instruments of the companies in the Banking and Financial Services sector in India. TATA Banking and Financial Services Fund is a Equity - Sectoral fund was launched on 28 Dec 15. It is a fund with High risk and has given a Below is the key information for TATA Banking and Financial Services Fund Returns up to 1 year are on The primary investment objective of the Scheme is to seek to generate continuous returns by actively investing in equity and equity related securities of
companies in the Banking Sector and companies engaged in allied activities related to Banking Sector. The AMC will have the discretion to completely or
partially invest in any of the type of securities stated above with a view to maximize the returns or on defensive considerations. However, there can be no
assurance that the investment objective of the Scheme will be realized, as actual market movements may be at variance with anticipated trends. Nippon India Banking Fund is a Equity - Sectoral fund was launched on 26 May 03. It is a fund with High risk and has given a Below is the key information for Nippon India Banking Fund Returns up to 1 year are on 1. DSP BlackRock World Gold Fund
CAGR/Annualized return of 6.4% since its launch. Ranked 11 in Global category. Return for 2024 was 15.9% , 2023 was 7% and 2022 was -7.7% . DSP BlackRock World Gold Fund
Growth Launch Date 14 Sep 07 NAV (22 Apr 25) ₹29.5719 ↓ -0.16 (-0.54 %) Net Assets (Cr) ₹1,146 on 31 Mar 25 Category Equity - Global AMC DSP BlackRock Invmt Managers Pvt. Ltd. Rating ☆☆☆ Risk High Expense Ratio 1.35 Sharpe Ratio 1.49 Information Ratio -0.12 Alpha Ratio 0.84 Min Investment 1,000 Min SIP Investment 500 Exit Load 0-12 Months (1%),12 Months and above(NIL) Growth of 10,000 investment over the years.
Date Value 31 Mar 20 ₹10,000 31 Mar 21 ₹13,604 31 Mar 22 ₹15,152 31 Mar 23 ₹14,266 31 Mar 24 ₹13,920 31 Mar 25 ₹20,792 Returns for DSP BlackRock World Gold Fund
absolute basis & more than 1 year are on CAGR (Compound Annual Growth Rate) basis. as on 22 Apr 25 Duration Returns 1 Month 14% 3 Month 33.8% 6 Month 20.6% 1 Year 61.8% 3 Year 16.3% 5 Year 11.9% 10 Year 15 Year Since launch 6.4% Historical performance (Yearly) on absolute basis
Year Returns 2023 15.9% 2022 7% 2021 -7.7% 2020 -9% 2019 31.4% 2018 35.1% 2017 -10.7% 2016 -4% 2015 52.7% 2014 -18.5% Fund Manager information for DSP BlackRock World Gold Fund
Name Since Tenure Jay Kothari 1 Mar 13 12.01 Yr. Data below for DSP BlackRock World Gold Fund as on 31 Mar 25
Equity Sector Allocation
Sector Value Basic Materials 92.86% Asset Allocation
Asset Class Value Cash 3.12% Equity 93.16% Debt 0.02% Other 3.7% Top Securities Holdings / Portfolio
Name Holding Value Quantity BGF World Gold I2
Investment Fund | -80% ₹844 Cr 1,880,211
↓ -73,489 VanEck Gold Miners ETF
- | GDX19% ₹199 Cr 573,719 Treps / Reverse Repo Investments
CBLO/Reverse Repo | -2% ₹19 Cr Net Receivables/Payables
CBLO | -0% -₹4 Cr 2. Sundaram Financial Services Opportunities Fund
CAGR/Annualized return of 14.9% since its launch. Ranked 23 in Sectoral category. Return for 2024 was 7.1% , 2023 was 31.1% and 2022 was 16.8% . Sundaram Financial Services Opportunities Fund
Growth Launch Date 10 Jun 08 NAV (23 Apr 25) ₹103.612 ↓ -0.25 (-0.24 %) Net Assets (Cr) ₹1,415 on 31 Mar 25 Category Equity - Sectoral AMC Sundaram Asset Management Company Ltd Rating ☆☆☆ Risk High Expense Ratio 2.24 Sharpe Ratio 0.15 Information Ratio 0.62 Alpha Ratio -10.88 Min Investment 100,000 Min SIP Investment 100 Exit Load 0-12 Months (1%),12 Months and above(NIL) Growth of 10,000 investment over the years.
Date Value 31 Mar 20 ₹10,000 31 Mar 21 ₹17,095 31 Mar 22 ₹18,755 31 Mar 23 ₹20,630 31 Mar 24 ₹28,468 31 Mar 25 ₹30,814 Returns for Sundaram Financial Services Opportunities Fund
absolute basis & more than 1 year are on CAGR (Compound Annual Growth Rate) basis. as on 22 Apr 25 Duration Returns 1 Month 10.1% 3 Month 13.8% 6 Month 6.5% 1 Year 15.3% 3 Year 21.9% 5 Year 25.7% 10 Year 15 Year Since launch 14.9% Historical performance (Yearly) on absolute basis
Year Returns 2023 7.1% 2022 31.1% 2021 16.8% 2020 15.3% 2019 2.7% 2018 26.4% 2017 -3.7% 2016 33.3% 2015 12.8% 2014 -9% Fund Manager information for Sundaram Financial Services Opportunities Fund
Name Since Tenure Rohit Seksaria 30 Dec 17 7.17 Yr. Ashish Aggarwal 1 Jan 22 3.16 Yr. Data below for Sundaram Financial Services Opportunities Fund as on 31 Mar 25
Equity Sector Allocation
Sector Value Financial Services 94.17% Asset Allocation
Asset Class Value Cash 3.84% Equity 95.06% Debt 1.09% Top Securities Holdings / Portfolio
Name Holding Value Quantity HDFC Bank Ltd (Financial Services)
Equity, Since 31 Dec 08 | HDFCBANK18% ₹241 Cr 1,390,056
↑ 7,660 ICICI Bank Ltd (Financial Services)
Equity, Since 30 Jun 10 | ICICIBANK12% ₹161 Cr 1,339,673
↑ 10,584 Axis Bank Ltd (Financial Services)
Equity, Since 28 Feb 10 | 53221510% ₹128 Cr 1,259,449 State Bank of India (Financial Services)
Equity, Since 31 Dec 08 | SBIN5% ₹65 Cr 949,469
↑ 64,175 Shriram Finance Ltd (Financial Services)
Equity, Since 30 Sep 23 | SHRIRAMFIN5% ₹64 Cr 1,036,445 IndusInd Bank Ltd (Financial Services)
Equity, Since 30 Jun 20 | INDUSINDBK4% ₹60 Cr 601,270 Bajaj Finance Ltd (Financial Services)
Equity, Since 31 Jul 18 | 5000344% ₹58 Cr 68,102
↓ -5,238 Ujjivan Small Finance Bank Ltd Ordinary Shares (Financial Services)
Equity, Since 31 May 24 | UJJIVANSFB4% ₹49 Cr 15,383,384
↑ 412,458 CSB Bank Ltd Ordinary Shares (Financial Services)
Equity, Since 30 Jun 20 | CSBBANK4% ₹48 Cr 1,697,765
↑ 3,396 PNB Housing Finance Ltd (Financial Services)
Equity, Since 31 Jul 24 | PNBHOUSING4% ₹47 Cr 616,144
↑ 39,470 3. IDBI Gold Fund
CAGR/Annualized return of 7.6% since its launch. Return for 2024 was 18.7% , 2023 was 14.8% and 2022 was 12% . IDBI Gold Fund
Growth Launch Date 14 Aug 12 NAV (23 Apr 25) ₹25.4265 ↓ -0.91 (-3.45 %) Net Assets (Cr) ₹104 on 31 Mar 25 Category Gold - Gold AMC IDBI Asset Management Limited Rating Risk Moderately High Expense Ratio 0.65 Sharpe Ratio 1.62 Information Ratio 0 Alpha Ratio 0 Min Investment 5,000 Min SIP Investment 500 Exit Load 0-12 Months (1%),12 Months and above(NIL) Growth of 10,000 investment over the years.
Date Value 31 Mar 20 ₹10,000 31 Mar 21 ₹10,000 31 Mar 22 ₹11,326 31 Mar 23 ₹13,151 31 Mar 24 ₹14,541 31 Mar 25 ₹19,184 Returns for IDBI Gold Fund
absolute basis & more than 1 year are on CAGR (Compound Annual Growth Rate) basis. as on 22 Apr 25 Duration Returns 1 Month 9.5% 3 Month 20.4% 6 Month 21.9% 1 Year 32.5% 3 Year 21.4% 5 Year 13.9% 10 Year 15 Year Since launch 7.6% Historical performance (Yearly) on absolute basis
Year Returns 2023 18.7% 2022 14.8% 2021 12% 2020 -4% 2019 24.2% 2018 21.6% 2017 5.8% 2016 1.4% 2015 8.3% 2014 -8.7% Fund Manager information for IDBI Gold Fund
Name Since Tenure Sumit Bhatnagar 1 Jun 24 0.75 Yr. Data below for IDBI Gold Fund as on 31 Mar 25
Asset Allocation
Asset Class Value Cash 1.33% Other 98.67% Top Securities Holdings / Portfolio
Name Holding Value Quantity LIC MF Gold ETF
- | -99% ₹92 Cr 119,347
↑ 12,271 Treps
CBLO/Reverse Repo | -1% ₹1 Cr Net Receivables / (Payables)
Net Current Assets | -1% -₹1 Cr 4. TATA Banking and Financial Services Fund
CAGR/Annualized return of 16.7% since its launch. Return for 2024 was 9% , 2023 was 22% and 2022 was 16.9% . TATA Banking and Financial Services Fund
Growth Launch Date 28 Dec 15 NAV (23 Apr 25) ₹42.3433 ↓ -0.17 (-0.40 %) Net Assets (Cr) ₹2,548 on 31 Mar 25 Category Equity - Sectoral AMC Tata Asset Management Limited Rating Risk High Expense Ratio 0 Sharpe Ratio 0.68 Information Ratio 0.5 Alpha Ratio -3.79 Min Investment 5,000 Min SIP Investment 150 Exit Load 0-3 Months (0.25%),3 Months and above(NIL) Growth of 10,000 investment over the years.
Date Value 31 Mar 20 ₹10,000 31 Mar 21 ₹16,155 31 Mar 22 ₹17,035 31 Mar 23 ₹18,867 31 Mar 24 ₹23,596 31 Mar 25 ₹27,532 Returns for TATA Banking and Financial Services Fund
absolute basis & more than 1 year are on CAGR (Compound Annual Growth Rate) basis. as on 22 Apr 25 Duration Returns 1 Month 9.4% 3 Month 14.4% 6 Month 7.8% 1 Year 20.3% 3 Year 20.5% 5 Year 22.7% 10 Year 15 Year Since launch 16.7% Historical performance (Yearly) on absolute basis
Year Returns 2023 9% 2022 22% 2021 16.9% 2020 11.9% 2019 2.7% 2018 25.7% 2017 -0.1% 2016 45% 2015 17.8% 2014 Fund Manager information for TATA Banking and Financial Services Fund
Name Since Tenure Amey Sathe 14 Oct 21 3.46 Yr. Data below for TATA Banking and Financial Services Fund as on 31 Mar 25
Equity Sector Allocation
Sector Value Financial Services 96.96% Technology 1.72% Asset Allocation
Asset Class Value Cash 1.31% Equity 98.69% Top Securities Holdings / Portfolio
Name Holding Value Quantity HDFC Bank Ltd (Financial Services)
Equity, Since 31 Jan 16 | HDFCBANK24% ₹554 Cr 3,200,000 Kotak Mahindra Bank Ltd (Financial Services)
Equity, Since 31 Jan 16 | KOTAKBANK10% ₹219 Cr 1,150,000 Axis Bank Ltd (Financial Services)
Equity, Since 30 Nov 18 | 5322159% ₹203 Cr 2,000,000 ICICI Bank Ltd (Financial Services)
Equity, Since 31 Oct 18 | ICICIBANK9% ₹200 Cr 1,665,000 SBI Cards and Payment Services Ltd Ordinary Shares (Financial Services)
Equity, Since 31 Mar 20 | SBICARD3% ₹74 Cr 880,000 State Bank of India (Financial Services)
Equity, Since 30 Nov 20 | SBIN3% ₹68 Cr 990,000 Bajaj Finance Ltd (Financial Services)
Equity, Since 31 Dec 24 | 5000343% ₹60 Cr 70,000 PNB Housing Finance Ltd (Financial Services)
Equity, Since 31 Oct 21 | PNBHOUSING3% ₹57 Cr 750,000 ICICI Lombard General Insurance Co Ltd (Financial Services)
Equity, Since 30 Jun 19 | ICICIGI2% ₹55 Cr 325,000 HDFC Life Insurance Co Ltd (Financial Services)
Equity, Since 31 Jul 19 | HDFCLIFE2% ₹52 Cr 850,000
↑ 50,000 5. Nippon India Banking Fund
CAGR/Annualized return of 20.7% since its launch. Ranked 15 in Sectoral category. Return for 2024 was 10.3% , 2023 was 24.2% and 2022 was 20.7% . Nippon India Banking Fund
Growth Launch Date 26 May 03 NAV (23 Apr 25) ₹617.734 ↓ -1.52 (-0.25 %) Net Assets (Cr) ₹6,566 on 31 Mar 25 Category Equity - Sectoral AMC Nippon Life Asset Management Ltd. Rating ☆☆☆ Risk High Expense Ratio 1.94 Sharpe Ratio 0.46 Information Ratio 0.54 Alpha Ratio -6.4 Min Investment 5,000 Min SIP Investment 100 Exit Load 0-1 Years (1%),1 Years and above(NIL) Growth of 10,000 investment over the years.
Date Value 31 Mar 20 ₹10,000 31 Mar 21 ₹17,796 31 Mar 22 ₹21,684 31 Mar 23 ₹23,468 31 Mar 24 ₹31,409 31 Mar 25 ₹35,338 Returns for Nippon India Banking Fund
absolute basis & more than 1 year are on CAGR (Compound Annual Growth Rate) basis. as on 22 Apr 25 Duration Returns 1 Month 9% 3 Month 13.9% 6 Month 6.8% 1 Year 18.4% 3 Year 20.1% 5 Year 29.2% 10 Year 15 Year Since launch 20.7% Historical performance (Yearly) on absolute basis
Year Returns 2023 10.3% 2022 24.2% 2021 20.7% 2020 29.7% 2019 -10.6% 2018 10.7% 2017 -1.2% 2016 44.1% 2015 11.5% 2014 -6% Fund Manager information for Nippon India Banking Fund
Name Since Tenure Vinay Sharma 9 Apr 18 6.98 Yr. Kinjal Desai 25 May 18 6.85 Yr. Bhavik Dave 18 Jun 21 3.79 Yr. Data below for Nippon India Banking Fund as on 31 Mar 25
Equity Sector Allocation
Sector Value Financial Services 95.28% Technology 2.81% Asset Allocation
Asset Class Value Cash 1.91% Equity 98.09% Top Securities Holdings / Portfolio
Name Holding Value Quantity HDFC Bank Ltd (Financial Services)
Equity, Since 31 Jul 08 | HDFCBANK21% ₹1,311 Cr 7,564,660
↓ -150,000 ICICI Bank Ltd (Financial Services)
Equity, Since 31 Oct 09 | ICICIBANK16% ₹953 Cr 7,915,358 Axis Bank Ltd (Financial Services)
Equity, Since 30 Jun 17 | 53221510% ₹589 Cr 5,800,228 State Bank of India (Financial Services)
Equity, Since 31 Mar 14 | SBIN5% ₹307 Cr 4,459,330 IndusInd Bank Ltd (Financial Services)
Equity, Since 31 May 19 | INDUSINDBK4% ₹260 Cr 2,627,608 SBI Cards and Payment Services Ltd Ordinary Shares (Financial Services)
Equity, Since 31 Jul 20 | SBICARD4% ₹228 Cr 2,720,827 Bajaj Finserv Ltd (Financial Services)
Equity, Since 31 Oct 23 | 5329784% ₹215 Cr 1,146,038 Kotak Mahindra Bank Ltd (Financial Services)
Equity, Since 31 Jul 23 | KOTAKBANK3% ₹201 Cr 1,055,000
↓ -455,000 Cholamandalam Financial Holdings Ltd (Financial Services)
Equity, Since 30 Apr 19 | CHOLAHLDNG3% ₹191 Cr 1,160,355 SBI Life Insurance Co Ltd (Financial Services)
Equity, Since 30 Nov 20 | SBILIFE3% ₹186 Cr 1,300,170
Things to be Considered During Lump Sum Investment
Before investing in Mutual Funds individuals need to take care a lot of parameters. It includes:
Timing the Market
When it comes to lump sum investing, individuals need to always look for Market timings especially with respect to equity-based funds. A good timing to invest lump sum is when the markets are low and there’s a scope that they will start appreciating soon. However, in case if the markets are already at peak then, it is better to stay off from lump sum investment.
Diversification
Diversification is also an important aspect that needs to be considered before investing lump sum. Individuals in case of lump sum investment should diversify their investments by spreading into multiple avenues. This will help to ensure that their overall portfolio performs well even if one of the schemes doesn’t perform.
Do Your Investment as per Your Objective
Any investment that individuals do is to attain a particular objective. Therefore, individuals should check whether the scheme’s approach is in-line with the investor’s objective. Here, individuals should look for various parameters such as CAGR returns, Absolute returns, the impact of taxation and much more before investing in the scheme.
Redemption should be done at the Correct Time
Individuals should do their Redemption at the correct time in lump sum investment. Though it can be as per the investment objective yet; individuals should do a timely review of the scheme in which they are planning to invest. However, they also need to hold their investments for a longer duration so that they can enjoy maximum benefits.
Mutual Fund Lump Sum Return Calculator
Mutual Fund lump sum return calculator helps individuals to show how the lump sum investment of an individual grows over a given timeframe. Some of the data that needs to input in the lump sum calculator includes the tenure of the investment, initial investment amount, long-term expected growth rate and much more. An illustration of the Mutual Fund lump sum return calculator is as follows.
ILLUSTRATION
Lump Sum Investment: INR 25,000
Investment Tenure: 15 Years
Long-term Growth Rate (Approx.): 15%
Expected Returns as per Lump Sum Calculator: INR 2,03,427
Net Profit on the Investment: INR 1,78,427
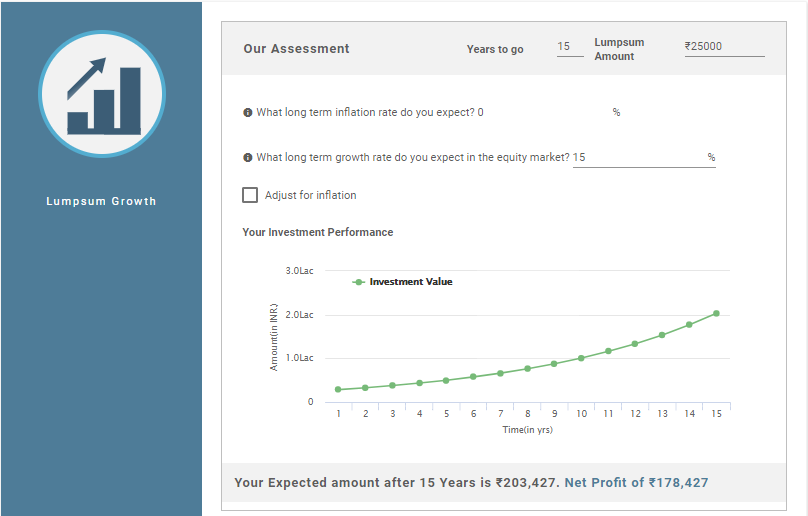
Thus, the above calculation shows that the net profit on the investment on your investment is INR 1,78,427 while the total value of your investment is INR 2,03,427.
Advantages and Disadvantages of One-Time Investment in Mutual Fund
Similar to SIP, Lump Sum Investment also has its own set of advantages and disadvantages. So, let us look at these advantages and disadvantages.
Advantages
The advantages of Lump Sum investment are as follows.
- Invest Big Amount: Individuals can invest big amounts in Mutual Funds and earn higher returns instead of keeping the funds idle.
- Ideal for Long Term: Lump Sum mode of investment is good for long-term investments specially in case of equity funds. However, in case of debt funds, the tenure can be short or medium-term
- Convenience: Lump sum mode of investment is convenient as the payment is done only once and is not deducted at regular intervals.
Disadvantages
The disadvantages of Lump Sum investment are:
- Irregular Investment: Lump Sum investment does not ensure regular savings of an investor as it does not instil regular savings habit.
- Higher Risk: In Lump Sum investing, it is important to look at the timings. This is because in lump sum mode the investment is done only once and not at regular intervals. Therefore, if individuals do not consider the timing, then they might end up in losses.
Conclusion
Thus, from the above pointers, it can be said that lump sum mode is also a good way to invest in Mutual Funds. However, individuals need to be confident while investing a lump sum amount in the scheme. If not, they can choose SIP mode of investment. In addition, people should understand the scheme’s modalities before investing. If required, they can even consult a financial advisor. This will help them to ensure that their money is safe and their objectives are accomplished on time.
All efforts have been made to ensure the information provided here is accurate. However, no guarantees are made regarding correctness of data. Please verify with scheme information document before making any investment.
You Might Also Like


AMFI Registration No. 112358 | CIN: U74999MH2016PTC282153
Shepard Technologies Pvt. Ltd. (with ARN code 112358) makes no warranties or representations, express or implied, on products offered through the platform. It accepts no liability for any damages or losses, however caused, in connection with the use of, or on the reliance of its product or related services. Terms and conditions of the website are applicable.
©2025 Shepard Technologies Private Limited. All Rights Reserved