Best Debt Mutual Funds in India for 2026 | Top Funds by Tenure & Tax Benefits
Best debt funds vary according to the tenor of investment of the investor. Investors need to be clear on their time horizon of investment when selecting the best debt fund for their investment and also factor in the interest rate scenario.
For investors with a very short holding period, say for a couple of days to a month, Liquid Funds and ultra-short term funds may be relevant. When the time horizon is one to two years then short-term funds may be the desired vehicle. For longer tenors, for more than 3 years, long-term debt funds are the most preferred instruments by investors, especially during falling interest rates. Above all, debt funds have proved to be less risky than equities when looking for short-term investments, however, the Volatility of long-term income funds may match that of equities.

As debt funds invest in fixed income instruments like government securities, treasury bills, corporate Bonds, etc., they have the capacity of generating consistent and regular returns over time. However, there are many qualitative and quantitative factors that one needs to understand before selecting the best debt funds to invest, viz - AUM, Average Maturity, Taxation, the credit quality of the Portfolio, etc. Below we have listed the top 5 best debt funds to invest across the various categories of debt funds - Best Liquid Funds, best ultra short-term funds, best short-term funds, best long-term funds and best Gilt Funds to invest in 2026 - 2027.
Quick Summary
✅ Best for short-term: Liquid, Ultra-Short, and Money market funds
✅ Best for 1–2 years: Short-term bond funds
✅ Best for 3+ years: Gilt funds, Corporate bond funds, Dynamic Bond Funds
✅ Risks: Credit risk, Interest rate risk
✅ Tax: 20% with indexation if held for more than 3 years
Why To Invest in Debt Mutual Funds?
Debt funds are considered to be an ideal investment for generating regular income. For example, choosing dividend payout can be an option for regular income.
In debt funds, investors can withdraw required money from the investment at any point in time and can let the remaining money stay invested.
Since debt funds largely invest in government securities, corporate debt and other securities like treasury bills, etc., they are not affected by equity market volatility.
If an investor is planning to achieve short-term Financial goals or invest for short periods then debt funds can be a good option. Liquid funds, ultra short-term funds, and short-term income funds may be the desired options.
In debt funds, investors can generate fixed income every month by starting a Systematic Withdrawal Plan (SWP is a reverse of SIP / STP) to withdraw a fixed amount on a monthly basis. Also, you can change the amount of the SWP when required.
Key Benefits of Debt Funds in 2026
- Safer than equities in volatile markets
- Offer liquidity and low lock-in
- Tax-efficient with indexation benefit after 3 years
- Flexible options for all durations and risk profiles
- Suitable for conservative and semi-aggressive investors alike
Risks in Debt Mutual Funds
While Investing in debt funds, investors should be cautious about two major risks associated with them - credit risk and interest rate risk.
Credit Risk
A credit risk arises when a company that has issued the debt instruments does not make regular payments. In such cases, it has a major impact on the fund, depending on how much portion the fund has in the portfolio. Hence, it is suggested to be in debt instruments with a rating higher credit rating. An AAA rating is considered to be the highest quality with little or negligible payment default risk.
Interest Risks
The interest rate risk refers to a change in the bond price due to the change in the prevailing interest rate. When the interest rate rises in the economy the bond prices fall down and vice versa. The higher the maturity of the funds’ portfolio, the more prone it is to the interest rate risk. So in a rising interest rate scenario, it is advisable to go for lower maturity debt funds. And the reverse in a falling interest rate scenario.
Debt Mutual Fund Taxation
Tax implication on debt funds is computed in the following manner-
a. Short Term Capital Gains
If the holding period of a debt investment is less than 36 months, then it is classified as a short-term investment and these are taxed as per individual's tax slab.
b. Long Term Capital Gains
If the holding period of debt investment is more than 36 months, then it is classified as a long-term investment and is taxed at 20% with an indexation benefit.
| Capital Gains | Investment Holding Gains | Taxation |
|---|---|---|
| Short Term Capital Gains | Less than 36 months | As per individual's tax slab |
| Long Term Capital Gains | More than 36 months | 20% with indexation benefits |
📌 Note: Indexation helps adjust the purchase price with inflation, effectively reducing your tax liability.
Talk to our investment specialist
Best Debt Mutual Funds in India for Investments FY 26 - 27
Fund Selection Methodology used to find 5 funds
Top 5 Liquid Mutual Funds
Top Liquid funds with AUM/Net Assets > 10,000 Crore.
Fund NAV Net Assets (Cr) Min Investment 1 MO (%) 3 MO (%) 6 MO (%) 1 YR (%) 2024 (%) Debt Yield (YTM) Mod. Duration Eff. Maturity Axis Liquid Fund Growth ₹3,050.88
↑ 0.75 ₹43,636 500 0.8 1.7 3.2 6.3 6.6 6.36% 1M 11D 1M 14D Aditya Birla Sun Life Liquid Fund Growth ₹441.402
↑ 0.10 ₹51,838 5,000 0.8 1.7 3.2 6.3 6.5 6.54% 1M 20D 1M 20D Invesco India Liquid Fund Growth ₹3,764.73
↑ 0.95 ₹15,423 5,000 0.8 1.7 3.2 6.3 6.5 6.12% 1M 10D 1M 10D Tata Liquid Fund Growth ₹4,313.78
↑ 1.09 ₹33,869 5,000 0.8 1.7 3.2 6.3 6.5 6.21% 1M 7D 1M 7D Nippon India Liquid Fund Growth ₹6,683.72
↑ 1.58 ₹32,736 100 0.8 1.7 3.2 6.3 6.5 6.66% 1M 21D 1M 25D Note: Returns up to 1 year are on absolute basis & more than 1 year are on CAGR basis. as on 15 Apr 26 Research Highlights & Commentary of 5 Funds showcased
Commentary Axis Liquid Fund Aditya Birla Sun Life Liquid Fund Invesco India Liquid Fund Tata Liquid Fund Nippon India Liquid Fund Point 1 Upper mid AUM (₹43,636 Cr). Highest AUM (₹51,838 Cr). Bottom quartile AUM (₹15,423 Cr). Lower mid AUM (₹33,869 Cr). Bottom quartile AUM (₹32,736 Cr). Point 2 Established history (16+ yrs). Oldest track record among peers (22 yrs). Established history (19+ yrs). Established history (21+ yrs). Established history (22+ yrs). Point 3 Top rated. Rating: 4★ (upper mid). Rating: 4★ (lower mid). Rating: 4★ (bottom quartile). Rating: 4★ (bottom quartile). Point 4 Risk profile: Low. Risk profile: Low. Risk profile: Low. Risk profile: Low. Risk profile: Low. Point 5 1Y return: 6.31% (top quartile). 1Y return: 6.27% (upper mid). 1Y return: 6.27% (lower mid). 1Y return: 6.26% (bottom quartile). 1Y return: 6.25% (bottom quartile). Point 6 1M return: 0.78% (top quartile). 1M return: 0.77% (upper mid). 1M return: 0.77% (bottom quartile). 1M return: 0.75% (bottom quartile). 1M return: 0.77% (lower mid). Point 7 Sharpe: 2.99 (upper mid). Sharpe: 2.87 (lower mid). Sharpe: 2.99 (top quartile). Sharpe: 2.84 (bottom quartile). Sharpe: 2.60 (bottom quartile). Point 8 Information ratio: 0.00 (top quartile). Information ratio: 0.00 (upper mid). Information ratio: 0.00 (lower mid). Information ratio: 0.00 (bottom quartile). Information ratio: 0.00 (bottom quartile). Point 9 Yield to maturity (debt): 6.36% (lower mid). Yield to maturity (debt): 6.54% (upper mid). Yield to maturity (debt): 6.12% (bottom quartile). Yield to maturity (debt): 6.21% (bottom quartile). Yield to maturity (debt): 6.66% (top quartile). Point 10 Modified duration: 0.12 yrs (lower mid). Modified duration: 0.14 yrs (bottom quartile). Modified duration: 0.11 yrs (upper mid). Modified duration: 0.10 yrs (top quartile). Modified duration: 0.14 yrs (bottom quartile). Axis Liquid Fund
Aditya Birla Sun Life Liquid Fund
Invesco India Liquid Fund
Tata Liquid Fund
Nippon India Liquid Fund
Top 5 Ultra Short Term Bond Mutual Funds
Top Ultra Short Bond funds with AUM/Net Assets > 1,000 Crore.
Fund NAV Net Assets (Cr) Min Investment 3 MO (%) 6 MO (%) 1 YR (%) 3 YR (%) 2024 (%) Debt Yield (YTM) Mod. Duration Eff. Maturity Aditya Birla Sun Life Savings Fund Growth ₹575.846
↑ 0.40 ₹21,467 1,000 1.6 3 6.7 7.3 7.4 7.14% 5M 23D 6M 18D UTI Ultra Short Term Fund Growth ₹4,435.35
↑ 3.01 ₹3,946 5,000 1.6 2.8 6 6.8 6.6 6.76% 4M 23D 5M 19D ICICI Prudential Ultra Short Term Fund Growth ₹29.0747
↑ 0.02 ₹14,897 5,000 1.7 3 6.5 7.1 7.1 7.11% 5M 8D 6M 14D SBI Magnum Ultra Short Duration Fund Growth ₹6,270.15
↑ 4.16 ₹13,685 5,000 1.7 3 6.4 7.1 7 6.47% 4M 13D 6M Invesco India Ultra Short Term Fund Growth ₹2,826.66
↑ 2.19 ₹1,292 5,000 1.7 3 6.2 6.9 6.8 6.95% 5M 2D 5M 10D Note: Returns up to 1 year are on absolute basis & more than 1 year are on CAGR basis. as on 15 Apr 26 Research Highlights & Commentary of 5 Funds showcased
Commentary Aditya Birla Sun Life Savings Fund UTI Ultra Short Term Fund ICICI Prudential Ultra Short Term Fund SBI Magnum Ultra Short Duration Fund Invesco India Ultra Short Term Fund Point 1 Highest AUM (₹21,467 Cr). Bottom quartile AUM (₹3,946 Cr). Upper mid AUM (₹14,897 Cr). Lower mid AUM (₹13,685 Cr). Bottom quartile AUM (₹1,292 Cr). Point 2 Established history (23+ yrs). Established history (22+ yrs). Established history (14+ yrs). Oldest track record among peers (26 yrs). Established history (15+ yrs). Point 3 Top rated. Rating: 4★ (upper mid). Rating: 3★ (lower mid). Rating: 3★ (bottom quartile). Rating: 3★ (bottom quartile). Point 4 Risk profile: Moderately Low. Risk profile: Moderately Low. Risk profile: Moderate. Risk profile: Low. Risk profile: Moderate. Point 5 1Y return: 6.66% (top quartile). 1Y return: 6.04% (bottom quartile). 1Y return: 6.49% (upper mid). 1Y return: 6.41% (lower mid). 1Y return: 6.23% (bottom quartile). Point 6 1M return: 0.69% (bottom quartile). 1M return: 0.75% (bottom quartile). 1M return: 0.79% (lower mid). 1M return: 0.81% (upper mid). 1M return: 0.87% (top quartile). Point 7 Sharpe: 2.39 (top quartile). Sharpe: 1.38 (bottom quartile). Sharpe: 2.28 (upper mid). Sharpe: 2.26 (lower mid). Sharpe: 1.54 (bottom quartile). Point 8 Information ratio: 0.00 (top quartile). Information ratio: 0.00 (upper mid). Information ratio: 0.00 (lower mid). Information ratio: 0.00 (bottom quartile). Information ratio: 0.00 (bottom quartile). Point 9 Yield to maturity (debt): 7.14% (top quartile). Yield to maturity (debt): 6.76% (bottom quartile). Yield to maturity (debt): 7.11% (upper mid). Yield to maturity (debt): 6.47% (bottom quartile). Yield to maturity (debt): 6.95% (lower mid). Point 10 Modified duration: 0.48 yrs (bottom quartile). Modified duration: 0.40 yrs (upper mid). Modified duration: 0.44 yrs (bottom quartile). Modified duration: 0.37 yrs (top quartile). Modified duration: 0.42 yrs (lower mid). Aditya Birla Sun Life Savings Fund
UTI Ultra Short Term Fund
ICICI Prudential Ultra Short Term Fund
SBI Magnum Ultra Short Duration Fund
Invesco India Ultra Short Term Fund
Top and Best Floating Rate Mutual Funds
Fund NAV Net Assets (Cr) Min Investment 3 MO (%) 6 MO (%) 1 YR (%) 3 YR (%) 2024 (%) Debt Yield (YTM) Mod. Duration Eff. Maturity Aditya Birla Sun Life Floating Rate Fund - Long Term Growth ₹364.915
↑ 0.35 ₹13,462 1,000 1.5 2.8 6.4 7.5 7.7 7.03% 1Y 7D 1Y 8M 19D ICICI Prudential Floating Interest Fund Growth ₹445.954
↑ 0.67 ₹7,215 5,000 1.6 3 6.6 7.7 7.7 7.07% 1Y 8M 1D 3Y 25D Nippon India Floating Rate Fund Growth ₹47.1776
↑ 0.08 ₹8,381 5,000 1.3 2.1 6 7.5 7.9 7.04% 2Y 2M 1D 2Y 8M 5D Note: Returns up to 1 year are on absolute basis & more than 1 year are on CAGR basis. as on 15 Apr 26 Research Highlights & Commentary of 3 Funds showcased
Commentary Aditya Birla Sun Life Floating Rate Fund - Long Term ICICI Prudential Floating Interest Fund Nippon India Floating Rate Fund Point 1 Highest AUM (₹13,462 Cr). Bottom quartile AUM (₹7,215 Cr). Lower mid AUM (₹8,381 Cr). Point 2 Established history (17+ yrs). Established history (20+ yrs). Oldest track record among peers (21 yrs). Point 3 Top rated. Rating: 3★ (lower mid). Rating: 3★ (bottom quartile). Point 4 Risk profile: Moderately Low. Risk profile: Moderate. Risk profile: Moderately Low. Point 5 1Y return: 6.44% (lower mid). 1Y return: 6.62% (upper mid). 1Y return: 6.01% (bottom quartile). Point 6 1M return: 0.63% (upper mid). 1M return: 0.55% (lower mid). 1M return: 0.41% (bottom quartile). Point 7 Sharpe: 1.74 (lower mid). Sharpe: 1.91 (upper mid). Sharpe: 1.19 (bottom quartile). Point 8 Information ratio: 0.00 (upper mid). Information ratio: 0.00 (lower mid). Information ratio: 0.00 (bottom quartile). Point 9 Yield to maturity (debt): 7.03% (bottom quartile). Yield to maturity (debt): 7.07% (upper mid). Yield to maturity (debt): 7.04% (lower mid). Point 10 Modified duration: 1.02 yrs (upper mid). Modified duration: 1.67 yrs (lower mid). Modified duration: 2.17 yrs (bottom quartile). Aditya Birla Sun Life Floating Rate Fund - Long Term
ICICI Prudential Floating Interest Fund
Nippon India Floating Rate Fund
Top 5 Best Money Market Mutual Funds
Fund NAV Net Assets (Cr) Min Investment 3 MO (%) 6 MO (%) 1 YR (%) 3 YR (%) 2024 (%) Debt Yield (YTM) Mod. Duration Eff. Maturity Aditya Birla Sun Life Money Manager Fund Growth ₹388.997
↑ 0.26 ₹30,778 1,000 1.7 3 6.6 7.4 7.4 7.02% 7M 17D 7M 20D UTI Money Market Fund Growth ₹3,243.11
↑ 2.29 ₹20,320 10,000 1.7 3.1 6.6 7.4 7.5 6.03% 7M 7M ICICI Prudential Money Market Fund Growth ₹399.009
↑ 0.29 ₹32,236 500 1.7 3.1 6.6 7.4 7.4 6.77% 7M 21D 8M 9D Kotak Money Market Scheme Growth ₹4,721.62
↑ 3.34 ₹33,661 5,000 1.7 3.1 6.6 7.4 7.4 6.84% 7M 24D 7M 24D Tata Money Market Fund Growth ₹4,965.1
↑ 3.63 ₹33,999 5,000 1.7 3.1 6.6 7.4 7.4 6.64% 6D 6D Note: Returns up to 1 year are on absolute basis & more than 1 year are on CAGR basis. as on 15 Apr 26 Research Highlights & Commentary of 5 Funds showcased
Commentary Aditya Birla Sun Life Money Manager Fund UTI Money Market Fund ICICI Prudential Money Market Fund Kotak Money Market Scheme Tata Money Market Fund Point 1 Bottom quartile AUM (₹30,778 Cr). Bottom quartile AUM (₹20,320 Cr). Lower mid AUM (₹32,236 Cr). Upper mid AUM (₹33,661 Cr). Highest AUM (₹33,999 Cr). Point 2 Established history (20+ yrs). Established history (16+ yrs). Established history (20+ yrs). Oldest track record among peers (22 yrs). Established history (22+ yrs). Point 3 Top rated. Rating: 4★ (upper mid). Rating: 4★ (lower mid). Rating: 4★ (bottom quartile). Rating: 3★ (bottom quartile). Point 4 Risk profile: Low. Risk profile: Low. Risk profile: Low. Risk profile: Low. Risk profile: Low. Point 5 1Y return: 6.58% (bottom quartile). 1Y return: 6.61% (top quartile). 1Y return: 6.58% (lower mid). 1Y return: 6.57% (bottom quartile). 1Y return: 6.58% (upper mid). Point 6 1M return: 0.88% (top quartile). 1M return: 0.86% (lower mid). 1M return: 0.84% (bottom quartile). 1M return: 0.85% (bottom quartile). 1M return: 0.87% (upper mid). Point 7 Sharpe: 2.09 (bottom quartile). Sharpe: 2.45 (upper mid). Sharpe: 2.51 (top quartile). Sharpe: 2.32 (bottom quartile). Sharpe: 2.38 (lower mid). Point 8 Information ratio: 0.00 (top quartile). Information ratio: 0.00 (upper mid). Information ratio: 0.00 (lower mid). Information ratio: 0.00 (bottom quartile). Information ratio: 0.00 (bottom quartile). Point 9 Yield to maturity (debt): 7.02% (top quartile). Yield to maturity (debt): 6.03% (bottom quartile). Yield to maturity (debt): 6.77% (lower mid). Yield to maturity (debt): 6.84% (upper mid). Yield to maturity (debt): 6.64% (bottom quartile). Point 10 Modified duration: 0.63 yrs (lower mid). Modified duration: 0.58 yrs (upper mid). Modified duration: 0.64 yrs (bottom quartile). Modified duration: 0.65 yrs (bottom quartile). Modified duration: 0.02 yrs (top quartile). Aditya Birla Sun Life Money Manager Fund
UTI Money Market Fund
ICICI Prudential Money Market Fund
Kotak Money Market Scheme
Tata Money Market Fund
Top 5 Short Term Bond Mutual Funds
Fund NAV Net Assets (Cr) 3 MO (%) 6 MO (%) 1 YR (%) 3 YR (%) 2024 (%) Debt Yield (YTM) Mod. Duration Eff. Maturity PGIM India Short Maturity Fund Growth ₹39.3202
↓ 0.00 ₹28 1.2 3.1 6.1 4.2 7.18% 1Y 7M 28D 1Y 11M 1D ICICI Prudential Short Term Fund Growth ₹62.9332
↑ 0.12 ₹21,510 1.4 2.4 6.1 7.5 8 7.41% 2Y 8M 23D 4Y 6M 11D Nippon India Short Term Fund Growth ₹55.0161
↑ 0.10 ₹8,367 1.2 2 5.8 7.2 7.9 7.28% 2Y 5M 23D 3Y Aditya Birla Sun Life Short Term Opportunities Fund Growth ₹49.5386
↑ 0.07 ₹9,386 1.1 2 5.5 7.1 7.7 7.29% 2Y 4M 2D 2Y 11M 26D UTI Short Term Income Fund Growth ₹32.953
↑ 0.05 ₹3,090 1.1 1.8 5.3 7 7.3 7.19% 2Y 5M 16D 3Y 5M 16D Note: Returns up to 1 year are on absolute basis & more than 1 year are on CAGR basis. as on 29 Sep 23 Research Highlights & Commentary of 5 Funds showcased
Commentary PGIM India Short Maturity Fund ICICI Prudential Short Term Fund Nippon India Short Term Fund Aditya Birla Sun Life Short Term Opportunities Fund UTI Short Term Income Fund Point 1 Bottom quartile AUM (₹28 Cr). Highest AUM (₹21,510 Cr). Lower mid AUM (₹8,367 Cr). Upper mid AUM (₹9,386 Cr). Bottom quartile AUM (₹3,090 Cr). Point 2 Established history (23+ yrs). Oldest track record among peers (24 yrs). Established history (23+ yrs). Established history (22+ yrs). Established history (18+ yrs). Point 3 Top rated. Rating: 4★ (upper mid). Rating: 4★ (lower mid). Rating: 4★ (bottom quartile). Rating: 4★ (bottom quartile). Point 4 Risk profile: Moderate. Risk profile: Moderate. Risk profile: Moderately Low. Risk profile: Moderate. Risk profile: Moderate. Point 5 1Y return: 6.08% (upper mid). 1Y return: 6.08% (top quartile). 1Y return: 5.77% (lower mid). 1Y return: 5.53% (bottom quartile). 1Y return: 5.31% (bottom quartile). Point 6 1M return: 0.43% (upper mid). 1M return: 0.55% (top quartile). 1M return: 0.34% (lower mid). 1M return: 0.33% (bottom quartile). 1M return: 0.33% (bottom quartile). Point 7 Sharpe: -0.98 (bottom quartile). Sharpe: 1.37 (top quartile). Sharpe: 1.03 (upper mid). Sharpe: 0.91 (lower mid). Sharpe: 0.81 (bottom quartile). Point 8 Information ratio: 0.00 (top quartile). Information ratio: 0.00 (upper mid). Information ratio: 0.00 (lower mid). Information ratio: 0.00 (bottom quartile). Information ratio: 0.00 (bottom quartile). Point 9 Yield to maturity (debt): 7.18% (bottom quartile). Yield to maturity (debt): 7.41% (top quartile). Yield to maturity (debt): 7.28% (lower mid). Yield to maturity (debt): 7.29% (upper mid). Yield to maturity (debt): 7.19% (bottom quartile). Point 10 Modified duration: 1.66 yrs (top quartile). Modified duration: 2.73 yrs (bottom quartile). Modified duration: 2.48 yrs (bottom quartile). Modified duration: 2.34 yrs (upper mid). Modified duration: 2.46 yrs (lower mid). PGIM India Short Maturity Fund
ICICI Prudential Short Term Fund
Nippon India Short Term Fund
Aditya Birla Sun Life Short Term Opportunities Fund
UTI Short Term Income Fund
Top 5 Medium to Long Term Bond Mutual Funds
Top Medium to Long Term Bond funds with AUM/Net Assets > 500 Crore.
Fund NAV Net Assets (Cr) 3 MO (%) 6 MO (%) 1 YR (%) 3 YR (%) 2024 (%) Debt Yield (YTM) Mod. Duration Eff. Maturity SBI Magnum Income Fund Growth ₹72.2943
↑ 0.19 ₹2,080 1 1 3.1 6.5 5.9 7.51% 4Y 3M 14D 7Y 8M 16D ICICI Prudential Bond Fund Growth ₹41.182
↑ 0.11 ₹2,768 0.8 0.8 3.3 7 6.7 7.27% 6Y 6M 7D 16Y 7M 13D Aditya Birla Sun Life Income Fund Growth ₹127.1
↑ 0.39 ₹1,966 0.6 0.1 1.8 6 5.1 7.23% 6Y 6M 14Y 4M 6D Kotak Bond Fund Growth ₹77.9521
↑ 0.20 ₹1,908 0.6 0.3 2.2 6.2 5.4 7.42% 6Y 5M 26D 12Y 7M 13D HDFC Income Fund Growth ₹59.1401
↑ 0.20 ₹856 0.7 0.6 2.1 6.3 5.5 6.91% 6Y 5M 1D 12Y 5M 26D Note: Returns up to 1 year are on absolute basis & more than 1 year are on CAGR basis. as on 15 Apr 26 Research Highlights & Commentary of 5 Funds showcased
Commentary SBI Magnum Income Fund ICICI Prudential Bond Fund Aditya Birla Sun Life Income Fund Kotak Bond Fund HDFC Income Fund Point 1 Upper mid AUM (₹2,080 Cr). Highest AUM (₹2,768 Cr). Lower mid AUM (₹1,966 Cr). Bottom quartile AUM (₹1,908 Cr). Bottom quartile AUM (₹856 Cr). Point 2 Established history (27+ yrs). Established history (17+ yrs). Oldest track record among peers (30 yrs). Established history (26+ yrs). Established history (25+ yrs). Point 3 Top rated. Rating: 3★ (upper mid). Rating: 3★ (lower mid). Rating: 2★ (bottom quartile). Rating: 2★ (bottom quartile). Point 4 Risk profile: Moderate. Risk profile: Moderate. Risk profile: Moderate. Risk profile: Moderate. Risk profile: Moderate. Point 5 1Y return: 3.06% (upper mid). 1Y return: 3.26% (top quartile). 1Y return: 1.78% (bottom quartile). 1Y return: 2.22% (lower mid). 1Y return: 2.12% (bottom quartile). Point 6 1M return: 0.31% (top quartile). 1M return: -0.05% (lower mid). 1M return: -0.05% (bottom quartile). 1M return: 0.15% (upper mid). 1M return: -0.15% (bottom quartile). Point 7 Sharpe: -0.06 (upper mid). Sharpe: 0.20 (top quartile). Sharpe: -0.19 (bottom quartile). Sharpe: -0.12 (bottom quartile). Sharpe: -0.10 (lower mid). Point 8 Information ratio: 0.00 (top quartile). Information ratio: 0.00 (upper mid). Information ratio: 0.00 (lower mid). Information ratio: 0.00 (bottom quartile). Information ratio: 0.00 (bottom quartile). Point 9 Yield to maturity (debt): 7.51% (top quartile). Yield to maturity (debt): 7.27% (lower mid). Yield to maturity (debt): 7.23% (bottom quartile). Yield to maturity (debt): 7.42% (upper mid). Yield to maturity (debt): 6.91% (bottom quartile). Point 10 Modified duration: 4.29 yrs (top quartile). Modified duration: 6.52 yrs (bottom quartile). Modified duration: 6.50 yrs (bottom quartile). Modified duration: 6.49 yrs (lower mid). Modified duration: 6.42 yrs (upper mid). SBI Magnum Income Fund
ICICI Prudential Bond Fund
Aditya Birla Sun Life Income Fund
Kotak Bond Fund
HDFC Income Fund
Top 5 Banking and PSU Debt Mutual Funds
Fund NAV Net Assets (Cr) 3 MO (%) 6 MO (%) 1 YR (%) 3 YR (%) 2024 (%) Debt Yield (YTM) Mod. Duration Eff. Maturity UTI Banking & PSU Debt Fund Growth ₹22.9513
↑ 0.03 ₹1,099 1.5 2.5 6.3 7.1 7.8 6.87% 1Y 18D 1Y 1M 20D HDFC Banking and PSU Debt Fund Growth ₹23.8555
↑ 0.05 ₹5,599 1 1.7 5 7 7.5 7.14% 3Y 1M 6D 4Y 4M 2D ICICI Prudential Banking and PSU Debt Fund Growth ₹34.0962
↑ 0.07 ₹9,293 1.2 2.1 5.5 7.2 7.6 7.21% 3Y 3M 22D 5Y 11M 8D Kotak Banking and PSU Debt fund Growth ₹68.1239
↑ 0.14 ₹5,409 1.2 2.1 5.5 7.2 7.7 7.17% 3Y 2M 8D 4Y 14D Aditya Birla Sun Life Banking & PSU Debt Fund Growth ₹380.286
↑ 0.64 ₹8,991 1.2 1.7 5 7 7.3 7.13% 3Y 3M 4D 4Y 6M 7D Note: Returns up to 1 year are on absolute basis & more than 1 year are on CAGR basis. as on 15 Apr 26 Research Highlights & Commentary of 5 Funds showcased
Commentary UTI Banking & PSU Debt Fund HDFC Banking and PSU Debt Fund ICICI Prudential Banking and PSU Debt Fund Kotak Banking and PSU Debt fund Aditya Birla Sun Life Banking & PSU Debt Fund Point 1 Bottom quartile AUM (₹1,099 Cr). Lower mid AUM (₹5,599 Cr). Highest AUM (₹9,293 Cr). Bottom quartile AUM (₹5,409 Cr). Upper mid AUM (₹8,991 Cr). Point 2 Established history (12+ yrs). Established history (12+ yrs). Established history (16+ yrs). Oldest track record among peers (27 yrs). Established history (17+ yrs). Point 3 Top rated. Rating: 5★ (upper mid). Rating: 4★ (lower mid). Rating: 4★ (bottom quartile). Rating: 4★ (bottom quartile). Point 4 Risk profile: Moderate. Risk profile: Moderately Low. Risk profile: Moderate. Risk profile: Moderately Low. Risk profile: Moderate. Point 5 1Y return: 6.30% (top quartile). 1Y return: 5.03% (bottom quartile). 1Y return: 5.53% (upper mid). 1Y return: 5.49% (lower mid). 1Y return: 5.00% (bottom quartile). Point 6 1M return: 0.77% (top quartile). 1M return: 0.34% (bottom quartile). 1M return: 0.50% (upper mid). 1M return: 0.42% (bottom quartile). 1M return: 0.48% (lower mid). Point 7 Sharpe: 1.24 (top quartile). Sharpe: 0.66 (bottom quartile). Sharpe: 0.96 (upper mid). Sharpe: 0.85 (lower mid). Sharpe: 0.56 (bottom quartile). Point 8 Information ratio: 0.00 (top quartile). Information ratio: 0.00 (upper mid). Information ratio: 0.00 (lower mid). Information ratio: 0.00 (bottom quartile). Information ratio: 0.00 (bottom quartile). Point 9 Yield to maturity (debt): 6.87% (bottom quartile). Yield to maturity (debt): 7.14% (lower mid). Yield to maturity (debt): 7.21% (top quartile). Yield to maturity (debt): 7.17% (upper mid). Yield to maturity (debt): 7.13% (bottom quartile). Point 10 Modified duration: 1.05 yrs (top quartile). Modified duration: 3.10 yrs (upper mid). Modified duration: 3.31 yrs (bottom quartile). Modified duration: 3.19 yrs (lower mid). Modified duration: 3.26 yrs (bottom quartile). UTI Banking & PSU Debt Fund
HDFC Banking and PSU Debt Fund
ICICI Prudential Banking and PSU Debt Fund
Kotak Banking and PSU Debt fund
Aditya Birla Sun Life Banking & PSU Debt Fund
Top 5 Credit Risk Mutual Funds
Top Credit Risk funds with AUM/Net Assets > 500 Crore.
Fund NAV Net Assets (Cr) 3 MO (%) 6 MO (%) 1 YR (%) 3 YR (%) 2024 (%) Debt Yield (YTM) Mod. Duration Eff. Maturity HDFC Credit Risk Debt Fund Growth ₹25.3077
↑ 0.04 ₹6,891 1.8 2.8 7 7.5 8 8.31% 2Y 4M 2D 3Y 9M 7D SBI Credit Risk Fund Growth ₹48.0304
↑ 0.08 ₹2,148 2 3 6.9 7.6 7.9 8.41% 1Y 8M 5D 2Y 1M 17D Kotak Credit Risk Fund Growth ₹31.0753
↑ 0.04 ₹711 1.4 2.6 7.8 7.5 9.1 8.11% 2Y 3M 7D 2Y 11M 5D Nippon India Credit Risk Fund Growth ₹37.0269
↑ 0.06 ₹1,059 1.9 3.2 7.8 8.2 8.9 8.72% 1Y 11M 23D 2Y 4M 28D ICICI Prudential Regular Savings Fund Growth ₹33.8174
↑ 0.05 ₹5,887 1.8 3.4 8.5 8.3 9.5 8.41% 2Y 3M 14D 3Y 7M 24D Note: Returns up to 1 year are on absolute basis & more than 1 year are on CAGR basis. as on 15 Apr 26 Research Highlights & Commentary of 5 Funds showcased
Commentary HDFC Credit Risk Debt Fund SBI Credit Risk Fund Kotak Credit Risk Fund Nippon India Credit Risk Fund ICICI Prudential Regular Savings Fund Point 1 Highest AUM (₹6,891 Cr). Lower mid AUM (₹2,148 Cr). Bottom quartile AUM (₹711 Cr). Bottom quartile AUM (₹1,059 Cr). Upper mid AUM (₹5,887 Cr). Point 2 Established history (12+ yrs). Oldest track record among peers (21 yrs). Established history (15+ yrs). Established history (20+ yrs). Established history (15+ yrs). Point 3 Top rated. Rating: 4★ (upper mid). Rating: 3★ (lower mid). Rating: 2★ (bottom quartile). Rating: 1★ (bottom quartile). Point 4 Risk profile: Moderate. Risk profile: Moderate. Risk profile: Moderately Low. Risk profile: Moderate. Risk profile: Moderate. Point 5 1Y return: 6.96% (bottom quartile). 1Y return: 6.89% (bottom quartile). 1Y return: 7.78% (upper mid). 1Y return: 7.77% (lower mid). 1Y return: 8.46% (top quartile). Point 6 1M return: 0.75% (lower mid). 1M return: 0.91% (upper mid). 1M return: 0.66% (bottom quartile). 1M return: 0.61% (bottom quartile). 1M return: 1.03% (top quartile). Point 7 Sharpe: 1.57 (bottom quartile). Sharpe: 1.78 (bottom quartile). Sharpe: 2.16 (lower mid). Sharpe: 2.51 (upper mid). Sharpe: 3.19 (top quartile). Point 8 Information ratio: 0.00 (top quartile). Information ratio: 0.00 (upper mid). Information ratio: 0.00 (lower mid). Information ratio: 0.00 (bottom quartile). Information ratio: 0.00 (bottom quartile). Point 9 Yield to maturity (debt): 8.31% (bottom quartile). Yield to maturity (debt): 8.41% (upper mid). Yield to maturity (debt): 8.11% (bottom quartile). Yield to maturity (debt): 8.72% (top quartile). Yield to maturity (debt): 8.41% (lower mid). Point 10 Modified duration: 2.34 yrs (bottom quartile). Modified duration: 1.68 yrs (top quartile). Modified duration: 2.27 yrs (lower mid). Modified duration: 1.98 yrs (upper mid). Modified duration: 2.29 yrs (bottom quartile). HDFC Credit Risk Debt Fund
SBI Credit Risk Fund
Kotak Credit Risk Fund
Nippon India Credit Risk Fund
ICICI Prudential Regular Savings Fund
Top 5 Dynamic Bond Mutual Funds
Top Dynamic Bond funds with AUM/Net Assets > 500 Crore.
Fund NAV Net Assets (Cr) 3 MO (%) 6 MO (%) 1 YR (%) 3 YR (%) 2024 (%) Debt Yield (YTM) Mod. Duration Eff. Maturity SBI Dynamic Bond Fund Growth ₹36.7171
↑ 0.06 ₹4,064 1.6 1.6 3.2 6.8 5.5 7.02% 3Y 3M 11D 10Y 1M 2D Axis Dynamic Bond Fund Growth ₹30.7025
↑ 0.10 ₹1,132 1.6 1.8 4.4 7.1 7.1 7.18% 5Y 4M 28D 9Y 4M 24D Aditya Birla Sun Life Dynamic Bond Fund Growth ₹47.8183
↑ 0.12 ₹1,886 1.2 1.4 3.9 7.1 7 7.56% 4Y 3M 25D 7Y 8M 8D Bandhan Dynamic Bond Fund Growth ₹34.7298
↑ 0.12 ₹2,196 2.1 2.3 1.8 6.4 3.4 6.65% 1Y 1M 10D 2Y 2M 23D HDFC Dynamic Debt Fund Growth ₹90.7172
↑ 0.28 ₹634 0.8 0.2 1.6 6.1 4.7 7.05% 7Y 3M 14D 19Y 2M 8D Note: Returns up to 1 year are on absolute basis & more than 1 year are on CAGR basis. as on 15 Apr 26 Research Highlights & Commentary of 5 Funds showcased
Commentary SBI Dynamic Bond Fund Axis Dynamic Bond Fund Aditya Birla Sun Life Dynamic Bond Fund Bandhan Dynamic Bond Fund HDFC Dynamic Debt Fund Point 1 Highest AUM (₹4,064 Cr). Bottom quartile AUM (₹1,132 Cr). Lower mid AUM (₹1,886 Cr). Upper mid AUM (₹2,196 Cr). Bottom quartile AUM (₹634 Cr). Point 2 Established history (22+ yrs). Established history (14+ yrs). Established history (21+ yrs). Established history (17+ yrs). Oldest track record among peers (28 yrs). Point 3 Top rated. Rating: 3★ (upper mid). Rating: 3★ (lower mid). Rating: 3★ (bottom quartile). Rating: 3★ (bottom quartile). Point 4 Risk profile: Moderate. Risk profile: Moderate. Risk profile: Moderate. Risk profile: Moderate. Risk profile: Moderate. Point 5 1Y return: 3.16% (lower mid). 1Y return: 4.44% (top quartile). 1Y return: 3.95% (upper mid). 1Y return: 1.79% (bottom quartile). 1Y return: 1.57% (bottom quartile). Point 6 1M return: 0.22% (bottom quartile). 1M return: 0.60% (upper mid). 1M return: 0.24% (lower mid). 1M return: 1.29% (top quartile). 1M return: -0.18% (bottom quartile). Point 7 Sharpe: 0.08 (lower mid). Sharpe: 0.55 (top quartile). Sharpe: 0.41 (upper mid). Sharpe: -0.23 (bottom quartile). Sharpe: -0.21 (bottom quartile). Point 8 Information ratio: 0.00 (top quartile). Information ratio: 0.00 (upper mid). Information ratio: 0.00 (lower mid). Information ratio: 0.00 (bottom quartile). Information ratio: 0.00 (bottom quartile). Point 9 Yield to maturity (debt): 7.02% (bottom quartile). Yield to maturity (debt): 7.18% (upper mid). Yield to maturity (debt): 7.56% (top quartile). Yield to maturity (debt): 6.65% (bottom quartile). Yield to maturity (debt): 7.05% (lower mid). Point 10 Modified duration: 3.28 yrs (upper mid). Modified duration: 5.41 yrs (bottom quartile). Modified duration: 4.32 yrs (lower mid). Modified duration: 1.11 yrs (top quartile). Modified duration: 7.29 yrs (bottom quartile). SBI Dynamic Bond Fund
Axis Dynamic Bond Fund
Aditya Birla Sun Life Dynamic Bond Fund
Bandhan Dynamic Bond Fund
HDFC Dynamic Debt Fund
Top 5 Corporate Bond Mutual Funds
Top Corporate Bond funds with AUM/Net Assets > 500 Crore.
Fund NAV Net Assets (Cr) 3 MO (%) 6 MO (%) 1 YR (%) 3 YR (%) 2024 (%) Debt Yield (YTM) Mod. Duration Eff. Maturity Aditya Birla Sun Life Corporate Bond Fund Growth ₹116.92
↑ 0.29 ₹27,913 1 1.5 4.7 7.3 7.4 7.21% 4Y 6M 25D 7Y 4D HDFC Corporate Bond Fund Growth ₹33.6519
↑ 0.08 ₹33,200 0.9 1.3 4.6 7.2 7.3 7.24% 4Y 4M 24D 7Y 6M ICICI Prudential Corporate Bond Fund Growth ₹31.1842
↑ 0.06 ₹31,713 1.4 2.3 6 7.5 8 7.26% 3Y 5M 1D 6Y Kotak Corporate Bond Fund Standard Growth ₹3,925.88
↑ 8.24 ₹17,275 1.1 1.8 5.5 7.3 7.8 7.29% 2Y 11M 26D 4Y 1M 28D Nippon India Prime Debt Fund Growth ₹62.3464
↑ 0.13 ₹8,950 1.2 1.7 5.3 7.4 7.8 7.19% 2Y 9M 11D 3Y 5M 1D Note: Returns up to 1 year are on absolute basis & more than 1 year are on CAGR basis. as on 15 Apr 26 Research Highlights & Commentary of 5 Funds showcased
Commentary Aditya Birla Sun Life Corporate Bond Fund HDFC Corporate Bond Fund ICICI Prudential Corporate Bond Fund Kotak Corporate Bond Fund Standard Nippon India Prime Debt Fund Point 1 Lower mid AUM (₹27,913 Cr). Highest AUM (₹33,200 Cr). Upper mid AUM (₹31,713 Cr). Bottom quartile AUM (₹17,275 Cr). Bottom quartile AUM (₹8,950 Cr). Point 2 Oldest track record among peers (29 yrs). Established history (15+ yrs). Established history (16+ yrs). Established history (18+ yrs). Established history (25+ yrs). Point 3 Top rated. Rating: 5★ (upper mid). Rating: 4★ (lower mid). Rating: 4★ (bottom quartile). Rating: 4★ (bottom quartile). Point 4 Risk profile: Moderately Low. Risk profile: Moderately Low. Risk profile: Moderately Low. Risk profile: Moderately Low. Risk profile: Moderately Low. Point 5 1Y return: 4.74% (bottom quartile). 1Y return: 4.65% (bottom quartile). 1Y return: 5.98% (top quartile). 1Y return: 5.46% (upper mid). 1Y return: 5.31% (lower mid). Point 6 1M return: 0.26% (bottom quartile). 1M return: 0.26% (bottom quartile). 1M return: 0.47% (top quartile). 1M return: 0.38% (lower mid). 1M return: 0.44% (upper mid). Point 7 Sharpe: 0.51 (bottom quartile). Sharpe: 0.52 (bottom quartile). Sharpe: 1.26 (top quartile). Sharpe: 0.87 (upper mid). Sharpe: 0.79 (lower mid). Point 8 Information ratio: 0.00 (top quartile). Information ratio: 0.00 (upper mid). Information ratio: 0.00 (lower mid). Information ratio: 0.00 (bottom quartile). Information ratio: 0.00 (bottom quartile). Point 9 Yield to maturity (debt): 7.21% (bottom quartile). Yield to maturity (debt): 7.24% (lower mid). Yield to maturity (debt): 7.26% (upper mid). Yield to maturity (debt): 7.29% (top quartile). Yield to maturity (debt): 7.19% (bottom quartile). Point 10 Modified duration: 4.57 yrs (bottom quartile). Modified duration: 4.40 yrs (bottom quartile). Modified duration: 3.42 yrs (lower mid). Modified duration: 2.99 yrs (upper mid). Modified duration: 2.78 yrs (top quartile). Aditya Birla Sun Life Corporate Bond Fund
HDFC Corporate Bond Fund
ICICI Prudential Corporate Bond Fund
Kotak Corporate Bond Fund Standard
Nippon India Prime Debt Fund
Top 5 Gilt Mutual Funds
Top (Erstwhile DHFL Pramerica Credit Opportunities Fund) The investment objective of the Scheme is to generate income and capital appreciation by investing predominantly in corporate debt. There can be no assurance that the investment objective of the Scheme will be realized. Research Highlights for PGIM India Credit Risk Fund Below is the key information for PGIM India Credit Risk Fund Returns up to 1 year are on (Erstwhile Axis Fixed Income Opportunities Fund) To generate stable returns by investing in debt & money market instruments across the yield curve & credit spectrum. However, there is no assurance or guarantee that the investment objective of the Scheme will be achieved. The Scheme does not assure or guarantee any returns Research Highlights for Axis Credit Risk Fund Below is the key information for Axis Credit Risk Fund Returns up to 1 year are on The primary objective of the schemes is to generate regular income through investments in debt and money market instruments. Income maybe generated through the receipt of coupon payments or the purchase and sale of securities in the underlying portfolio. The schemes will under normal market conditions, invest its net assets in fixed income securities, money market instruments, cash and cash equivalents. Research Highlights for Aditya Birla Sun Life Savings Fund Below is the key information for Aditya Birla Sun Life Savings Fund Returns up to 1 year are on (Erstwhile Aditya Birla Sun Life Floating Rate Fund - Short Term) The primary objective of the schemes is to generate regular income through investment in a portfolio comprising substantially of floating rate debt / money market instruments. The schemes may invest a portion of its net assets in fixed rate debt securities and money market instruments. Research Highlights for Aditya Birla Sun Life Money Manager Fund Below is the key information for Aditya Birla Sun Life Money Manager Fund Returns up to 1 year are on The objective of the Scheme is to generate income through investment primarily in low duration debt & money market securities. There is no assurance or guarantee that the investment objective of the scheme will be achieved. Research Highlights for PGIM India Low Duration Fund Below is the key information for PGIM India Low Duration Fund Returns up to 1 year are on GILT funds with AUM/Net Assets > 500 Crore.
Fund NAV Net Assets (Cr) 3 MO (%) 6 MO (%) 1 YR (%) 3 YR (%) 2024 (%) Debt Yield (YTM) Mod. Duration Eff. Maturity ICICI Prudential Gilt Fund Growth ₹105.191
↑ 0.40 ₹9,216 0.7 0.6 3.1 7.1 6.8 7.39% 8Y 11M 26D 20Y 8M 19D UTI Gilt Fund Growth ₹64.7639
↑ 0.12 ₹528 2.1 2.5 3.1 6.8 5.1 6.71% 6Y 8M 23D 15Y 2M 16D SBI Magnum Constant Maturity Fund Growth ₹64.9872
↑ 0.27 ₹1,773 0.4 0.7 2.6 6.9 6.7 6.81% 6Y 10M 24D 9Y 9M 4D SBI Magnum Gilt Fund Growth ₹66.807
↑ 0.13 ₹9,992 0.8 0 0.9 6.4 4.5 6.6% 5Y 2M 5D 13Y 9M 25D Nippon India Gilt Securities Fund Growth ₹38.1584
↑ 0.16 ₹1,857 0.8 -0.4 0 5.7 3.7 7.21% 8Y 9M 14D 19Y 7M 13D Note: Returns up to 1 year are on absolute basis & more than 1 year are on CAGR basis. as on 15 Apr 26 Research Highlights & Commentary of 5 Funds showcased
Commentary ICICI Prudential Gilt Fund UTI Gilt Fund SBI Magnum Constant Maturity Fund SBI Magnum Gilt Fund Nippon India Gilt Securities Fund Point 1 Upper mid AUM (₹9,216 Cr). Bottom quartile AUM (₹528 Cr). Bottom quartile AUM (₹1,773 Cr). Highest AUM (₹9,992 Cr). Lower mid AUM (₹1,857 Cr). Point 2 Oldest track record among peers (26 yrs). Established history (24+ yrs). Established history (25+ yrs). Established history (25+ yrs). Established history (17+ yrs). Point 3 Top rated. Rating: 4★ (upper mid). Rating: 4★ (lower mid). Rating: 4★ (bottom quartile). Rating: 4★ (bottom quartile). Point 4 Risk profile: Moderate. Risk profile: Moderate. Risk profile: Moderately Low. Risk profile: Moderate. Risk profile: Moderate. Point 5 1Y return: 3.10% (top quartile). 1Y return: 3.09% (upper mid). 1Y return: 2.63% (lower mid). 1Y return: 0.94% (bottom quartile). 1Y return: 0.02% (bottom quartile). Point 6 1M return: -0.13% (lower mid). 1M return: 0.79% (top quartile). 1M return: -0.81% (bottom quartile). 1M return: -0.34% (bottom quartile). 1M return: 0.19% (upper mid). Point 7 Sharpe: 0.31 (top quartile). Sharpe: 0.07 (lower mid). Sharpe: 0.24 (upper mid). Sharpe: -0.15 (bottom quartile). Sharpe: -0.38 (bottom quartile). Point 8 Information ratio: 0.00 (top quartile). Information ratio: 0.00 (upper mid). Information ratio: 0.00 (lower mid). Information ratio: 0.00 (bottom quartile). Information ratio: 0.00 (bottom quartile). Point 9 Yield to maturity (debt): 7.39% (top quartile). Yield to maturity (debt): 6.71% (bottom quartile). Yield to maturity (debt): 6.81% (lower mid). Yield to maturity (debt): 6.60% (bottom quartile). Yield to maturity (debt): 7.21% (upper mid). Point 10 Modified duration: 8.99 yrs (bottom quartile). Modified duration: 6.73 yrs (upper mid). Modified duration: 6.90 yrs (lower mid). Modified duration: 5.18 yrs (top quartile). Modified duration: 8.79 yrs (bottom quartile). ICICI Prudential Gilt Fund
UTI Gilt Fund
SBI Magnum Constant Maturity Fund
SBI Magnum Gilt Fund
Nippon India Gilt Securities Fund
1. PGIM India Credit Risk Fund
PGIM India Credit Risk Fund
Growth Launch Date 29 Sep 14 NAV (21 Jan 22) ₹15.5876 ↑ 0.00 (0.01 %) Net Assets (Cr) ₹39 on 31 Dec 21 Category Debt - Credit Risk AMC Pramerica Asset Managers Private Limited Rating ☆☆☆☆☆ Risk Moderate Expense Ratio 1.85 Sharpe Ratio 1.73 Information Ratio 0 Alpha Ratio 0 Min Investment 5,000 Min SIP Investment 1,000 Exit Load 0-1 Years (1%),1 Years and above(NIL) Yield to Maturity 5.01% Effective Maturity 7 Months 2 Days Modified Duration 6 Months 14 Days Growth of 10,000 investment over the years.
Date Value 31 Mar 21 ₹10,000 Returns for PGIM India Credit Risk Fund
absolute basis & more than 1 year are on CAGR (Compound Annual Growth Rate) basis. as on 21 Jan 22 Duration Returns 1 Month 0.3% 3 Month 0.6% 6 Month 4.4% 1 Year 8.4% 3 Year 3% 5 Year 4.2% 10 Year 15 Year Since launch 6.3% Historical performance (Yearly) on absolute basis
Year Returns 2024 2023 2022 2021 2020 2019 2018 2017 2016 2015 Fund Manager information for PGIM India Credit Risk Fund
Name Since Tenure Data below for PGIM India Credit Risk Fund as on 31 Dec 21
Asset Allocation
Asset Class Value Debt Sector Allocation
Sector Value Credit Quality
Rating Value Top Securities Holdings / Portfolio
Name Holding Value Quantity 2. Axis Credit Risk Fund
Axis Credit Risk Fund
Growth Launch Date 15 Jul 14 NAV (15 Apr 26) ₹22.6681 ↑ 0.04 (0.19 %) Net Assets (Cr) ₹367 on 28 Feb 26 Category Debt - Credit Risk AMC Axis Asset Management Company Limited Rating ☆☆☆☆☆ Risk Moderate Expense Ratio 1.57 Sharpe Ratio 2.62 Information Ratio 0 Alpha Ratio 0 Min Investment 5,000 Min SIP Investment 1,000 Exit Load 0-12 Months (1%),12 Months and above(NIL) Yield to Maturity 8.35% Effective Maturity 4 Years 3 Months 25 Days Modified Duration 2 Years 11 Months 12 Days Growth of 10,000 investment over the years.
Date Value 31 Mar 21 ₹10,000 31 Mar 22 ₹10,570 31 Mar 23 ₹11,057 31 Mar 24 ₹11,864 31 Mar 25 ₹12,831 31 Mar 26 ₹13,806 Returns for Axis Credit Risk Fund
absolute basis & more than 1 year are on CAGR (Compound Annual Growth Rate) basis. as on 21 Jan 22 Duration Returns 1 Month 0.8% 3 Month 1.8% 6 Month 3.2% 1 Year 7.6% 3 Year 7.8% 5 Year 6.8% 10 Year 15 Year Since launch 7.2% Historical performance (Yearly) on absolute basis
Year Returns 2024 8.7% 2023 8% 2022 7% 2021 4% 2020 6% 2019 8.2% 2018 4.4% 2017 5.9% 2016 6.4% 2015 9.8% Fund Manager information for Axis Credit Risk Fund
Name Since Tenure Devang Shah 15 Jul 14 11.72 Yr. Akhil Thakker 9 Nov 21 4.39 Yr. Data below for Axis Credit Risk Fund as on 28 Feb 26
Asset Allocation
Asset Class Value Cash 2.95% Equity 7.28% Debt 89.25% Other 0.52% Debt Sector Allocation
Sector Value Corporate 79.59% Government 9.67% Cash Equivalent 2.95% Credit Quality
Rating Value A 16.51% AA 58.25% AAA 25.24% Top Securities Holdings / Portfolio
Name Holding Value Quantity Jubilant Bevco Limited
Debentures | -5% ₹16 Cr 1,500 Jtpm Metal TRaders Limited
Debentures | -4% ₹16 Cr 1,500 7.61% Gs 2030
Sovereign Bonds | -4% ₹15 Cr 1,500,000
↑ 1,500,000 Infopark Properties Limited
Debentures | -4% ₹15 Cr 1,500 Narayana Hrudayalaya Limited
Debentures | -4% ₹15 Cr 1,500 Aditya Birla Digital Fashion Ventures Limited
Debentures | -4% ₹15 Cr 1,500 Altius Telecom Infrastructure Trust
Debentures | -4% ₹15 Cr 1,500 7.24% Gs 2055
Sovereign Bonds | -4% ₹14 Cr 1,500,000 Vedanta Limited
Debentures | -3% ₹12 Cr 1,200 GMR Airports Limited
Debentures | -3% ₹10 Cr 1,000 3. Aditya Birla Sun Life Savings Fund
Aditya Birla Sun Life Savings Fund
Growth Launch Date 16 Apr 03 NAV (15 Apr 26) ₹575.846 ↑ 0.40 (0.07 %) Net Assets (Cr) ₹21,467 on 28 Feb 26 Category Debt - Ultrashort Bond AMC Birla Sun Life Asset Management Co Ltd Rating ☆☆☆☆☆ Risk Moderately Low Expense Ratio 0.55 Sharpe Ratio 2.39 Information Ratio 0 Alpha Ratio 0 Min Investment 1,000 Min SIP Investment 1,000 Exit Load NIL Yield to Maturity 7.14% Effective Maturity 6 Months 18 Days Modified Duration 5 Months 23 Days Growth of 10,000 investment over the years.
Date Value 31 Mar 21 ₹10,000 31 Mar 22 ₹10,417 31 Mar 23 ₹10,981 31 Mar 24 ₹11,796 31 Mar 25 ₹12,712 31 Mar 26 ₹13,570 Returns for Aditya Birla Sun Life Savings Fund
absolute basis & more than 1 year are on CAGR (Compound Annual Growth Rate) basis. as on 21 Jan 22 Duration Returns 1 Month 0.7% 3 Month 1.6% 6 Month 3% 1 Year 6.7% 3 Year 7.3% 5 Year 6.3% 10 Year 15 Year Since launch 7.4% Historical performance (Yearly) on absolute basis
Year Returns 2024 7.4% 2023 7.9% 2022 7.2% 2021 4.8% 2020 3.9% 2019 7% 2018 8.5% 2017 7.6% 2016 7.2% 2015 9.2% Fund Manager information for Aditya Birla Sun Life Savings Fund
Name Since Tenure Sunaina Cunha 20 Jun 14 11.79 Yr. Kaustubh Gupta 15 Jul 11 14.72 Yr. Monika Gandhi 22 Mar 21 5.03 Yr. Data below for Aditya Birla Sun Life Savings Fund as on 28 Feb 26
Asset Allocation
Asset Class Value Cash 26.78% Debt 72.88% Other 0.34% Debt Sector Allocation
Sector Value Corporate 68% Government 16.89% Cash Equivalent 14.77% Credit Quality
Rating Value AA 30.53% AAA 69.47% Top Securities Holdings / Portfolio
Name Holding Value Quantity National Bank for Agriculture and Rural Development
Domestic Bonds | -4% ₹748 Cr 16,000
↑ 16,000 Indusind Bank Ltd.
Debentures | -4% ₹712 Cr 15,000 Punjab National Bank
Domestic Bonds | -3% ₹654 Cr 14,000
↑ 14,000 Shriram Finance Limited
Debentures | -3% ₹607 Cr 60,000 National Bank For Agriculture And Rural Development
Debentures | -3% ₹489 Cr 49,000
↓ -5,000 Bharti Telecom Limited
Debentures | -2% ₹396 Cr 40,000 Muthoot Finance Limited
Debentures | -2% ₹350 Cr 35,000 Mankind Pharma Limited
Debentures | -2% ₹321 Cr 32,000 Avanse Financial Services Limited
Debentures | -2% ₹300 Cr 30,000 Power Finance Corporation Limited
Debentures | -2% ₹295 Cr 30,000 4. Aditya Birla Sun Life Money Manager Fund
Aditya Birla Sun Life Money Manager Fund
Growth Launch Date 13 Oct 05 NAV (15 Apr 26) ₹388.997 ↑ 0.26 (0.07 %) Net Assets (Cr) ₹30,778 on 28 Feb 26 Category Debt - Money Market AMC Birla Sun Life Asset Management Co Ltd Rating ☆☆☆☆☆ Risk Low Expense Ratio 0.35 Sharpe Ratio 2.09 Information Ratio 0 Alpha Ratio 0 Min Investment 1,000 Min SIP Investment 1,000 Exit Load NIL Yield to Maturity 7.02% Effective Maturity 7 Months 20 Days Modified Duration 7 Months 17 Days Growth of 10,000 investment over the years.
Date Value 31 Mar 21 ₹10,000 31 Mar 22 ₹10,397 31 Mar 23 ₹10,985 31 Mar 24 ₹11,825 31 Mar 25 ₹12,741 31 Mar 26 ₹13,571 Returns for Aditya Birla Sun Life Money Manager Fund
absolute basis & more than 1 year are on CAGR (Compound Annual Growth Rate) basis. as on 21 Jan 22 Duration Returns 1 Month 0.9% 3 Month 1.7% 6 Month 3% 1 Year 6.6% 3 Year 7.4% 5 Year 6.4% 10 Year 15 Year Since launch 6.8% Historical performance (Yearly) on absolute basis
Year Returns 2024 7.4% 2023 7.8% 2022 7.4% 2021 4.8% 2020 3.8% 2019 6.6% 2018 8% 2017 7.9% 2016 6.8% 2015 7.7% Fund Manager information for Aditya Birla Sun Life Money Manager Fund
Name Since Tenure Kaustubh Gupta 15 Jul 11 14.72 Yr. Anuj Jain 22 Mar 21 5.03 Yr. Mohit Sharma 1 Apr 17 9.01 Yr. Data below for Aditya Birla Sun Life Money Manager Fund as on 28 Feb 26
Asset Allocation
Asset Class Value Cash 69.55% Debt 30.17% Other 0.28% Debt Sector Allocation
Sector Value Corporate 50.31% Cash Equivalent 37.79% Government 11.63% Credit Quality
Rating Value AAA 100% Top Securities Holdings / Portfolio
Name Holding Value Quantity Indusind Bank Ltd.
Debentures | -5% ₹1,410 Cr 30,000 Axis Bank Ltd.
Debentures | -3% ₹951 Cr 20,000 Federal Bank Ltd.
Debentures | -3% ₹939 Cr 20,000 5.63% Govt Stock 2026
Sovereign Bonds | -2% ₹470 Cr 47,000,000 Karur Vysya Bank Ltd.
Debentures | -2% ₹468 Cr 10,000 02/10/2026 Maturing 364 DTB
Sovereign Bonds | -1% ₹389 Cr 40,000,000 Kotak Mahindra Bank Ltd.
Debentures | -1% ₹388 Cr 8,000 7.49% Gujarat Sgs 2026
Sovereign Bonds | -1% ₹327 Cr 32,500,000 HDFC Bank Ltd.
Debentures | -1% ₹258 Cr 5,500
↑ 5,500 Gujarat State Development Loans
Sovereign Bonds | -1% ₹252 Cr 25,000,000 5. PGIM India Low Duration Fund
PGIM India Low Duration Fund
Growth Launch Date 22 Jun 07 NAV (29 Sep 23) ₹26.0337 ↑ 0.01 (0.06 %) Net Assets (Cr) ₹104 on 31 Aug 23 Category Debt - Low Duration AMC Pramerica Asset Managers Private Limited Rating ☆☆☆☆☆ Risk Moderate Expense Ratio 1.18 Sharpe Ratio -1.66 Information Ratio 0 Alpha Ratio 0 Min Investment 5,000 Min SIP Investment 1,000 Exit Load NIL Yield to Maturity 7.34% Effective Maturity 7 Months 17 Days Modified Duration 6 Months 11 Days Growth of 10,000 investment over the years.
Date Value 31 Mar 21 ₹10,000 31 Mar 22 ₹10,327 31 Mar 23 ₹10,814 Returns for PGIM India Low Duration Fund
absolute basis & more than 1 year are on CAGR (Compound Annual Growth Rate) basis. as on 21 Jan 22 Duration Returns 1 Month 0.5% 3 Month 1.5% 6 Month 3.3% 1 Year 6.3% 3 Year 4.5% 5 Year 1.3% 10 Year 15 Year Since launch 6.1% Historical performance (Yearly) on absolute basis
Year Returns 2024 2023 2022 2021 2020 2019 2018 2017 2016 2015 Fund Manager information for PGIM India Low Duration Fund
Name Since Tenure Data below for PGIM India Low Duration Fund as on 31 Aug 23
Asset Allocation
Asset Class Value Debt Sector Allocation
Sector Value Credit Quality
Rating Value Top Securities Holdings / Portfolio
Name Holding Value Quantity
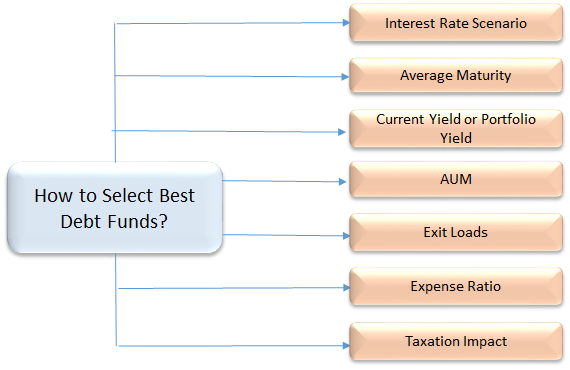
How to Evaluate Best Debt Mutual Funds
In order to select the best debt funds you wish to invest in, it is necessary to consider some of the important parameters such as average maturity, credit quality, AUM, expense ratio, tax implication., etc. Let's have an in-depth look-
1. Average Maturity/Duration
Average maturity is an essential parameter in debt funds that is sometimes overlooked by investors, who tend to invest for a long period without considering the risks involved. Investors need to decide their debt fund investment based on its maturity period, Matching the time period of investment with the maturity period of the debt fund is a good way to ensure you don't end up taking unnecessary risk. Thus, it is advisable to know the average maturity of a debt fund, before investing, in order to aim for optimum risk returns in debt funds. Looking at the average maturity (duration is a similar factor) is important, for example, a liquid fund may have an average maturity of a couple of days to maybe a month, this would mean it is a great option for an investor who is looking to invest money for a couple of days. Similarly, if you are looking at the time frame of one-year Investment plan then, a short-term debt fund can be ideal.
2. Interest Rate Scenario
Understanding the market environment is very important in debt funds which are affected by interest rates and its fluctuations. When the interest rate rises in the economy, the bond price falls and vice-versa. Also, during the time when the interest rates rise, new bonds are issued in the market with a higher yield than the older bonds, making those older bonds of lower value. Therefore, investors are more attracted towards newer bonds in the market and also a re-pricing of older bonds takes place. In case a debt fund is having an exposure to such "older bonds" then when the interest rates rise, the NAV of the debt fund would be impacted negatively. Furthermore, as debt funds are exposed to interest rate fluctuations, it disturbs the prices of the underlying bonds in the fund portfolio. For instance, long-term debt funds are at a higher risk during times of rising interest rates. During this time making a short-term investment plan will lower your interest rate risks.
If one has good knowledge of interest rates and can monitor the same, one can even take advantage of this. In a falling interest rate market, long-term debt funds would be a good choice. However, during the times of rising interest rates then it would be wise to be in funds with shorter average maturities like short-term funds, Ultra Short Term fund or even liquid funds.
3. Current Yield or Portfolio Yield
The yield is a measure of the interest income generated by the bonds in the portfolio. Funds that invest in debt or bonds that have a higher coupon rate (or yield) would have a higher overall portfolio yield. The yield to maturity(YTM) of a debt mutual fund indicates the running yield of the fund. When comparing debt funds on the basis of YTM, one should also look at that fact that how is the extra yield being generated. Is this at the cost of as lower portfolio quality? Investing in not so good quality instruments has its own issues. You don't want to end up investing in a debt fund which has such bonds or securities that may default later on. So, always look at the portfolio yield and balance it off with the credit quality.
4. Credit Quality of Portfolio
In order to invest in best debt funds, checking the credit quality of the bonds and debt securities is an essential parameter. Bonds are assigned a credit rating by various agencies based on their ability to pay the money back. A bond with AAA rating is considered to be the best credit rating and also implies a safe and secure investment. If one truly wants safety and considers this as the paramount parameter in selecting the best debt fund, then getting into a fund with very high-quality debt instruments (AAA or AA+) may be the desired option.
5. Assets Under Management (AUM)
This is the foremost parameter to consider while choosing the best debt funds. AUM is the total amount invested in a particular scheme by all investors. Since, most Mutual Funds’ total AUM is invested in debt funds, investors need to select scheme assets that have a considerable AUM. Being in a fund which has a large exposure to corporates may be risky, since their withdrawals may be large which may affect the overall fund performance.
6. Expense Ratio
An important factor to be considered in debt funds is its expense ratio. A higher expense ratio creates a larger impact on the funds’ performance. For example, liquid funds have the lowest expense ratios which are up to 50 bps (BPS is a unit to measure interest rates wherein one bps is equal to 1/100th of 1%) whereas, other debt funds could charge up to 150 bps. So to make a choice between one debt mutual fund, it is important to consider the management fee or the fund running expense.
7. Taxation Impacts
Debt funds offer the benefit of long-term capital gains (more than 3 years) with indexation benefits. And the short term capital gains (less than 3 years) is taxed at 30%.
Things to consider as an investor
1. Fund Objectives
Debt Fund aims to earn optimal returns by maintaining a diversified portfolio of various types of securities. You can expect them to perform in a predictable manner. It is because of this reason, that debt funds are popular among conservative investors.
2. Fund Types
Debt funds are further divided into various categories like liquid funds, Monthly Income Plan (MIP), fixed maturity plans (FMP), dynamic bond funds, income funds, credit opportunities funds, GILT funds, short-term funds and ultra short-term funds.
3. Risks
Debt funds are basically exposed to interest rate risk, credit risk, and liquidity risk. The fund value may fluctuate due to the overall interest rate movements. There’s a risk of default in the payment of interest and principal by the issuer. Liquidity risk happens when the fund manager is unable to sell the underlying security due to lack of demand.
4. Cost
Debt funds charge an expense ratio to manage your money. Till now SEBI had mandated the upper limit of expense ratio to be 2.25% (Might change time to time with regulations.).
5. Investment Horizon
An investment of 3 months to 1 year would be ideal for liquid funds. If you have a longer horizon of say 2 to 3 years, you may go for short-term bond funds.
6. Financial Goals
Debt funds can be used to achieve a variety of goals like earning additional income or for purpose of liquidity.
How to Invest in Best Debt Funds Online?
Open Free Investment Account for Lifetime at Fincash.com.
Complete your Registration and KYC Process
Upload Documents (PAN, Aadhaar, etc.). And, You are Ready to Invest!
Conclusion
Debt funds are one of the best ways to invest your money and generate income on a regular basis by choosing the relevant product matching your risk profile. So, investors looking to generate steady income or take advantage of the debt markets, can consider the above best debt funds for 2026 - 2027 and start investing!_
All efforts have been made to ensure the information provided here is accurate. However, no guarantees are made regarding correctness of data. Please verify with scheme information document before making any investment.
You Might Also Like


AMFI Registration No. 112358 | CIN: U74999MH2016PTC282153
Shepard Technologies Pvt. Ltd. (with ARN code 112358) makes no warranties or representations, express or implied, on products offered through the platform. It accepts no liability for any damages or losses, however caused, in connection with the use of, or on the reliance of its product or related services. Terms and conditions of the website are applicable.
©2026 Shepard Technologies Private Limited. All Rights Reserved
The article is nice and informative but it could be in more simple words because lot of people have much less knowledge in such sector