Table of Contents
What is the On-the-run Treasury Yield Curve?
The On-the-run Treasury Yield Curve is drafted based on the yields generated from on-the-run securities issued by the US treasury. The latest or most recent batch of the securities issued by the US Treasury to finance the government expenses is known as an on-the-run treasury. These types of securities come with a specific maturity period. When it reaches maturity, the treasuries convert into off-the-run securities which have considerably low liquidity than their on-the-run treasury counterparts. This Yield Curve is used to draw the treasury Bonds alongside the maturity period.

The yield curve is used to set the prices for the fixed-Income treasuries. While the curve can help set the price for the securities, its result might get a bit unclear if the on-the-run treasury is declared on special. That means the price of this treasure rises gradually because of the high demand for on-the-run security. This mainly happens when a large number of investors show interest in buying on-the-run securities for the arbitrage strategy.
When the prices of on-the-run securities increase due to the high demand for these types of securities, then the yield curve becomes inaccurate. Basically, there are quite a few reasons that make the connection between yield and maturity a little complex. For example, on-the-run and off-the-run securities are associated with different risks. Besides, the interest rate of both securities differs. The curve for on-the-run security moves upwards.
Understanding the Yield Curve
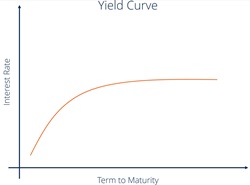
The slope of the curve is mainly influenced by Market demand and supply factors. The normal shape of this curve is an upward slope since the yield is expected to be higher when the securities are nearing maturity. When the interest rates for the short-term maturities are high, the on-the-run treasury takes the negative curve. At times, the inverse slop in the on-the-run Treasury yield curve is because of the strict central Bank policies.
Talk to our investment specialist
When the central bank increases the interest rate, the yield curve of the on-the-run treasury goes downwards. It is important to note that this negative yield will last for only a short while. The curve goes back to its normal position (either Flat or positive) in a short amount of time. The curve can move upwards or downwards depending on a few crucial factors, such as the interest rates set forth by the central bank, current market demand and supply of the on-the-run securities, and other economical factors.
In simple terms, the on-the-run yield curve is the graphical representation of the yield and maturity of the latest batch of the treasuries issued by the US Treasury. This can be the bonds and notes that are issued in order to finance an expansion project or certain expenses. Let’s understand it with an example. Suppose the Treasury issues the bonds that have a maturity period of 5 years. A few months later, they issue another set of treasury notes with a 10-year maturity period. Here, the bonds issued earlier will go off-the-run, while the new batch will be called on-the-run treasuries. The yield curve is made for the latest batch of the bonds.
All efforts have been made to ensure the information provided here is accurate. However, no guarantees are made regarding correctness of data. Please verify with scheme information document before making any investment.


