 +91-22-48913909
Table of Contents
निवेश करके 1 करोड़ कैसे प्राप्त करें
मासिक म्यूचुअल फंड एसआईपी के माध्यम से निवेश
निवेश एक इक्विटी म्यूचुअल फंड योजना में an . के माध्यम सेसिप अपने दीर्घकालिक लक्ष्यों को प्राप्त करने का सबसे अच्छा तरीका है। इक्विटी में अन्य परिसंपत्ति वर्गों की तुलना में बेहतर रिटर्न देने की क्षमता है। यह आपको हराने में भी मदद कर सकता हैमुद्रास्फीति जो दीर्घकालिक लक्ष्यों को प्राप्त करने के लिए आवश्यक है। वे अनुकूल कराधान का भी आनंद लेते हैं। अब, लंबी अवधिराजधानी एक वर्ष में किए गए निवेश पर लाभ कर कर-मुक्त था (वित्त वर्ष 18-19 के केंद्रीय बजट से 1 फरवरी से 1 लाख वर्ष से अधिक के लाभ पर @ 10% का कर लगाया जाएगा, अर्थात यदि किसी व्यक्ति को लंबी अवधि में एक वित्तीय वर्ष में 1.1 लाख का लाभ होता है)पूंजीगत लाभ उसे 1,10 पर टैक्स देना होगा,000 - 1,00,000 = 10,000। 10,000 पर 10% = 1,000 इंचकरों)
Talk to our investment specialist
कैसे पाएं 1 करोड़
विभिन्न समय-सीमाओं में 1 करोड़ कैसे प्राप्त करें, इसके उदाहरण नीचे दिए गए हैंएसआईपी में निवेश (व्यवस्थितनिवेश योजना) कासर्वश्रेष्ठ म्युचुअल फंड.
1. 20 साल में 1 करोड़ कैसे पाएं
रुपये के म्यूचुअल फंड एसआईपी के माध्यम से निवेश शुरू करें। 7,600 प्रति माह
अगर आप हर महीने 7,600 रुपये बचा सकते हैं, तो तुरंत एसआईपी शुरू करेंइक्विटी म्यूचुअल फंड. यदि आपको योजनाओं के चयन में सहायता की आवश्यकता है, तो आप हमारे अनुशंसित इक्विटी म्यूचुअल फंड पोर्टफोलियो की जांच कर सकते हैं और अपने आधार पर एक पोर्टफोलियो चुन सकते हैंजोखिम उठाने का माद्दा और एसआईपी राशि। यदि आपका पोर्टफोलियोम्यूचुअल फंड्स 14 प्रतिशत का वार्षिक रिटर्न देने का प्रबंधन करता है (जो कि से कम है)सीएजीआर सेंसेक्स द्वारा 1979 में स्थापना के बाद से पेश किया गया), आप 20 वर्षों में 1 करोड़ रुपये का एक कोष बनाने में सक्षम होंगे जैसा कि नीचे दिखाया गया है।
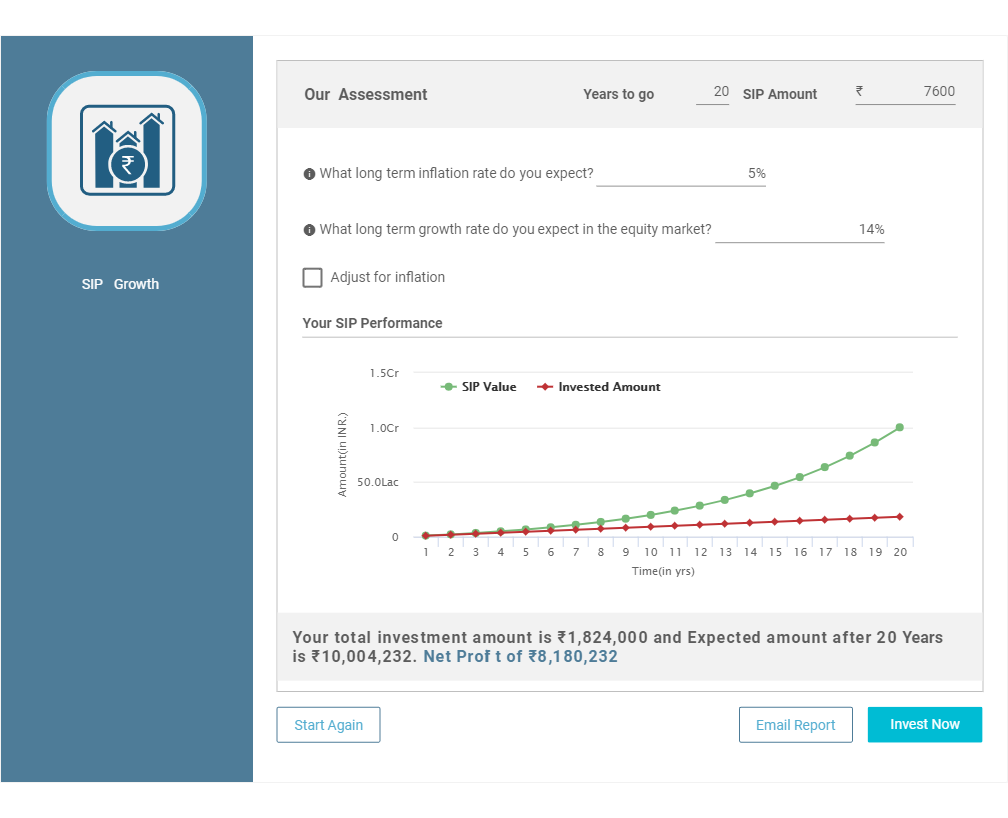
ऐतिहासिक रिटर्न के आधार पर मुख्य अनुमान नीचे दिए गए हैं:
| मान्यताओं | आंकड़े |
|---|---|
| विकास दर | 14% |
| मुद्रास्फीति | फैक्टर नहीं |
| निवेश राशि (दोपहर) | 7,600 |
| समय सीमा | 20 साल |
| निवेश की गई राशि | 18,24,000 |
| कुल कोष | 1,00,04,232 |
| शुद्ध लाभ | 81,80,232 |
अधिक विवरण हमारे द्वारा हमारे द्वारा काम किया जा सकता हैघूंट कैलकुलेटर नीचे दिए गए बटन पर क्लिक करके
2. 15 साल में 1 करोड़ कैसे पाएं
रुपये के म्यूचुअल फंड एसआईपी के माध्यम से निवेश शुरू करें। 16,320 प्रति माह
अगर आप हर महीने 16,320 रुपये बचा सकते हैं, तो इक्विटी म्यूचुअल फंड में तुरंत एसआईपी शुरू करें। यदि आपको योजनाओं के चयन में सहायता की आवश्यकता है, तो आप हमारे अनुशंसित इक्विटी म्यूचुअल फंड पोर्टफोलियो की जांच कर सकते हैं और अपनी जोखिम लेने की क्षमता और एसआईपी राशि के आधार पर एक पोर्टफोलियो चुन सकते हैं। यदि आपका म्यूचुअल फंड का पोर्टफोलियो 14 प्रतिशत का वार्षिक रिटर्न देने का प्रबंधन करता है (जो 1979 में स्थापना के बाद से सेंसेक्स द्वारा पेश किए गए सीएजीआर से कम है), तो आप नीचे दिखाए गए अनुसार 15 वर्षों में 1 करोड़ रुपये का कोष बना पाएंगे।
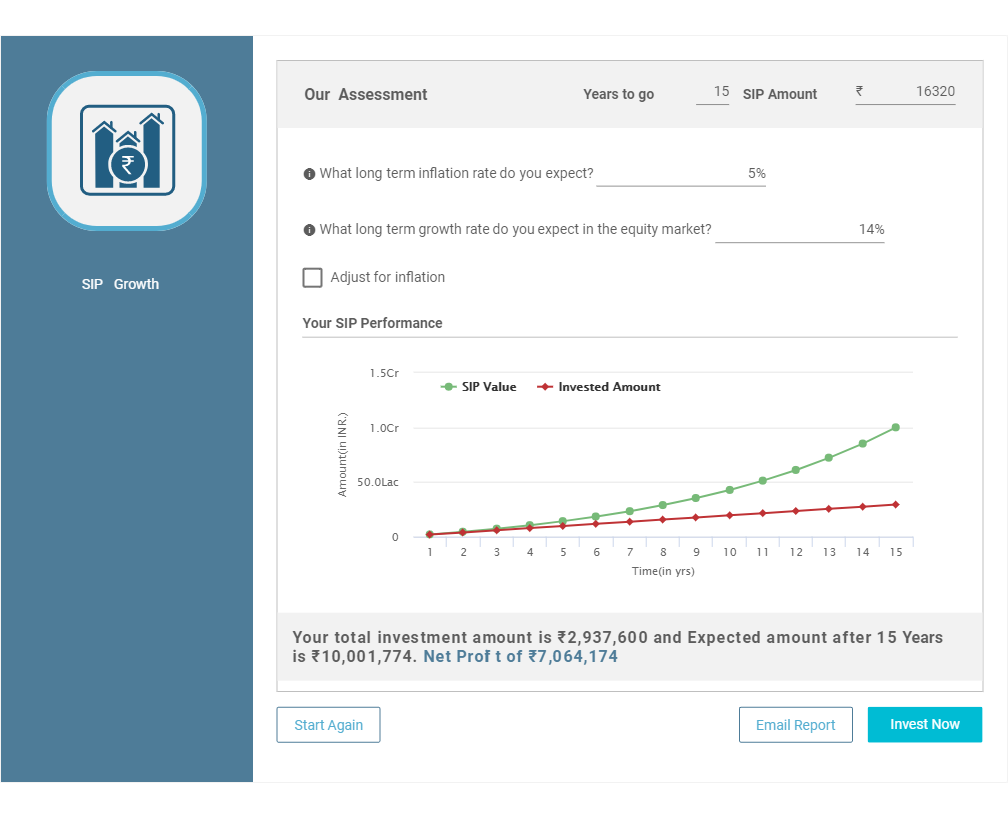
ऐतिहासिक रिटर्न के आधार पर मुख्य अनुमान नीचे दिए गए हैं:
| मान्यताओं | आंकड़े |
|---|---|
| विकास दर | 14% |
| मुद्रास्फीति | फैक्टर नहीं |
| निवेश राशि (दोपहर) | 16,320 |
| समय सीमा | पन्द्रह साल |
| निवेश की गई राशि | 29,37,600 |
| कुल कोष | 1,00,01,774 |
| शुद्ध लाभ | 70,64,174 |
नीचे दिए गए बटन पर क्लिक करके हमारे एसआईपी कैलकुलेटर का उपयोग करके अधिक विवरण पर काम किया जा सकता है
3. 10 साल में 1 करोड़ कैसे पाएं
रुपये के म्यूचुअल फंड एसआईपी के माध्यम से निवेश शुरू करें। 38,160 प्रति माह
अगर आप हर महीने 38,160 रुपये बचा सकते हैं, तो इक्विटी म्यूचुअल फंड में तुरंत एसआईपी शुरू करें। यदि आपको योजनाओं के चयन में सहायता की आवश्यकता है, तो आप हमारे अनुशंसित इक्विटी म्यूचुअल फंड पोर्टफोलियो की जांच कर सकते हैं और अपनी जोखिम लेने की क्षमता और एसआईपी राशि के आधार पर एक पोर्टफोलियो चुन सकते हैं। यदि आपका म्यूचुअल फंड का पोर्टफोलियो 14 प्रतिशत का वार्षिक रिटर्न देने का प्रबंधन करता है (जो कि 1979 में स्थापना के बाद से सेंसेक्स द्वारा पेश किए गए सीएजीआर से कम है), तो आप नीचे दिखाए गए अनुसार 10 वर्षों में 1 करोड़ रुपये का एक कोष बनाने में सक्षम होंगे।
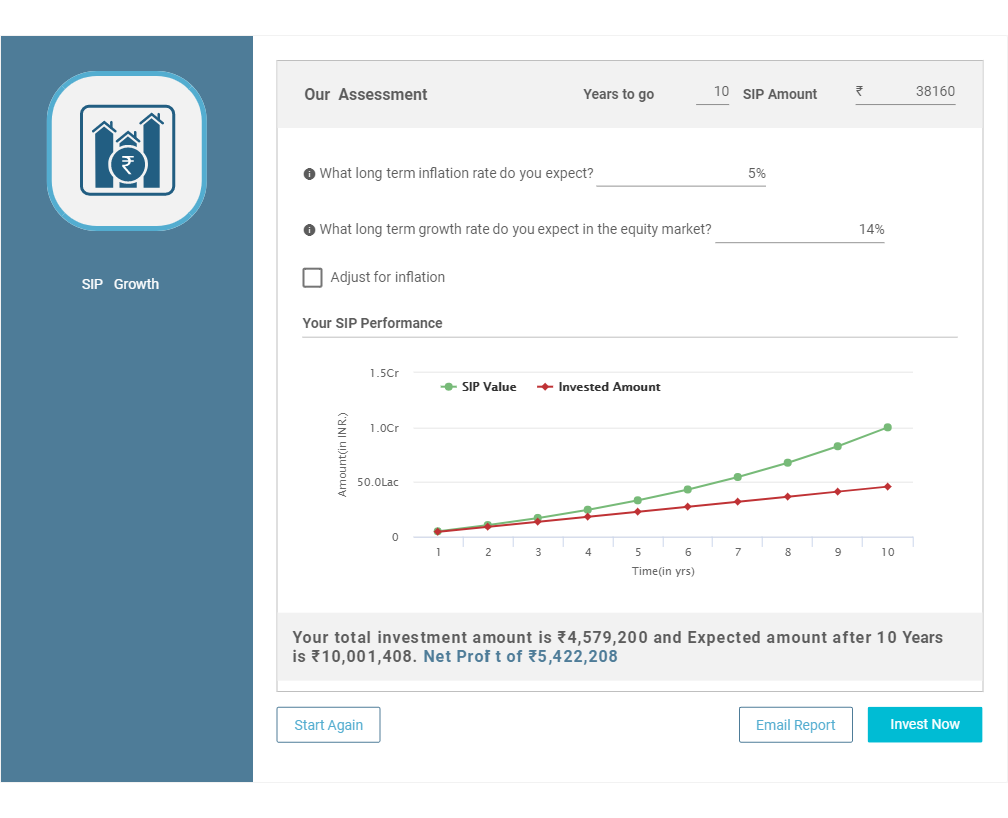
ऐतिहासिक रिटर्न के आधार पर मुख्य अनुमान नीचे दिए गए हैं:
| मान्यताओं | आंकड़े |
|---|---|
| विकास दर | 14% |
| मुद्रास्फीति | फैक्टर नहीं |
| निवेश राशि (दोपहर) | 38,160 |
| समय सीमा | 10 वर्ष |
| निवेश की गई राशि | 45,79,200 |
| कुल कोष | 1,00,01,408 |
| शुद्ध लाभ | 54,22,208 |
| नीचे दिए गए बटन पर क्लिक करके हमारे एसआईपी कैलकुलेटर का उपयोग करके अधिक विवरण पर काम किया जा सकता है |
शीर्ष 10 सर्वश्रेष्ठ प्रदर्शन करने वाले एसआईपी म्युचुअल फंड
नीचे नेट एसेट/एयूएम वाले सर्वश्रेष्ठ म्यूचुअल फंडों की सूची दी गई है500 करोड़ और क्रमबद्ध किया गया5 साल का सीएजीआर रिटर्न. जिसे दिए गए उद्देश्य को प्राप्त करने के लिए निवेशित देखा जा सकता है।
To generate capital appreciation and income distribution to unit holders by investing predominantly in equity/equity related securities of the companies belonging to the infrastructure development and balance in debt securities and money market instruments. ICICI Prudential Infrastructure Fund is a Equity - Sectoral fund was launched on 31 Aug 05. It is a fund with High risk and has given a Below is the key information for ICICI Prudential Infrastructure Fund Returns up to 1 year are on The primary investment objective of the scheme is to generate long term capital appreciation by investing predominantly in equity and equity related instruments of small cap companies and the secondary objective is to generate consistent returns by investing in debt and money market securities. Nippon India Small Cap Fund is a Equity - Small Cap fund was launched on 16 Sep 10. It is a fund with Moderately High risk and has given a Below is the key information for Nippon India Small Cap Fund Returns up to 1 year are on The investment objective of the scheme is to seek to generate long-term capital growth through an active diversified portfolio of predominantly equity and equity related instruments of companies that are participating in and benefiting from growth in Indian infrastructure and infrastructural related activities. However, there can be no assurance that the investment objective of the scheme will be realized. IDFC Infrastructure Fund is a Equity - Sectoral fund was launched on 8 Mar 11. It is a fund with High risk and has given a Below is the key information for IDFC Infrastructure Fund Returns up to 1 year are on (Erstwhile Reliance Diversified Power Sector Fund) The primary investment objective of the scheme is to generate long term capital appreciation by investing predominantly in equity and equity related securities of companies in the power sector. Nippon India Power and Infra Fund is a Equity - Sectoral fund was launched on 8 May 04. It is a fund with High risk and has given a Below is the key information for Nippon India Power and Infra Fund Returns up to 1 year are on To seek long-term capital appreciation by investing predominantly in equity and equity related securities of companies engaged in or expected to benefit from growth and development of infrastructure. HDFC Infrastructure Fund is a Equity - Sectoral fund was launched on 10 Mar 08. It is a fund with High risk and has given a Below is the key information for HDFC Infrastructure Fund Returns up to 1 year are on To provide the investors maximum growth opportunity through equity
investments in stocks of growth oriented sectors of the economy. SBI Contra Fund is a Equity - Contra fund was launched on 6 May 05. It is a fund with Moderately High risk and has given a Below is the key information for SBI Contra Fund Returns up to 1 year are on (Erstwhile Motilal Oswal MOSt Focused Midcap 30 Fund) The investment objective of the Scheme is to achieve long term capital appreciation by investing in a maximum of 30 quality mid-cap companies having long-term competitive advantages and potential for growth. However, there can be no assurance or guarantee that the investment objective of the Scheme would be achieved. Motilal Oswal Midcap 30 Fund is a Equity - Mid Cap fund was launched on 24 Feb 14. It is a fund with Moderately High risk and has given a Below is the key information for Motilal Oswal Midcap 30 Fund Returns up to 1 year are on To generate capital appreciation, from a portfolio that is substantially constituted of equity securities and equity related securities of corporates, which could benefit from structural changes brought about by continuing liberalization in economic policies by the government and/or continuing investments in infrastructure, both by the public and private sector. DSP BlackRock India T.I.G.E.R Fund is a Equity - Sectoral fund was launched on 11 Jun 04. It is a fund with High risk and has given a Below is the key information for DSP BlackRock India T.I.G.E.R Fund Returns up to 1 year are on To generate long-term capital appreciation from a diversified portfolio of predominantly equity and equity related securities, including equity derivatives, in the Indian markets with key theme focus being emerging companies (small cap stocks). The Scheme could also additionally invest in Foreign Securities. L&T Emerging Businesses Fund is a Equity - Small Cap fund was launched on 12 May 14. It is a fund with High risk and has given a Below is the key information for L&T Emerging Businesses Fund Returns up to 1 year are on To provide long-term capital appreciation by investing predominantly in Small-Cap and Mid-Cap companies. HDFC Small Cap Fund is a Equity - Small Cap fund was launched on 3 Apr 08. It is a fund with Moderately High risk and has given a Below is the key information for HDFC Small Cap Fund Returns up to 1 year are on 1. ICICI Prudential Infrastructure Fund
CAGR/Annualized return of 15.5% since its launch. Ranked 27 in Sectoral category. Return for 2024 was 27.4% , 2023 was 44.6% and 2022 was 28.8% . ICICI Prudential Infrastructure Fund
Growth Launch Date 31 Aug 05 NAV (09 Apr 25) ₹170.02 ↓ -0.51 (-0.30 %) Net Assets (Cr) ₹6,886 on 28 Feb 25 Category Equity - Sectoral AMC ICICI Prudential Asset Management Company Limited Rating ☆☆☆ Risk High Expense Ratio 2.22 Sharpe Ratio -0.25 Information Ratio 0 Alpha Ratio 0 Min Investment 5,000 Min SIP Investment 100 Exit Load 0-1 Years (1%),1 Years and above(NIL) Growth of 10,000 investment over the years.
Date Value 31 Mar 20 ₹10,000 31 Mar 21 ₹18,670 31 Mar 22 ₹25,304 31 Mar 23 ₹30,899 31 Mar 24 ₹50,465 31 Mar 25 ₹54,540 Returns for ICICI Prudential Infrastructure Fund
absolute basis & more than 1 year are on CAGR (Compound Annual Growth Rate) basis. as on 9 Apr 25 Duration Returns 1 Month -0.3% 3 Month -6.6% 6 Month -13% 1 Year -0.7% 3 Year 24.8% 5 Year 37.5% 10 Year 15 Year Since launch 15.5% Historical performance (Yearly) on absolute basis
Year Returns 2023 27.4% 2022 44.6% 2021 28.8% 2020 50.1% 2019 3.6% 2018 2.6% 2017 -14% 2016 40.8% 2015 2% 2014 -3.4% Fund Manager information for ICICI Prudential Infrastructure Fund
Name Since Tenure Ihab Dalwai 3 Jun 17 7.75 Yr. Sharmila D’mello 30 Jun 22 2.67 Yr. Data below for ICICI Prudential Infrastructure Fund as on 28 Feb 25
Equity Sector Allocation
Sector Value Industrials 36.49% Basic Materials 21.39% Financial Services 16.91% Utility 8.65% Energy 7.09% Communication Services 1.63% Consumer Cyclical 0.89% Real Estate 0.35% Asset Allocation
Asset Class Value Cash 5.98% Equity 93.39% Debt 0.62% Top Securities Holdings / Portfolio
Name Holding Value Quantity Larsen & Toubro Ltd (Industrials)
Equity, Since 30 Nov 09 | LT9% ₹649 Cr 2,052,790
↑ 126,940 Adani Ports & Special Economic Zone Ltd (Industrials)
Equity, Since 31 May 24 | ADANIPORTS4% ₹288 Cr 2,695,324 Shree Cement Ltd (Basic Materials)
Equity, Since 30 Apr 24 | 5003874% ₹268 Cr 98,408
↓ -10,339 ICICI Bank Ltd (Financial Services)
Equity, Since 31 Dec 16 | ICICIBANK3% ₹240 Cr 1,990,000 NTPC Ltd (Utilities)
Equity, Since 29 Feb 16 | 5325553% ₹226 Cr 7,260,775 HDFC Bank Ltd (Financial Services)
Equity, Since 31 Jan 22 | HDFCBANK3% ₹212 Cr 1,225,000 NCC Ltd (Industrials)
Equity, Since 31 Aug 21 | NCC3% ₹210 Cr 12,006,117
↑ 1,500,000 Reliance Industries Ltd (Energy)
Equity, Since 31 Jul 23 | RELIANCE3% ₹205 Cr 1,709,486
↑ 100,000 Vedanta Ltd (Basic Materials)
Equity, Since 31 Jul 24 | 5002953% ₹194 Cr 4,923,662
↑ 100,000 Cummins India Ltd (Industrials)
Equity, Since 31 May 17 | 5004803% ₹173 Cr 635,000 2. Nippon India Small Cap Fund
CAGR/Annualized return of 20.1% since its launch. Ranked 6 in Small Cap category. Return for 2024 was 26.1% , 2023 was 48.9% and 2022 was 6.5% . Nippon India Small Cap Fund
Growth Launch Date 16 Sep 10 NAV (09 Apr 25) ₹144.625 ↓ -1.21 (-0.83 %) Net Assets (Cr) ₹50,826 on 28 Feb 25 Category Equity - Small Cap AMC Nippon Life Asset Management Ltd. Rating ☆☆☆☆ Risk Moderately High Expense Ratio 1.55 Sharpe Ratio -0.31 Information Ratio 0.66 Alpha Ratio 3.26 Min Investment 5,000 Min SIP Investment 100 Exit Load 0-1 Years (1%),1 Years and above(NIL) Growth of 10,000 investment over the years.
Date Value 31 Mar 20 ₹10,000 31 Mar 21 ₹21,742 31 Mar 22 ₹31,334 31 Mar 23 ₹33,418 31 Mar 24 ₹51,907 31 Mar 25 ₹55,076 Returns for Nippon India Small Cap Fund
absolute basis & more than 1 year are on CAGR (Compound Annual Growth Rate) basis. as on 9 Apr 25 Duration Returns 1 Month -1.2% 3 Month -15% 6 Month -19.5% 1 Year -1.6% 3 Year 17.4% 5 Year 37.4% 10 Year 15 Year Since launch 20.1% Historical performance (Yearly) on absolute basis
Year Returns 2023 26.1% 2022 48.9% 2021 6.5% 2020 74.3% 2019 29.2% 2018 -2.5% 2017 -16.7% 2016 63% 2015 5.6% 2014 15.1% Fund Manager information for Nippon India Small Cap Fund
Name Since Tenure Samir Rachh 2 Jan 17 8.16 Yr. Kinjal Desai 25 May 18 6.77 Yr. Data below for Nippon India Small Cap Fund as on 28 Feb 25
Equity Sector Allocation
Sector Value Industrials 22.17% Consumer Cyclical 13.91% Financial Services 13.54% Basic Materials 12.14% Consumer Defensive 8.89% Technology 8.65% Health Care 8.16% Energy 2.03% Utility 1.98% Communication Services 1.54% Real Estate 0.54% Asset Allocation
Asset Class Value Cash 6.04% Equity 93.96% Top Securities Holdings / Portfolio
Name Holding Value Quantity HDFC Bank Ltd (Financial Services)
Equity, Since 30 Apr 22 | HDFCBANK2% ₹1,152 Cr 6,650,000 Multi Commodity Exchange of India Ltd (Financial Services)
Equity, Since 28 Feb 21 | MCX2% ₹924 Cr 1,851,010 Kirloskar Brothers Ltd (Industrials)
Equity, Since 31 Oct 12 | KIRLOSBROS1% ₹714 Cr 4,472,130 Dixon Technologies (India) Ltd (Technology)
Equity, Since 30 Nov 18 | DIXON1% ₹655 Cr 470,144 Karur Vysya Bank Ltd (Financial Services)
Equity, Since 28 Feb 17 | 5900031% ₹639 Cr 31,784,062 State Bank of India (Financial Services)
Equity, Since 31 Oct 19 | SBIN1% ₹627 Cr 9,100,000 Tube Investments of India Ltd Ordinary Shares (Industrials)
Equity, Since 30 Apr 18 | TIINDIA1% ₹615 Cr 2,499,222 NLC India Ltd (Utilities)
Equity, Since 31 Oct 22 | NLCINDIA1% ₹563 Cr 27,190,940 Adani Wilmar Ltd (Consumer Defensive)
Equity, Since 31 Jan 25 | 5434581% ₹553 Cr 22,483,343
↑ 183,343 Apar Industries Ltd (Industrials)
Equity, Since 31 Mar 17 | APARINDS1% ₹521 Cr 899,271 3. IDFC Infrastructure Fund
CAGR/Annualized return of 11.1% since its launch. Ranked 1 in Sectoral category. Return for 2024 was 39.3% , 2023 was 50.3% and 2022 was 1.7% . IDFC Infrastructure Fund
Growth Launch Date 8 Mar 11 NAV (09 Apr 25) ₹43.788 ↓ -0.39 (-0.88 %) Net Assets (Cr) ₹1,400 on 28 Feb 25 Category Equity - Sectoral AMC IDFC Asset Management Company Limited Rating ☆☆☆☆☆ Risk High Expense Ratio 2.33 Sharpe Ratio -0.3 Information Ratio 0 Alpha Ratio 0 Min Investment 5,000 Min SIP Investment 100 Exit Load 0-365 Days (1%),365 Days and above(NIL) Growth of 10,000 investment over the years.
Date Value 31 Mar 20 ₹10,000 31 Mar 21 ₹20,153 31 Mar 22 ₹24,848 31 Mar 23 ₹27,324 31 Mar 24 ₹47,064 31 Mar 25 ₹50,038 Returns for IDFC Infrastructure Fund
absolute basis & more than 1 year are on CAGR (Compound Annual Growth Rate) basis. as on 9 Apr 25 Duration Returns 1 Month 0.6% 3 Month -12.9% 6 Month -20% 1 Year -3.5% 3 Year 21.6% 5 Year 35.4% 10 Year 15 Year Since launch 11.1% Historical performance (Yearly) on absolute basis
Year Returns 2023 39.3% 2022 50.3% 2021 1.7% 2020 64.8% 2019 6.3% 2018 -5.3% 2017 -25.9% 2016 58.7% 2015 10.7% 2014 -0.2% Fund Manager information for IDFC Infrastructure Fund
Name Since Tenure Vishal Biraia 24 Jan 24 1.1 Yr. Ritika Behera 7 Oct 23 1.4 Yr. Gaurav Satra 7 Jun 24 0.73 Yr. Data below for IDFC Infrastructure Fund as on 28 Feb 25
Equity Sector Allocation
Sector Value Industrials 54.7% Utility 13.22% Basic Materials 10.84% Communication Services 4.49% Energy 3.88% Consumer Cyclical 3.46% Financial Services 2.99% Technology 2.07% Health Care 1.9% Asset Allocation
Asset Class Value Cash 2.43% Equity 97.57% Top Securities Holdings / Portfolio
Name Holding Value Quantity Kirloskar Brothers Ltd (Industrials)
Equity, Since 31 Dec 17 | KIRLOSBROS5% ₹71 Cr 443,385 Larsen & Toubro Ltd (Industrials)
Equity, Since 29 Feb 12 | LT4% ₹58 Cr 183,173
↑ 11,726 Reliance Industries Ltd (Energy)
Equity, Since 30 Jun 24 | RELIANCE4% ₹54 Cr 452,706 Bharti Airtel Ltd (Communication Services)
Equity, Since 30 Apr 19 | BHARTIARTL4% ₹52 Cr 330,018
↑ 40,855 UltraTech Cement Ltd (Basic Materials)
Equity, Since 31 Mar 14 | 5325384% ₹51 Cr 50,452
↑ 3,476 GPT Infraprojects Ltd (Industrials)
Equity, Since 30 Nov 17 | GPTINFRA3% ₹45 Cr 4,797,143 Adani Ports & Special Economic Zone Ltd (Industrials)
Equity, Since 31 Dec 23 | ADANIPORTS3% ₹39 Cr 365,137
↓ -69,842 PTC India Financial Services Ltd (Financial Services)
Equity, Since 31 Dec 23 | PFS3% ₹39 Cr 12,400,122 Bharat Electronics Ltd (Industrials)
Equity, Since 31 Oct 19 | BEL3% ₹35 Cr 1,431,700 KEC International Ltd (Industrials)
Equity, Since 30 Jun 24 | 5327143% ₹35 Cr 512,915 4. Nippon India Power and Infra Fund
CAGR/Annualized return of 17.7% since its launch. Ranked 13 in Sectoral category. Return for 2024 was 26.9% , 2023 was 58% and 2022 was 10.9% . Nippon India Power and Infra Fund
Growth Launch Date 8 May 04 NAV (09 Apr 25) ₹301.724 ↓ -1.87 (-0.61 %) Net Assets (Cr) ₹6,125 on 28 Feb 25 Category Equity - Sectoral AMC Nippon Life Asset Management Ltd. Rating ☆☆☆☆ Risk High Expense Ratio 2.05 Sharpe Ratio -0.55 Information Ratio 1.03 Alpha Ratio 1.38 Min Investment 5,000 Min SIP Investment 100 Exit Load 0-1 Years (1%),1 Years and above(NIL) Growth of 10,000 investment over the years.
Date Value 31 Mar 20 ₹10,000 31 Mar 21 ₹18,563 31 Mar 22 ₹23,186 31 Mar 23 ₹26,891 31 Mar 24 ₹47,550 31 Mar 25 ₹48,861 Returns for Nippon India Power and Infra Fund
absolute basis & more than 1 year are on CAGR (Compound Annual Growth Rate) basis. as on 9 Apr 25 Duration Returns 1 Month 0.5% 3 Month -10.3% 6 Month -18.1% 1 Year -4.6% 3 Year 24.2% 5 Year 35% 10 Year 15 Year Since launch 17.7% Historical performance (Yearly) on absolute basis
Year Returns 2023 26.9% 2022 58% 2021 10.9% 2020 48.9% 2019 10.8% 2018 -2.9% 2017 -21.1% 2016 61.7% 2015 0.1% 2014 0.3% Fund Manager information for Nippon India Power and Infra Fund
Name Since Tenure Kinjal Desai 25 May 18 6.77 Yr. Rahul Modi 19 Aug 24 0.53 Yr. Data below for Nippon India Power and Infra Fund as on 28 Feb 25
Equity Sector Allocation
Sector Value Industrials 40.77% Utility 19.49% Energy 9.09% Basic Materials 9.08% Communication Services 8.44% Real Estate 3.99% Technology 2.14% Health Care 2.08% Consumer Cyclical 1.96% Financial Services 1.78% Asset Allocation
Asset Class Value Cash 1.18% Equity 98.82% Top Securities Holdings / Portfolio
Name Holding Value Quantity Reliance Industries Ltd (Energy)
Equity, Since 30 Nov 18 | RELIANCE8% ₹480 Cr 4,000,000
↑ 250,000 NTPC Ltd (Utilities)
Equity, Since 31 May 09 | 5325558% ₹480 Cr 15,400,000 Larsen & Toubro Ltd (Industrials)
Equity, Since 30 Nov 07 | LT8% ₹472 Cr 1,492,001 Bharti Airtel Ltd (Communication Services)
Equity, Since 30 Apr 18 | BHARTIARTL7% ₹408 Cr 2,600,000 UltraTech Cement Ltd (Basic Materials)
Equity, Since 31 Oct 19 | 5325384% ₹243 Cr 240,038 Tata Power Co Ltd (Utilities)
Equity, Since 30 Apr 23 | 5004004% ₹237 Cr 6,975,789
↑ 500,000 Kaynes Technology India Ltd (Industrials)
Equity, Since 30 Nov 22 | KAYNES3% ₹176 Cr 423,938 Siemens Ltd (Industrials)
Equity, Since 31 May 21 | 5005503% ₹162 Cr 350,000 CG Power & Industrial Solutions Ltd (Industrials)
Equity, Since 30 Sep 24 | 5000932% ₹151 Cr 2,632,923
↑ 80,000 Carborundum Universal Ltd (Industrials)
Equity, Since 30 Sep 23 | CARBORUNIV2% ₹150 Cr 1,800,000 5. HDFC Infrastructure Fund
CAGR/Annualized return of since its launch. Ranked 26 in Sectoral category. Return for 2024 was 23% , 2023 was 55.4% and 2022 was 19.3% . HDFC Infrastructure Fund
Growth Launch Date 10 Mar 08 NAV (09 Apr 25) ₹41.942 ↓ -0.25 (-0.60 %) Net Assets (Cr) ₹2,105 on 28 Feb 25 Category Equity - Sectoral AMC HDFC Asset Management Company Limited Rating ☆☆☆ Risk High Expense Ratio 2.31 Sharpe Ratio -0.55 Information Ratio 0 Alpha Ratio 0 Min Investment 5,000 Min SIP Investment 300 Exit Load 0-1 Years (1%),1 Years and above(NIL) Growth of 10,000 investment over the years.
Date Value 31 Mar 20 ₹10,000 31 Mar 21 ₹17,356 31 Mar 22 ₹21,727 31 Mar 23 ₹25,279 31 Mar 24 ₹45,346 31 Mar 25 ₹47,548 Returns for HDFC Infrastructure Fund
absolute basis & more than 1 year are on CAGR (Compound Annual Growth Rate) basis. as on 9 Apr 25 Duration Returns 1 Month 2% 3 Month -6.9% 6 Month -13.6% 1 Year -2.5% 3 Year 25.4% 5 Year 35% 10 Year 15 Year Since launch Historical performance (Yearly) on absolute basis
Year Returns 2023 23% 2022 55.4% 2021 19.3% 2020 43.2% 2019 -7.5% 2018 -3.4% 2017 -29% 2016 43.3% 2015 -1.9% 2014 -2.5% Fund Manager information for HDFC Infrastructure Fund
Name Since Tenure Srinivasan Ramamurthy 12 Jan 24 1.13 Yr. Dhruv Muchhal 22 Jun 23 1.69 Yr. Data below for HDFC Infrastructure Fund as on 28 Feb 25
Equity Sector Allocation
Sector Value Industrials 38.42% Financial Services 20.62% Basic Materials 10.93% Utility 7.4% Energy 6.96% Communication Services 3.76% Health Care 1.73% Technology 0.98% Real Estate 0.94% Consumer Cyclical 0.58% Asset Allocation
Asset Class Value Cash 6.48% Equity 92.31% Debt 1.21% Top Securities Holdings / Portfolio
Name Holding Value Quantity ICICI Bank Ltd (Financial Services)
Equity, Since 31 Oct 09 | ICICIBANK7% ₹157 Cr 1,300,000 HDFC Bank Ltd (Financial Services)
Equity, Since 31 Aug 23 | HDFCBANK6% ₹121 Cr 700,000 Larsen & Toubro Ltd (Industrials)
Equity, Since 30 Jun 12 | LT6% ₹120 Cr 380,000
↑ 30,000 J Kumar Infraprojects Ltd (Industrials)
Equity, Since 31 Oct 15 | JKIL5% ₹98 Cr 1,450,000
↓ -50,000 NTPC Ltd (Utilities)
Equity, Since 31 Dec 17 | 5325553% ₹69 Cr 2,200,000 InterGlobe Aviation Ltd (Industrials)
Equity, Since 31 Dec 21 | INDIGO3% ₹67 Cr 150,000 Kalpataru Projects International Ltd (Industrials)
Equity, Since 31 Jan 23 | KPIL3% ₹67 Cr 758,285 Coal India Ltd (Energy)
Equity, Since 31 Oct 18 | COALINDIA3% ₹63 Cr 1,700,000 Reliance Industries Ltd (Energy)
Equity, Since 31 May 24 | RELIANCE3% ₹60 Cr 500,000 Bharti Airtel Ltd (Communication Services)
Equity, Since 30 Sep 20 | BHARTIARTL3% ₹55 Cr 350,000
↓ -50,000 6. SBI Contra Fund
CAGR/Annualized return of 14.7% since its launch. Ranked 48 in Contra category. Return for 2024 was 18.8% , 2023 was 38.2% and 2022 was 12.8% . SBI Contra Fund
Growth Launch Date 6 May 05 NAV (08 Apr 25) ₹346.106 ↑ 4.70 (1.38 %) Net Assets (Cr) ₹39,590 on 28 Feb 25 Category Equity - Contra AMC SBI Funds Management Private Limited Rating ☆☆☆ Risk Moderately High Expense Ratio 1.7 Sharpe Ratio -0.24 Information Ratio 1.96 Alpha Ratio 0.91 Min Investment 5,000 Min SIP Investment 500 Exit Load 0-1 Years (1%),1 Years and above(NIL) Growth of 10,000 investment over the years.
Date Value 31 Mar 20 ₹10,000 31 Mar 21 ₹20,310 31 Mar 22 ₹26,477 31 Mar 23 ₹29,993 31 Mar 24 ₹44,365 31 Mar 25 ₹47,483 Returns for SBI Contra Fund
absolute basis & more than 1 year are on CAGR (Compound Annual Growth Rate) basis. as on 9 Apr 25 Duration Returns 1 Month -0.6% 3 Month -7.4% 6 Month -11.8% 1 Year -0.5% 3 Year 18.3% 5 Year 34.8% 10 Year 15 Year Since launch 14.7% Historical performance (Yearly) on absolute basis
Year Returns 2023 18.8% 2022 38.2% 2021 12.8% 2020 49.9% 2019 30.6% 2018 -1% 2017 -14.3% 2016 40.2% 2015 2.4% 2014 -0.1% Fund Manager information for SBI Contra Fund
Name Since Tenure Dinesh Balachandran 7 May 18 6.82 Yr. Pradeep Kesavan 1 Dec 23 1.25 Yr. Data below for SBI Contra Fund as on 28 Feb 25
Equity Sector Allocation
Sector Value Financial Services 22.65% Technology 8.84% Basic Materials 7.09% Health Care 7.08% Energy 6.82% Consumer Cyclical 5.38% Utility 5.12% Consumer Defensive 4.3% Industrials 4.21% Communication Services 3.01% Real Estate 0.52% Asset Allocation
Asset Class Value Cash 23.8% Equity 75.02% Debt 1.18% Top Securities Holdings / Portfolio
Name Holding Value Quantity HDFC Bank Ltd (Financial Services)
Equity, Since 31 Aug 16 | HDFCBANK8% ₹3,071 Cr 17,724,629
↑ 5,001,500 Reliance Industries Ltd (Energy)
Equity, Since 31 Mar 23 | RELIANCE4% ₹1,480 Cr 12,328,250 Kotak Mahindra Bank Ltd (Financial Services)
Equity, Since 31 Mar 24 | KOTAKBANK3% ₹1,219 Cr 6,405,768
↑ 1,277,600 Tech Mahindra Ltd (Technology)
Equity, Since 31 Mar 22 | 5327552% ₹861 Cr 5,786,409 GAIL (India) Ltd (Utilities)
Equity, Since 28 Feb 21 | 5321552% ₹811 Cr 51,993,788 Cognizant Technology Solutions Corp Class A (Technology)
Equity, Since 28 Feb 23 | CTSH2% ₹786 Cr 1,079,430 Torrent Power Ltd (Utilities)
Equity, Since 31 Oct 21 | 5327792% ₹778 Cr 6,163,300 Tata Steel Ltd (Basic Materials)
Equity, Since 31 Jul 22 | TATASTEEL2% ₹727 Cr 52,995,525 State Bank of India (Financial Services)
Equity, Since 31 Dec 10 | SBIN2% ₹706 Cr 10,254,269 91 Days Tbill Red 24-04-2025
Sovereign Bonds | -2% ₹693 Cr 70,000,000 7. Motilal Oswal Midcap 30 Fund
CAGR/Annualized return of 21.4% since its launch. Ranked 27 in Mid Cap category. Return for 2024 was 57.1% , 2023 was 41.7% and 2022 was 10.7% . Motilal Oswal Midcap 30 Fund
Growth Launch Date 24 Feb 14 NAV (09 Apr 25) ₹86.7492 ↓ -0.61 (-0.70 %) Net Assets (Cr) ₹23,704 on 28 Feb 25 Category Equity - Mid Cap AMC Motilal Oswal Asset Management Co. Ltd Rating ☆☆☆ Risk Moderately High Expense Ratio 0.66 Sharpe Ratio 0.43 Information Ratio 0.72 Alpha Ratio 16.87 Min Investment 5,000 Min SIP Investment 500 Exit Load 0-1 Years (1%),1 Years and above(NIL) Growth of 10,000 investment over the years.
Date Value 31 Mar 20 ₹10,000 31 Mar 21 ₹16,888 31 Mar 22 ₹23,342 31 Mar 23 ₹25,677 31 Mar 24 ₹41,172 31 Mar 25 ₹48,151 Returns for Motilal Oswal Midcap 30 Fund
absolute basis & more than 1 year are on CAGR (Compound Annual Growth Rate) basis. as on 9 Apr 25 Duration Returns 1 Month -3.4% 3 Month -19.3% 6 Month -19.8% 1 Year 6.8% 3 Year 22.4% 5 Year 34% 10 Year 15 Year Since launch 21.4% Historical performance (Yearly) on absolute basis
Year Returns 2023 57.1% 2022 41.7% 2021 10.7% 2020 55.8% 2019 9.3% 2018 9.7% 2017 -12.7% 2016 30.8% 2015 5.2% 2014 16.5% Fund Manager information for Motilal Oswal Midcap 30 Fund
Name Since Tenure Ajay Khandelwal 1 Oct 24 0.41 Yr. Niket Shah 1 Jul 20 4.67 Yr. Rakesh Shetty 22 Nov 22 2.27 Yr. Sunil Sawant 1 Jul 24 0.67 Yr. Data below for Motilal Oswal Midcap 30 Fund as on 28 Feb 25
Equity Sector Allocation
Sector Value Technology 34.02% Consumer Cyclical 16.09% Industrials 11.09% Health Care 5% Communication Services 3.44% Real Estate 2.8% Basic Materials 2.32% Utility 2.06% Financial Services 0.09% Asset Allocation
Asset Class Value Cash 28.33% Equity 71.67% Top Securities Holdings / Portfolio
Name Holding Value Quantity Coforge Ltd (Technology)
Equity, Since 31 Mar 23 | COFORGE10% ₹2,349 Cr 3,190,000
↑ 340,000 Persistent Systems Ltd (Technology)
Equity, Since 31 Jan 23 | PERSISTENT10% ₹2,254 Cr 4,249,800
↑ 249,800 Kalyan Jewellers India Ltd (Consumer Cyclical)
Equity, Since 29 Feb 24 | KALYANKJIL7% ₹1,619 Cr 35,027,075
↑ 26,975 Dixon Technologies (India) Ltd (Technology)
Equity, Since 31 Mar 23 | DIXON7% ₹1,581 Cr 1,134,324
↑ 134,324 Max Healthcare Institute Ltd Ordinary Shares (Healthcare)
Equity, Since 31 Mar 24 | MAXHEALTH4% ₹975 Cr 9,969,361
↑ 1,913,231 One97 Communications Ltd (Technology)
Equity, Since 30 Sep 24 | 5433964% ₹934 Cr 13,066,359
↑ 3,065,359 Trent Ltd (Consumer Cyclical)
Equity, Since 30 Nov 24 | 5002514% ₹873 Cr 1,800,000
↓ -820,200 Polycab India Ltd (Industrials)
Equity, Since 30 Sep 23 | POLYCAB3% ₹825 Cr 1,750,000
↓ -100,000 Bharti Hexacom Ltd (Communication Services)
Equity, Since 31 Oct 24 | BHARTIHEXA3% ₹815 Cr 6,250,000
↑ 174,429 KEI Industries Ltd (Industrials)
Equity, Since 30 Nov 24 | KEI3% ₹768 Cr 2,500,000
↑ 1,250,000 8. DSP BlackRock India T.I.G.E.R Fund
CAGR/Annualized return of 17.2% since its launch. Ranked 12 in Sectoral category. Return for 2024 was 32.4% , 2023 was 49% and 2022 was 13.9% . DSP BlackRock India T.I.G.E.R Fund
Growth Launch Date 11 Jun 04 NAV (09 Apr 25) ₹271.775 ↓ -2.44 (-0.89 %) Net Assets (Cr) ₹4,465 on 28 Feb 25 Category Equity - Sectoral AMC DSP BlackRock Invmt Managers Pvt. Ltd. Rating ☆☆☆☆ Risk High Expense Ratio 2.24 Sharpe Ratio -0.22 Information Ratio 0 Alpha Ratio 0 Min Investment 1,000 Min SIP Investment 500 Exit Load 0-12 Months (1%),12 Months and above(NIL) Growth of 10,000 investment over the years.
Date Value 31 Mar 20 ₹10,000 31 Mar 21 ₹18,218 31 Mar 22 ₹23,467 31 Mar 23 ₹26,460 31 Mar 24 ₹43,618 31 Mar 25 ₹46,898 Returns for DSP BlackRock India T.I.G.E.R Fund
absolute basis & more than 1 year are on CAGR (Compound Annual Growth Rate) basis. as on 9 Apr 25 Duration Returns 1 Month 0.3% 3 Month -13% 6 Month -20.4% 1 Year -2.2% 3 Year 22% 5 Year 33.7% 10 Year 15 Year Since launch 17.2% Historical performance (Yearly) on absolute basis
Year Returns 2023 32.4% 2022 49% 2021 13.9% 2020 51.6% 2019 2.7% 2018 6.7% 2017 -17.2% 2016 47% 2015 4.1% 2014 0.7% Fund Manager information for DSP BlackRock India T.I.G.E.R Fund
Name Since Tenure Rohit Singhania 21 Jun 10 14.7 Yr. Data below for DSP BlackRock India T.I.G.E.R Fund as on 28 Feb 25
Equity Sector Allocation
Sector Value Industrials 31% Basic Materials 14.85% Consumer Cyclical 7.91% Utility 6.95% Energy 5.73% Financial Services 5.59% Communication Services 3.89% Health Care 3.66% Technology 2.56% Real Estate 1.49% Consumer Defensive 1.45% Asset Allocation
Asset Class Value Cash 14.93% Equity 85.07% Top Securities Holdings / Portfolio
Name Holding Value Quantity NTPC Ltd (Utilities)
Equity, Since 30 Nov 17 | 5325555% ₹223 Cr 7,145,883 Larsen & Toubro Ltd (Industrials)
Equity, Since 30 Jun 04 | LT4% ₹177 Cr 559,286
↓ -32,099 Siemens Ltd (Industrials)
Equity, Since 30 Nov 18 | 5005504% ₹171 Cr 369,482 Bharti Airtel Ltd (Communication Services)
Equity, Since 31 Oct 18 | BHARTIARTL4% ₹170 Cr 1,080,606 Coal India Ltd (Energy)
Equity, Since 31 Dec 23 | COALINDIA3% ₹123 Cr 3,321,453 Kalpataru Projects International Ltd (Industrials)
Equity, Since 31 Jan 22 | KPIL2% ₹92 Cr 1,045,339
↓ -114,092 Apollo Hospitals Enterprise Ltd (Healthcare)
Equity, Since 31 Dec 24 | APOLLOHOSP2% ₹91 Cr 150,959
↑ 19,956 INOX India Ltd (Industrials)
Equity, Since 31 Dec 23 | INOXINDIA2% ₹90 Cr 940,841 Kirloskar Oil Engines Ltd (Industrials)
Equity, Since 31 Mar 23 | KIRLOSENG2% ₹87 Cr 1,502,475 Welspun Corp Ltd (Basic Materials)
Equity, Since 30 Nov 23 | 5321442% ₹83 Cr 1,129,878
↓ -193,415 9. L&T Emerging Businesses Fund
CAGR/Annualized return of 19.3% since its launch. Ranked 2 in Small Cap category. Return for 2024 was 28.5% , 2023 was 46.1% and 2022 was 1% . L&T Emerging Businesses Fund
Growth Launch Date 12 May 14 NAV (09 Apr 25) ₹68.3221 ↓ -1.02 (-1.47 %) Net Assets (Cr) ₹13,334 on 28 Feb 25 Category Equity - Small Cap AMC L&T Investment Management Ltd Rating ☆☆☆☆☆ Risk High Expense Ratio 1.73 Sharpe Ratio -0.4 Information Ratio -0.11 Alpha Ratio 1.44 Min Investment 5,000 Min SIP Investment 500 Exit Load 0-1 Years (1%),1 Years and above(NIL) Growth of 10,000 investment over the years.
Date Value 31 Mar 20 ₹10,000 31 Mar 21 ₹20,010 31 Mar 22 ₹29,870 31 Mar 23 ₹31,289 31 Mar 24 ₹46,026 31 Mar 25 ₹48,026 Returns for L&T Emerging Businesses Fund
absolute basis & more than 1 year are on CAGR (Compound Annual Growth Rate) basis. as on 9 Apr 25 Duration Returns 1 Month -3% 3 Month -20.3% 6 Month -22.6% 1 Year -6.2% 3 Year 13.3% 5 Year 33.7% 10 Year 15 Year Since launch 19.3% Historical performance (Yearly) on absolute basis
Year Returns 2023 28.5% 2022 46.1% 2021 1% 2020 77.4% 2019 15.5% 2018 -8.1% 2017 -13.7% 2016 66.5% 2015 10.2% 2014 12.3% Fund Manager information for L&T Emerging Businesses Fund
Name Since Tenure Venugopal Manghat 17 Dec 19 5.21 Yr. Cheenu Gupta 1 Oct 23 1.42 Yr. Sonal Gupta 1 Oct 23 1.42 Yr. Data below for L&T Emerging Businesses Fund as on 28 Feb 25
Equity Sector Allocation
Sector Value Industrials 24.78% Consumer Cyclical 15.58% Financial Services 14.01% Basic Materials 10.75% Technology 9.78% Health Care 5.55% Real Estate 4.98% Consumer Defensive 4.06% Energy 1.26% Asset Allocation
Asset Class Value Cash 6.91% Equity 93.09% Top Securities Holdings / Portfolio
Name Holding Value Quantity Neuland Laboratories Limited
Equity, Since 31 Jan 24 | -2% ₹310 Cr 292,479
↓ -6,521 Aditya Birla Real Estate Ltd (Basic Materials)
Equity, Since 30 Sep 22 | 5000402% ₹297 Cr 1,595,574 Suven Pharmaceuticals Ltd (Healthcare)
Equity, Since 31 Mar 20 | SUVENPHAR2% ₹279 Cr 2,298,085 K.P.R. Mill Ltd (Consumer Cyclical)
Equity, Since 28 Feb 15 | KPRMILL2% ₹263 Cr 3,286,897 BSE Ltd (Financial Services)
Equity, Since 29 Feb 24 | BSE2% ₹257 Cr 555,021
↓ -297,579 Time Technoplast Ltd (Consumer Cyclical)
Equity, Since 31 Jan 24 | TIMETECHNO2% ₹243 Cr 6,810,500 Karur Vysya Bank Ltd (Financial Services)
Equity, Since 31 Oct 22 | 5900032% ₹240 Cr 11,912,400 Brigade Enterprises Ltd (Real Estate)
Equity, Since 31 Jul 19 | 5329292% ₹237 Cr 2,499,622 The Federal Bank Ltd (Financial Services)
Equity, Since 30 Sep 22 | FEDERALBNK2% ₹236 Cr 13,286,579 Sumitomo Chemical India Ltd Ordinary Shares (Basic Materials)
Equity, Since 31 Oct 20 | SUMICHEM2% ₹215 Cr 4,672,221 10. HDFC Small Cap Fund
CAGR/Annualized return of 15.5% since its launch. Ranked 9 in Small Cap category. Return for 2024 was 20.4% , 2023 was 44.8% and 2022 was 4.6% . HDFC Small Cap Fund
Growth Launch Date 3 Apr 08 NAV (09 Apr 25) ₹115.535 ↓ -0.92 (-0.79 %) Net Assets (Cr) ₹28,120 on 28 Feb 25 Category Equity - Small Cap AMC HDFC Asset Management Company Limited Rating ☆☆☆☆ Risk Moderately High Expense Ratio 1.64 Sharpe Ratio -0.57 Information Ratio 0 Alpha Ratio 0 Min Investment 5,000 Min SIP Investment 300 Exit Load 0-1 Years (1%),1 Years and above(NIL) Growth of 10,000 investment over the years.
Date Value 31 Mar 20 ₹10,000 31 Mar 21 ₹20,334 31 Mar 22 ₹27,320 31 Mar 23 ₹30,642 31 Mar 24 ₹45,265 31 Mar 25 ₹46,669 Returns for HDFC Small Cap Fund
absolute basis & more than 1 year are on CAGR (Compound Annual Growth Rate) basis. as on 9 Apr 25 Duration Returns 1 Month -2.8% 3 Month -15.4% 6 Month -17.6% 1 Year -6.5% 3 Year 15.4% 5 Year 33.5% 10 Year 15 Year Since launch 15.5% Historical performance (Yearly) on absolute basis
Year Returns 2023 20.4% 2022 44.8% 2021 4.6% 2020 64.9% 2019 20.2% 2018 -9.5% 2017 -8.1% 2016 60.8% 2015 5.4% 2014 6.4% Fund Manager information for HDFC Small Cap Fund
Name Since Tenure Chirag Setalvad 28 Jun 14 10.68 Yr. Dhruv Muchhal 22 Jun 23 1.69 Yr. Data below for HDFC Small Cap Fund as on 28 Feb 25
Equity Sector Allocation
Sector Value Industrials 22.65% Consumer Cyclical 18.71% Technology 15.51% Financial Services 12.57% Health Care 12.01% Basic Materials 6.85% Communication Services 2.04% Consumer Defensive 1.98% Utility 0.32% Asset Allocation
Asset Class Value Cash 7.35% Equity 92.65% Top Securities Holdings / Portfolio
Name Holding Value Quantity Firstsource Solutions Ltd (Technology)
Equity, Since 31 Mar 18 | FSL7% ₹1,898 Cr 54,866,841
↓ -400,000 eClerx Services Ltd (Technology)
Equity, Since 31 Mar 18 | ECLERX4% ₹1,061 Cr 3,745,096
↑ 10,000 Aster DM Healthcare Ltd Ordinary Shares (Healthcare)
Equity, Since 30 Jun 19 | ASTERDM3% ₹980 Cr 24,326,653 Bank of Baroda (Financial Services)
Equity, Since 31 Mar 19 | 5321343% ₹923 Cr 46,828,792 Fortis Healthcare Ltd (Healthcare)
Equity, Since 31 Jul 23 | 5328433% ₹763 Cr 12,453,275 Eris Lifesciences Ltd Registered Shs (Healthcare)
Equity, Since 31 Jul 23 | ERIS3% ₹706 Cr 5,971,657
↑ 41,589 Sonata Software Ltd (Technology)
Equity, Since 31 Oct 17 | SONATSOFTW2% ₹608 Cr 16,839,071
↑ 2,067,594 Krishna Institute of Medical Sciences Ltd (Healthcare)
Equity, Since 31 Jul 23 | 5433082% ₹596 Cr 11,442,105 Gabriel India Ltd (Consumer Cyclical)
Equity, Since 31 Oct 18 | GABRIEL2% ₹559 Cr 12,056,000 Sudarshan Chemical Industries Ltd (Basic Materials)
Equity, Since 29 Feb 24 | SUDARSCHEM2% ₹496 Cr 5,734,275
म्यूचुअल फंड एसआईपी ऑनलाइन में निवेश कैसे करें?
Fincash.com पर आजीवन मुफ्त निवेश खाता खोलें।
अपना पंजीकरण और केवाईसी प्रक्रिया पूरी करें
Upload Documents (PAN, Aadhaar, etc.). और, आप निवेश करने के लिए तैयार हैं!
यहां प्रदान की गई जानकारी सटीक है, यह सुनिश्चित करने के लिए सभी प्रयास किए गए हैं। हालांकि, डेटा की शुद्धता के संबंध में कोई गारंटी नहीं दी जाती है। कृपया कोई भी निवेश करने से पहले योजना सूचना दस्तावेज के साथ सत्यापित करें।
You Might Also Like


AMFI Registration No. 112358 | CIN: U74999MH2016PTC282153
Shepard Technologies Pvt. Ltd. (with ARN code 112358) makes no warranties or representations, express or implied, on products offered through the platform. It accepts no liability for any damages or losses, however caused, in connection with the use of, or on the reliance of its product or related services. Terms and conditions of the website are applicable.
©2025 Shepard Technologies Private Limited. All Rights Reserved