10 മികച്ച സ്മോൾ ക്യാപ് മ്യൂച്വൽ ഫണ്ടുകൾ 2022
സ്മോൾ ക്യാപ്സ് സാധാരണയായി നിർവചിക്കപ്പെടുന്നത് a ഉള്ള സ്ഥാപനങ്ങൾ എന്നാണ്വിപണി 500 കോടി രൂപയിൽ താഴെയുള്ള മൂലധനവൽക്കരണം (എംസി=കമ്പനി ഇഷ്യൂ ചെയ്യുന്ന ഓഹരികളുടെ എണ്ണം X മാർക്കറ്റ് വില) ദീർഘകാലാടിസ്ഥാനത്തിൽ സുസ്ഥിരമായ വളർച്ചയ്ക്ക് വലിയ സാധ്യതയുള്ള യുവ സ്ഥാപനങ്ങളാണ് സ്മോൾ ക്യാപ് കമ്പനികൾ. പക്ഷേ, വലിയ തോതിലുള്ളതിനെ അപേക്ഷിച്ച് ചെറിയ തൊപ്പികളിൽ പരാജയപ്പെടാനുള്ള സാധ്യത കൂടുതലാണ്മിഡ് ക്യാപ് കമ്പനികൾ.
ഇതിനായി തിരയുന്നുമികച്ച സ്മോൾ ക്യാപ് മ്യൂച്വൽ ഫണ്ടുകൾ? കൊള്ളാം, സ്മോൾ ക്യാപ് ഫണ്ടുകൾ ദീർഘകാലത്തേക്കുള്ള മികച്ച സമ്പത്ത് സൃഷ്ടിക്കൽ ഉപകരണങ്ങളിലൊന്നാണ്സാമ്പത്തിക ലക്ഷ്യങ്ങൾ. ഈ സാമ്പത്തിക ലക്ഷ്യങ്ങളിൽ കുട്ടിയുടെ വിദ്യാഭ്യാസം ഉൾപ്പെട്ടേക്കാം,വിരമിക്കൽ ആസൂത്രണം, തുടങ്ങിയവ.
എന്നിരുന്നാലും, സ്മോൾ ക്യാപ് ഫണ്ടുകൾ പോർട്ട്ഫോളിയോകൾ വൈവിധ്യവത്കരിക്കാൻ സഹായിക്കുന്നു, കൂടാതെ നിക്ഷേപകർക്ക് മൊത്തത്തിലുള്ള പോർട്ട്ഫോളിയോയിൽ ഒരു ചെറിയ വിഹിതം (5-10%) എടുക്കാം, അത് ദീർഘകാല നിക്ഷേപ കാലയളവിൽ മികച്ച പ്രകടനം കാഴ്ചവെക്കും.
എന്താണ് സ്മോൾ ക്യാപ് മ്യൂച്വൽ ഫണ്ടുകൾ?
സ്മോൾ-ക്യാപ്സ് നിർവചിക്കപ്പെട്ടിരിക്കുന്നത് "പൂർണ്ണമായ വിപണി മൂലധനത്തിന്റെ അടിസ്ഥാനത്തിൽ 251-ാമത്തെ കമ്പനി" എന്നാണ്. മാനദണ്ഡങ്ങൾ അനുസരിച്ച്, സ്മോൾ ക്യാപ് ഫണ്ടുകളുടെ പോർട്ട്ഫോളിയോയ്ക്ക് സ്മോൾ ക്യാപ് സ്റ്റോക്കുകളിൽ അതിന്റെ മൊത്തം ആസ്തിയുടെ 65 ശതമാനമെങ്കിലും ഉണ്ടായിരിക്കണം. ദീർഘകാലാടിസ്ഥാനത്തിൽ തങ്ങളുടെ വരുമാനം പരമാവധിയാക്കാൻ ആഗ്രഹിക്കുന്ന നിക്ഷേപകർ, ഉയർന്ന വരുമാനമുള്ളവർറിസ്ക് വിശപ്പ്, സ്മോൾ ക്യാപ് ഫണ്ടുകളിൽ അവരുടെ നിക്ഷേപങ്ങൾ ആസൂത്രണം ചെയ്യാൻ കഴിയും. സ്മോൾ ക്യാപ്സിന്റെ ചാഞ്ചാട്ടം സഹിക്കാൻ ഒരാൾക്ക് കഴിയണം. ഈ ഫണ്ടുകൾക്ക് ഒരു ബുൾ മാർക്കറ്റിൽ ഏറ്റവും കൂടുതൽ ഉയരാനും കരടി വിപണിയിലെ ഏറ്റവും കുത്തനെയുള്ള തകർച്ച നേരിടാനും കഴിയും. ഒപ്റ്റിമൽ റിട്ടേൺസ് നേടുന്നതിന്, ഒരുനിക്ഷേപകൻ കുറഞ്ഞത് മൂന്ന്-അഞ്ച് വർഷത്തിൽ കൂടുതൽ നിക്ഷേപിക്കണം.
Talk to our investment specialist
സ്മോൾ ക്യാപ് ഫണ്ടുകളുടെ മുൻകാല പ്രകടനം നോക്കുകയാണെങ്കിൽ, 2012 ജനുവരി 9 വരെ, സ്മോൾ ക്യാപ് ഫണ്ടുകളുടെ ശരാശരി മൂന്ന് വർഷത്തെ വരുമാനം മിഡ്, സ്മോൾ ക്യാപ് ഫണ്ടുകളുടെ 24 ശതമാനവുമായി താരതമ്യം ചെയ്യുമ്പോൾ 25.5 ശതമാനമാണ്. വലിയ ക്യാപ്പിന്റെ ശരാശരി മൂന്ന് വർഷത്തെ വരുമാനംഇക്വിറ്റി ഫണ്ടുകൾ 2012 ജനുവരി 9ന് 17.518 ശതമാനമായിരുന്നു. ഭാവിയിൽ വിജയഗാഥകളാകാൻ സാധ്യതയുള്ള നിരവധി സ്ഥാപനങ്ങൾ സ്മോൾ ക്യാപ് സ്പെയ്സിലുണ്ട്.
22-23 സാമ്പത്തിക വർഷത്തിൽ നിക്ഷേപിക്കുന്നതിനുള്ള മികച്ച 10 മികച്ച സ്മോൾ ക്യാപ് ഫണ്ടുകൾ
Fund NAV Net Assets (Cr) 3 MO (%) 6 MO (%) 1 YR (%) 3 YR (%) 5 YR (%) 2024 (%) Nippon India Small Cap Fund Growth ₹165.332
↑ 1.11 ₹68,969 -2.8 -1.9 -8.8 20.1 27.9 26.1 HDFC Small Cap Fund Growth ₹137.967
↑ 0.49 ₹38,412 -3.6 0.3 -5 19.4 25.4 20.4 Franklin India Smaller Companies Fund Growth ₹164.199
↑ 1.17 ₹13,790 -3.5 -5.4 -11.2 18.6 23.7 23.2 IDBI Small Cap Fund Growth ₹28.9431
↑ 0.24 ₹647 -6.3 -4.2 -15.8 14.9 23 40 Sundaram Small Cap Fund Growth ₹258.375
↑ 1.09 ₹3,496 -0.9 0.4 -3.8 19.5 23 19.1 ICICI Prudential Smallcap Fund Growth ₹85.74
↑ 0.26 ₹8,622 -3.6 -1.2 -4.6 15.9 22.9 15.6 DSP Small Cap Fund Growth ₹194.211
↑ 0.93 ₹16,868 -1.7 -1.6 -5.7 19.1 22.7 25.6 Kotak Small Cap Fund Growth ₹249.893
↑ 1.25 ₹18,024 -4.7 -4.3 -11.6 14.6 21.3 25.5 Aditya Birla Sun Life Small Cap Fund Growth ₹85.0202
↑ 0.86 ₹5,127 -0.4 -0.6 -6.8 16.7 19.3 21.5 SBI Small Cap Fund Growth ₹167.519
↑ 0.73 ₹36,945 -3.6 -1.4 -8.8 12.7 19.2 24.1 Note: Returns up to 1 year are on absolute basis & more than 1 year are on CAGR basis. as on 12 Dec 25 Research Highlights & Commentary of 10 Funds showcased
Commentary Nippon India Small Cap Fund HDFC Small Cap Fund Franklin India Smaller Companies Fund IDBI Small Cap Fund Sundaram Small Cap Fund ICICI Prudential Smallcap Fund DSP Small Cap Fund Kotak Small Cap Fund Aditya Birla Sun Life Small Cap Fund SBI Small Cap Fund Point 1 Highest AUM (₹68,969 Cr). Top quartile AUM (₹38,412 Cr). Lower mid AUM (₹13,790 Cr). Bottom quartile AUM (₹647 Cr). Bottom quartile AUM (₹3,496 Cr). Lower mid AUM (₹8,622 Cr). Upper mid AUM (₹16,868 Cr). Upper mid AUM (₹18,024 Cr). Bottom quartile AUM (₹5,127 Cr). Upper mid AUM (₹36,945 Cr). Point 2 Established history (15+ yrs). Established history (17+ yrs). Established history (19+ yrs). Established history (8+ yrs). Oldest track record among peers (20 yrs). Established history (18+ yrs). Established history (18+ yrs). Established history (20+ yrs). Established history (18+ yrs). Established history (16+ yrs). Point 3 Rating: 4★ (upper mid). Rating: 4★ (upper mid). Rating: 4★ (upper mid). Not Rated. Rating: 3★ (lower mid). Rating: 3★ (bottom quartile). Rating: 4★ (lower mid). Rating: 3★ (bottom quartile). Top rated. Rating: 5★ (top quartile). Point 4 Risk profile: Moderately High. Risk profile: Moderately High. Risk profile: Moderately High. Risk profile: Moderately High. Risk profile: Moderately High. Risk profile: Moderately High. Risk profile: Moderately High. Risk profile: Moderately High. Risk profile: Moderately High. Risk profile: Moderately High. Point 5 5Y return: 27.93% (top quartile). 5Y return: 25.38% (top quartile). 5Y return: 23.66% (upper mid). 5Y return: 23.03% (upper mid). 5Y return: 22.97% (upper mid). 5Y return: 22.92% (lower mid). 5Y return: 22.65% (lower mid). 5Y return: 21.30% (bottom quartile). 5Y return: 19.34% (bottom quartile). 5Y return: 19.17% (bottom quartile). Point 6 3Y return: 20.11% (top quartile). 3Y return: 19.40% (upper mid). 3Y return: 18.60% (upper mid). 3Y return: 14.92% (bottom quartile). 3Y return: 19.47% (top quartile). 3Y return: 15.94% (lower mid). 3Y return: 19.13% (upper mid). 3Y return: 14.56% (bottom quartile). 3Y return: 16.67% (lower mid). 3Y return: 12.70% (bottom quartile). Point 7 1Y return: -8.81% (lower mid). 1Y return: -5.05% (upper mid). 1Y return: -11.24% (bottom quartile). 1Y return: -15.80% (bottom quartile). 1Y return: -3.78% (top quartile). 1Y return: -4.56% (top quartile). 1Y return: -5.73% (upper mid). 1Y return: -11.58% (bottom quartile). 1Y return: -6.77% (upper mid). 1Y return: -8.80% (lower mid). Point 8 Alpha: -2.66 (lower mid). Alpha: 0.00 (top quartile). Alpha: -3.92 (bottom quartile). Alpha: -5.20 (bottom quartile). Alpha: 2.09 (top quartile). Alpha: -1.20 (lower mid). Alpha: 0.00 (upper mid). Alpha: -5.17 (bottom quartile). Alpha: 0.00 (upper mid). Alpha: 0.00 (upper mid). Point 9 Sharpe: -0.35 (lower mid). Sharpe: -0.07 (top quartile). Sharpe: -0.40 (lower mid). Sharpe: -0.43 (bottom quartile). Sharpe: -0.12 (top quartile). Sharpe: -0.28 (upper mid). Sharpe: -0.17 (upper mid). Sharpe: -0.46 (bottom quartile). Sharpe: -0.25 (upper mid). Sharpe: -0.45 (bottom quartile). Point 10 Information ratio: -0.11 (upper mid). Information ratio: 0.00 (top quartile). Information ratio: -0.26 (lower mid). Information ratio: -0.79 (bottom quartile). Information ratio: -0.43 (lower mid). Information ratio: -0.85 (bottom quartile). Information ratio: 0.00 (top quartile). Information ratio: -0.97 (bottom quartile). Information ratio: 0.00 (upper mid). Information ratio: 0.00 (upper mid). Nippon India Small Cap Fund
HDFC Small Cap Fund
Franklin India Smaller Companies Fund
IDBI Small Cap Fund
Sundaram Small Cap Fund
ICICI Prudential Smallcap Fund
DSP Small Cap Fund
Kotak Small Cap Fund
Aditya Birla Sun Life Small Cap Fund
SBI Small Cap Fund
100 കോടി & അടുക്കി5 വർഷംസിഎജിആർ മടങ്ങുന്നു.
The primary investment objective of the scheme is to generate long term capital appreciation by investing predominantly in equity and equity related instruments of small cap companies and the secondary objective is to generate consistent returns by investing in debt and money market securities. Research Highlights for Nippon India Small Cap Fund Below is the key information for Nippon India Small Cap Fund Returns up to 1 year are on To provide long-term capital appreciation by investing predominantly in Small-Cap and Mid-Cap companies. Research Highlights for HDFC Small Cap Fund Below is the key information for HDFC Small Cap Fund Returns up to 1 year are on The Fund seeks to provide long-term capital appreciation by investing in mid and small cap companies. Research Highlights for Franklin India Smaller Companies Fund Below is the key information for Franklin India Smaller Companies Fund Returns up to 1 year are on The Investment objective of the Scheme is to provide investors with the opportunities for long-term capital appreciation by investing predominantly in Equity and Equity related instruments of Small Cap companies. However
there can be no assurance that the investment objective under the Scheme will be realized. Research Highlights for IDBI Small Cap Fund Below is the key information for IDBI Small Cap Fund Returns up to 1 year are on (Erstwhile Sundaram SMILE Fund) To primarily achieve capital appreciation by
investing in diversified stocks that are
generally termed as small and mid-caps and
by investing in other equities. Research Highlights for Sundaram Small Cap Fund Below is the key information for Sundaram Small Cap Fund Returns up to 1 year are on (Erstwhile ICICI Prudential Indo Asia Equity Fund) ICICI Prudential Indo Asia Equity Fund is an OE equity scheme that seeks to generate long term capital appreciation by investing in equity, equity related securities and or share classes/units of equity funds of companies, which are incorporated or have their area of primary activity, in the Asia Pacific region. Initially the Scheme will invest in share classes of International Opportunities Fund Asian Equity Fund and thereafter the Fund Manager of the Indo Asia Equity Fund may choose to make investment in listed equity shares, securities in the Asia Pacific region. However, there can be no assurance that the investment objective of the Scheme will be realized. Research Highlights for ICICI Prudential Smallcap Fund Below is the key information for ICICI Prudential Smallcap Fund Returns up to 1 year are on (Erstwhile DSP BlackRock Micro Cap Fund) The primary investment objective is to seek to generate long term capital appreciation from a portfolio that is substantially constituted of equity and equity related securities of small cap companies. From time to time, the fund manager will also seek participation in other equity and equity related securities to achieve optimal portfolio construction. There is no assurance that the investment objective of the Scheme will be realized Research Highlights for DSP Small Cap Fund Below is the key information for DSP Small Cap Fund Returns up to 1 year are on (Erstwhile Kotak Midcap Scheme) The investment objective of the Scheme is to generate capital appreciation from a diversified portfolio of equity and equity related securities. Research Highlights for Kotak Small Cap Fund Below is the key information for Kotak Small Cap Fund Returns up to 1 year are on (Erstwhile Aditya Birla Sun Life Small & Midcap Fund) An Open ended Small and Mid Cap Equity Scheme with an objective to generate consistent long-term capital appreciation by investing predominantly in equity and equity related securities of companies considered to be small and midcap. The Scheme may also invest a certain portion of its corpus in fixed income securities including money market instruments, in order to meet liquidity requirements from time to time. Research Highlights for Aditya Birla Sun Life Small Cap Fund Below is the key information for Aditya Birla Sun Life Small Cap Fund Returns up to 1 year are on (Erstwhile SBI Small & Midcap Fund) The Scheme seeks to generate income and long term capital appreciation by
investing in a diversified portfolio of predominantly in equity and equity related securities of small & midcap Companies Research Highlights for SBI Small Cap Fund Below is the key information for SBI Small Cap Fund Returns up to 1 year are on 1. Nippon India Small Cap Fund
Nippon India Small Cap Fund
Growth Launch Date 16 Sep 10 NAV (12 Dec 25) ₹165.332 ↑ 1.11 (0.67 %) Net Assets (Cr) ₹68,969 on 31 Oct 25 Category Equity - Small Cap AMC Nippon Life Asset Management Ltd. Rating ☆☆☆☆ Risk Moderately High Expense Ratio 1.44 Sharpe Ratio -0.35 Information Ratio -0.11 Alpha Ratio -2.66 Min Investment 5,000 Min SIP Investment 100 Exit Load 0-1 Years (1%),1 Years and above(NIL) Growth of 10,000 investment over the years.
Date Value 30 Nov 20 ₹10,000 30 Nov 21 ₹17,553 30 Nov 22 ₹20,288 30 Nov 23 ₹28,079 30 Nov 24 ₹37,706 30 Nov 25 ₹36,088 Returns for Nippon India Small Cap Fund
absolute basis & more than 1 year are on CAGR (Compound Annual Growth Rate) basis. as on 12 Dec 25 Duration Returns 1 Month -2.9% 3 Month -2.8% 6 Month -1.9% 1 Year -8.8% 3 Year 20.1% 5 Year 27.9% 10 Year 15 Year Since launch 20.2% Historical performance (Yearly) on absolute basis
Year Returns 2024 26.1% 2023 48.9% 2022 6.5% 2021 74.3% 2020 29.2% 2019 -2.5% 2018 -16.7% 2017 63% 2016 5.6% 2015 15.1% Fund Manager information for Nippon India Small Cap Fund
Name Since Tenure Samir Rachh 2 Jan 17 8.83 Yr. Kinjal Desai 25 May 18 7.44 Yr. Lokesh Maru 5 Sep 25 0.16 Yr. Divya Sharma 5 Sep 25 0.16 Yr. Data below for Nippon India Small Cap Fund as on 31 Oct 25
Equity Sector Allocation
Sector Value Industrials 20.62% Financial Services 15.84% Consumer Cyclical 15.32% Basic Materials 11.51% Consumer Defensive 9.7% Health Care 8.96% Technology 7.64% Utility 2.56% Energy 1.78% Communication Services 1.38% Real Estate 0.56% Asset Allocation
Asset Class Value Cash 4.15% Equity 95.85% Top Securities Holdings / Portfolio
Name Holding Value Quantity Multi Commodity Exchange of India Ltd (Financial Services)
Equity, Since 28 Feb 21 | MCX2% ₹1,711 Cr 1,851,010 HDFC Bank Ltd (Financial Services)
Equity, Since 30 Apr 22 | HDFCBANK2% ₹1,313 Cr 13,300,000 State Bank of India (Financial Services)
Equity, Since 31 Oct 19 | SBIN1% ₹970 Cr 10,347,848
↑ 1,247,848 Karur Vysya Bank Ltd (Financial Services)
Equity, Since 28 Feb 17 | 5900031% ₹927 Cr 38,140,874 Kirloskar Brothers Ltd (Industrials)
Equity, Since 31 Oct 12 | KIRLOSBROS1% ₹838 Cr 4,472,130 eClerx Services Ltd (Technology)
Equity, Since 31 Jul 20 | ECLERX1% ₹810 Cr 1,712,794
↓ -49,536 Zydus Wellness Ltd (Consumer Defensive)
Equity, Since 31 Aug 16 | ZYDUSWELL1% ₹803 Cr 16,848,030 TD Power Systems Ltd (Industrials)
Equity, Since 31 Dec 15 | TDPOWERSYS1% ₹796 Cr 10,278,244 Apar Industries Ltd (Industrials)
Equity, Since 31 Mar 17 | APARINDS1% ₹780 Cr 899,271 Bharat Heavy Electricals Ltd (Industrials)
Equity, Since 30 Sep 22 | 5001031% ₹758 Cr 28,538,232 2. HDFC Small Cap Fund
HDFC Small Cap Fund
Growth Launch Date 3 Apr 08 NAV (12 Dec 25) ₹137.967 ↑ 0.49 (0.35 %) Net Assets (Cr) ₹38,412 on 31 Oct 25 Category Equity - Small Cap AMC HDFC Asset Management Company Limited Rating ☆☆☆☆ Risk Moderately High Expense Ratio 1.58 Sharpe Ratio -0.07 Information Ratio 0 Alpha Ratio 0 Min Investment 5,000 Min SIP Investment 300 Exit Load 0-1 Years (1%),1 Years and above(NIL) Growth of 10,000 investment over the years.
Date Value 30 Nov 20 ₹10,000 30 Nov 21 ₹17,026 30 Nov 22 ₹18,804 30 Nov 23 ₹26,002 30 Nov 24 ₹32,836 30 Nov 25 ₹33,053 Returns for HDFC Small Cap Fund
absolute basis & more than 1 year are on CAGR (Compound Annual Growth Rate) basis. as on 12 Dec 25 Duration Returns 1 Month -3.7% 3 Month -3.6% 6 Month 0.3% 1 Year -5% 3 Year 19.4% 5 Year 25.4% 10 Year 15 Year Since launch 16% Historical performance (Yearly) on absolute basis
Year Returns 2024 20.4% 2023 44.8% 2022 4.6% 2021 64.9% 2020 20.2% 2019 -9.5% 2018 -8.1% 2017 60.8% 2016 5.4% 2015 6.4% Fund Manager information for HDFC Small Cap Fund
Name Since Tenure Chirag Setalvad 28 Jun 14 11.35 Yr. Dhruv Muchhal 22 Jun 23 2.36 Yr. Data below for HDFC Small Cap Fund as on 31 Oct 25
Equity Sector Allocation
Sector Value Industrials 21.41% Consumer Cyclical 18.78% Technology 13.39% Health Care 12.32% Financial Services 11.86% Basic Materials 6.64% Consumer Defensive 3.31% Communication Services 1.87% Asset Allocation
Asset Class Value Cash 9.63% Equity 90.37% Top Securities Holdings / Portfolio
Name Holding Value Quantity Firstsource Solutions Ltd (Technology)
Equity, Since 31 Mar 18 | FSL5% ₹1,956 Cr 55,264,362
↑ 352,528 eClerx Services Ltd (Technology)
Equity, Since 31 Mar 18 | ECLERX4% ₹1,715 Cr 3,626,595
↓ -57,166 Aster DM Healthcare Ltd Ordinary Shares (Healthcare)
Equity, Since 30 Jun 19 | ASTERDM4% ₹1,622 Cr 23,927,134
↓ -200,000 Bank of Baroda (Financial Services)
Equity, Since 31 Mar 19 | 5321343% ₹1,304 Cr 46,828,792 Gabriel India Ltd (Consumer Cyclical)
Equity, Since 31 Oct 18 | GABRIEL3% ₹1,207 Cr 9,477,375
↓ -397,625 Eris Lifesciences Ltd Registered Shs (Healthcare)
Equity, Since 31 Jul 23 | ERIS3% ₹1,032 Cr 6,482,100
↑ 145,557 Fortis Healthcare Ltd (Healthcare)
Equity, Since 31 Jul 23 | 5328433% ₹1,020 Cr 9,973,132
↓ -100,000 Indian Bank (Financial Services)
Equity, Since 31 Jul 16 | 5328142% ₹832 Cr 9,688,128 Krishna Institute of Medical Sciences Ltd (Healthcare)
Equity, Since 31 Jul 23 | 5433082% ₹802 Cr 11,127,166 Sonata Software Ltd (Technology)
Equity, Since 31 Oct 17 | SONATSOFTW2% ₹712 Cr 19,259,838
↑ 105,725 3. Franklin India Smaller Companies Fund
Franklin India Smaller Companies Fund
Growth Launch Date 13 Jan 06 NAV (12 Dec 25) ₹164.199 ↑ 1.17 (0.72 %) Net Assets (Cr) ₹13,790 on 31 Oct 25 Category Equity - Small Cap AMC Franklin Templeton Asst Mgmt(IND)Pvt Ltd Rating ☆☆☆☆ Risk Moderately High Expense Ratio 1.72 Sharpe Ratio -0.41 Information Ratio -0.26 Alpha Ratio -3.92 Min Investment 5,000 Min SIP Investment 500 Exit Load 0-1 Years (1%),1 Years and above(NIL) Growth of 10,000 investment over the years.
Date Value 30 Nov 20 ₹10,000 30 Nov 21 ₹16,482 30 Nov 22 ₹17,781 30 Nov 23 ₹25,327 30 Nov 24 ₹32,875 30 Nov 25 ₹30,746 Returns for Franklin India Smaller Companies Fund
absolute basis & more than 1 year are on CAGR (Compound Annual Growth Rate) basis. as on 12 Dec 25 Duration Returns 1 Month -4% 3 Month -3.5% 6 Month -5.4% 1 Year -11.2% 3 Year 18.6% 5 Year 23.7% 10 Year 15 Year Since launch 15.1% Historical performance (Yearly) on absolute basis
Year Returns 2024 23.2% 2023 52.1% 2022 3.6% 2021 56.4% 2020 18.7% 2019 -5% 2018 -17.4% 2017 43.5% 2016 10.2% 2015 9.6% Fund Manager information for Franklin India Smaller Companies Fund
Name Since Tenure R. Janakiraman 1 Feb 11 14.76 Yr. Sandeep Manam 18 Oct 21 4.04 Yr. Akhil Kalluri 8 Sep 22 3.15 Yr. Data below for Franklin India Smaller Companies Fund as on 31 Oct 25
Equity Sector Allocation
Sector Value Consumer Cyclical 20.09% Financial Services 17.93% Industrials 17.12% Health Care 10.96% Basic Materials 10.48% Technology 7.98% Real Estate 4.69% Consumer Defensive 3.71% Utility 3.49% Energy 1.02% Asset Allocation
Asset Class Value Cash 1.79% Equity 98.05% Top Securities Holdings / Portfolio
Name Holding Value Quantity Brigade Enterprises Ltd (Real Estate)
Equity, Since 30 Jun 14 | 5329293% ₹401 Cr 3,868,691 Aster DM Healthcare Ltd Ordinary Shares (Healthcare)
Equity, Since 31 Jul 23 | ASTERDM3% ₹381 Cr 5,618,134
↓ -1,111,274 Syrma SGS Technology Ltd (Technology)
Equity, Since 31 Aug 22 | SYRMA2% ₹327 Cr 4,023,411 Eris Lifesciences Ltd Registered Shs (Healthcare)
Equity, Since 30 Sep 19 | ERIS2% ₹297 Cr 1,866,828 CCL Products (India) Ltd (Consumer Defensive)
Equity, Since 30 Apr 19 | CCL2% ₹280 Cr 3,260,279 Equitas Small Finance Bank Ltd Ordinary Shares (Financial Services)
Equity, Since 31 Oct 20 | EQUITASBNK2% ₹274 Cr 48,064,081 Zensar Technologies Ltd (Technology)
Equity, Since 28 Feb 23 | ZENSARTECH2% ₹257 Cr 3,220,340 Kalyan Jewellers India Ltd (Consumer Cyclical)
Equity, Since 31 May 22 | KALYANKJIL2% ₹253 Cr 4,963,469 Sobha Ltd (Real Estate)
Equity, Since 31 Mar 12 | SOBHA2% ₹245 Cr 1,513,099 Whirlpool of India Ltd (Consumer Cyclical)
Equity, Since 30 Apr 25 | 5002382% ₹245 Cr 1,750,000
↑ 450,000 4. IDBI Small Cap Fund
IDBI Small Cap Fund
Growth Launch Date 21 Jun 17 NAV (12 Dec 25) ₹28.9431 ↑ 0.24 (0.83 %) Net Assets (Cr) ₹647 on 31 Oct 25 Category Equity - Small Cap AMC IDBI Asset Management Limited Rating Risk Moderately High Expense Ratio 2.3 Sharpe Ratio -0.43 Information Ratio -0.79 Alpha Ratio -5.2 Min Investment 5,000 Min SIP Investment 500 Exit Load 0-12 Months (1%),12 Months and above(NIL) Growth of 10,000 investment over the years.
Date Value 30 Nov 20 ₹10,000 30 Nov 21 ₹17,092 30 Nov 22 ₹18,785 30 Nov 23 ₹23,223 30 Nov 24 ₹33,354 30 Nov 25 ₹29,505 Returns for IDBI Small Cap Fund
absolute basis & more than 1 year are on CAGR (Compound Annual Growth Rate) basis. as on 12 Dec 25 Duration Returns 1 Month -4.5% 3 Month -6.3% 6 Month -4.2% 1 Year -15.8% 3 Year 14.9% 5 Year 23% 10 Year 15 Year Since launch 13.4% Historical performance (Yearly) on absolute basis
Year Returns 2024 40% 2023 33.4% 2022 2.4% 2021 64.7% 2020 19% 2019 -4.4% 2018 -15% 2017 2016 2015 Fund Manager information for IDBI Small Cap Fund
Name Since Tenure Nikhil Rungta 1 Jul 24 1.33 Yr. Mahesh Bendre 1 Jul 24 1.33 Yr. Data below for IDBI Small Cap Fund as on 31 Oct 25
Equity Sector Allocation
Sector Value Industrials 30.11% Basic Materials 14.97% Consumer Cyclical 14.55% Consumer Defensive 8.55% Technology 7.49% Health Care 7.15% Financial Services 7.05% Utility 6.09% Communication Services 0.9% Real Estate 0.02% Asset Allocation
Asset Class Value Cash 3.11% Equity 96.89% Top Securities Holdings / Portfolio
Name Holding Value Quantity Apollo Micro Systems Ltd Ordinary Shares (Industrials)
Equity, Since 30 Jun 25 | APOLLO3% ₹22 Cr 877,192 Allied Blenders and Distillers Ltd (Consumer Defensive)
Equity, Since 31 Jul 24 | ABDL3% ₹22 Cr 326,140 Avalon Technologies Ltd (Technology)
Equity, Since 31 Aug 23 | AVALON3% ₹16 Cr 135,939
↓ -12,174 Manorama Industries Ltd (Consumer Defensive)
Equity, Since 31 Dec 24 | 5419742% ₹15 Cr 109,106 Syrma SGS Technology Ltd (Technology)
Equity, Since 31 May 25 | SYRMA2% ₹15 Cr 180,780 Navkar Corp Ltd (Industrials)
Equity, Since 31 Jul 24 | NAVKARCORP2% ₹13 Cr 1,130,075 Housing & Urban Development Corp Ltd (Financial Services)
Equity, Since 31 Oct 24 | HUDCO2% ₹13 Cr 557,918 Concord Enviro Systems Ltd (Utilities)
Equity, Since 31 Dec 24 | CEWATER2% ₹13 Cr 270,441 Arvind Fashions Ltd (Consumer Cyclical)
Equity, Since 29 Feb 24 | ARVINDFASN2% ₹13 Cr 259,739 Navin Fluorine International Ltd (Basic Materials)
Equity, Since 30 Sep 19 | NAVINFLUOR2% ₹13 Cr 22,671 5. Sundaram Small Cap Fund
Sundaram Small Cap Fund
Growth Launch Date 15 Feb 05 NAV (12 Dec 25) ₹258.375 ↑ 1.09 (0.42 %) Net Assets (Cr) ₹3,496 on 31 Oct 25 Category Equity - Small Cap AMC Sundaram Asset Management Company Ltd Rating ☆☆☆ Risk Moderately High Expense Ratio 1.94 Sharpe Ratio -0.12 Information Ratio -0.43 Alpha Ratio 2.09 Min Investment 5,000 Min SIP Investment 100 Exit Load 0-12 Months (1%),12 Months and above(NIL) Growth of 10,000 investment over the years.
Date Value 30 Nov 20 ₹10,000 30 Nov 21 ₹16,534 30 Nov 22 ₹17,246 30 Nov 23 ₹23,461 30 Nov 24 ₹29,453 30 Nov 25 ₹29,784 Returns for Sundaram Small Cap Fund
absolute basis & more than 1 year are on CAGR (Compound Annual Growth Rate) basis. as on 12 Dec 25 Duration Returns 1 Month -2.7% 3 Month -0.9% 6 Month 0.4% 1 Year -3.8% 3 Year 19.5% 5 Year 23% 10 Year 15 Year Since launch 16.9% Historical performance (Yearly) on absolute basis
Year Returns 2024 19.1% 2023 45.3% 2022 -2.1% 2021 60.3% 2020 26.2% 2019 -6.1% 2018 -29.2% 2017 55.6% 2016 -0.1% 2015 7.8% Fund Manager information for Sundaram Small Cap Fund
Name Since Tenure Rohit Seksaria 1 Nov 22 3 Yr. Data below for Sundaram Small Cap Fund as on 31 Oct 25
Equity Sector Allocation
Sector Value Consumer Cyclical 19.13% Financial Services 18.65% Industrials 18.24% Health Care 11.99% Basic Materials 8.49% Communication Services 5.41% Technology 4.38% Consumer Defensive 2.59% Real Estate 2.58% Utility 1.09% Asset Allocation
Asset Class Value Cash 5.96% Equity 93.99% Debt 0.05% Other 0% Top Securities Holdings / Portfolio
Name Holding Value Quantity Aster DM Healthcare Ltd Ordinary Shares (Healthcare)
Equity, Since 30 Nov 23 | ASTERDM3% ₹114 Cr 1,681,362
↓ -217,293 Affle 3i Ltd (Communication Services)
Equity, Since 31 May 21 | AFFLE3% ₹102 Cr 530,036 MTAR Technologies Ltd (Industrials)
Equity, Since 31 Dec 24 | MTARTECH3% ₹102 Cr 399,900 E I D Parry India Ltd (Basic Materials)
Equity, Since 31 Jul 24 | EIDPARRY3% ₹98 Cr 914,768
↑ 15,305 Craftsman Automation Ltd (Consumer Cyclical)
Equity, Since 30 Jun 24 | CRAFTSMAN3% ₹94 Cr 140,821 SJS Enterprises Ltd (Consumer Cyclical)
Equity, Since 31 Aug 23 | 5433873% ₹93 Cr 577,256
↓ -64,527 Safari Industries (India) Ltd (Consumer Cyclical)
Equity, Since 28 Feb 21 | 5230253% ₹92 Cr 431,921 Rategain Travel Technologies Ltd (Technology)
Equity, Since 30 Jun 23 | 5434173% ₹92 Cr 1,434,521
↑ 26,843 PNB Housing Finance Ltd (Financial Services)
Equity, Since 31 Jul 24 | PNBHOUSING3% ₹89 Cr 953,608
↓ -37,951 Cholamandalam Financial Holdings Ltd (Financial Services)
Equity, Since 31 Jan 20 | CHOLAHLDNG2% ₹76 Cr 395,668 6. ICICI Prudential Smallcap Fund
ICICI Prudential Smallcap Fund
Growth Launch Date 18 Oct 07 NAV (12 Dec 25) ₹85.74 ↑ 0.26 (0.30 %) Net Assets (Cr) ₹8,622 on 31 Oct 25 Category Equity - Small Cap AMC ICICI Prudential Asset Management Company Limited Rating ☆☆☆ Risk Moderately High Expense Ratio 1.78 Sharpe Ratio -0.28 Information Ratio -0.85 Alpha Ratio -1.2 Min Investment 5,000 Min SIP Investment 100 Exit Load 0-1 Years (1%),1 Years and above(NIL) Growth of 10,000 investment over the years.
Date Value 30 Nov 20 ₹10,000 30 Nov 21 ₹17,258 30 Nov 22 ₹18,653 30 Nov 23 ₹24,038 30 Nov 24 ₹29,756 30 Nov 25 ₹29,274 Returns for ICICI Prudential Smallcap Fund
absolute basis & more than 1 year are on CAGR (Compound Annual Growth Rate) basis. as on 12 Dec 25 Duration Returns 1 Month -1.9% 3 Month -3.6% 6 Month -1.2% 1 Year -4.6% 3 Year 15.9% 5 Year 22.9% 10 Year 15 Year Since launch 12.6% Historical performance (Yearly) on absolute basis
Year Returns 2024 15.6% 2023 37.9% 2022 5.7% 2021 61% 2020 22.8% 2019 10% 2018 -22.4% 2017 42.7% 2016 6% 2015 0.5% Fund Manager information for ICICI Prudential Smallcap Fund
Name Since Tenure Anish Tawakley 18 Sep 23 2.12 Yr. Sharmila D’mello 30 Jun 22 3.34 Yr. Aatur Shah 21 Apr 25 0.53 Yr. Data below for ICICI Prudential Smallcap Fund as on 31 Oct 25
Equity Sector Allocation
Sector Value Industrials 26.46% Basic Materials 22.9% Consumer Cyclical 12.76% Financial Services 8.9% Health Care 7.17% Consumer Defensive 2.87% Utility 2.45% Real Estate 1.44% Technology 1.18% Energy 0.65% Communication Services 0.37% Asset Allocation
Asset Class Value Cash 6.12% Equity 92.95% Debt 0.93% Top Securities Holdings / Portfolio
Name Holding Value Quantity Nifty 50 Index
- | -5% ₹389 Cr 150,000
↑ 150,000 Larsen & Toubro Ltd (Industrials)
Equity, Since 31 Oct 23 | LT4% ₹306 Cr 760,000
↓ -20,000 HDFC Bank Ltd (Financial Services)
Equity, Since 31 Aug 25 | HDFCBANK3% ₹253 Cr 2,565,056
↑ 265,056 Gujarat Pipavav Port Ltd (Industrials)
Equity, Since 31 Mar 18 | 5332483% ₹220 Cr 13,229,877 Procter & Gamble Health Ltd (Healthcare)
Equity, Since 29 Feb 24 | PGHL3% ₹220 Cr 356,022 Tata Chemicals Ltd (Basic Materials)
Equity, Since 31 Aug 24 | TATACHEM2% ₹205 Cr 2,300,000 Atul Ltd (Basic Materials)
Equity, Since 31 Oct 23 | ATUL2% ₹200 Cr 346,657 Gillette India Ltd (Consumer Defensive)
Equity, Since 31 Dec 23 | GILLETTE2% ₹197 Cr 218,670
↑ 30,350 UltraTech Cement Ltd (Basic Materials)
Equity, Since 30 Sep 23 | 5325382% ₹179 Cr 150,000 Hero MotoCorp Ltd (Consumer Cyclical)
Equity, Since 30 Apr 24 | HEROMOTOCO2% ₹177 Cr 320,000 7. DSP Small Cap Fund
DSP Small Cap Fund
Growth Launch Date 14 Jun 07 NAV (12 Dec 25) ₹194.211 ↑ 0.93 (0.48 %) Net Assets (Cr) ₹16,868 on 31 Oct 25 Category Equity - Small Cap AMC DSP BlackRock Invmt Managers Pvt. Ltd. Rating ☆☆☆☆ Risk Moderately High Expense Ratio 1.72 Sharpe Ratio -0.17 Information Ratio 0 Alpha Ratio 0 Min Investment 1,000 Min SIP Investment 500 Exit Load 0-12 Months (1%),12 Months and above(NIL) Growth of 10,000 investment over the years.
Date Value 30 Nov 20 ₹10,000 30 Nov 21 ₹15,963 30 Nov 22 ₹17,023 30 Nov 23 ₹23,070 30 Nov 24 ₹29,450 30 Nov 25 ₹29,321 Returns for DSP Small Cap Fund
absolute basis & more than 1 year are on CAGR (Compound Annual Growth Rate) basis. as on 12 Dec 25 Duration Returns 1 Month -2.2% 3 Month -1.7% 6 Month -1.6% 1 Year -5.7% 3 Year 19.1% 5 Year 22.7% 10 Year 15 Year Since launch 17.4% Historical performance (Yearly) on absolute basis
Year Returns 2024 25.6% 2023 41.2% 2022 0.5% 2021 58.9% 2020 33.1% 2019 0.7% 2018 -25.5% 2017 42.8% 2016 12.7% 2015 20.4% Fund Manager information for DSP Small Cap Fund
Name Since Tenure Vinit Sambre 21 Jun 10 15.37 Yr. Data below for DSP Small Cap Fund as on 31 Oct 25
Equity Sector Allocation
Sector Value Consumer Cyclical 31.76% Basic Materials 17.31% Industrials 15.33% Health Care 9.56% Consumer Defensive 7.31% Financial Services 7.03% Technology 3.62% Communication Services 0.71% Utility 0.15% Asset Allocation
Asset Class Value Cash 7.22% Equity 92.78% Top Securities Holdings / Portfolio
Name Holding Value Quantity Lumax Auto Technologies Ltd (Consumer Cyclical)
Equity, Since 30 Jun 18 | LUMAXTECH4% ₹699 Cr 6,196,634 Welspun Corp Ltd (Basic Materials)
Equity, Since 31 Mar 21 | 5321443% ₹531 Cr 5,500,000 eClerx Services Ltd (Technology)
Equity, Since 28 Feb 18 | ECLERX3% ₹523 Cr 1,105,918 Dodla Dairy Ltd (Consumer Defensive)
Equity, Since 30 Jun 21 | 5433063% ₹484 Cr 3,750,000 Jubilant Ingrevia Ltd Ordinary Shares (Basic Materials)
Equity, Since 31 Dec 22 | JUBLINGREA3% ₹483 Cr 7,000,000 LT Foods Ltd (Consumer Defensive)
Equity, Since 31 Dec 17 | 5327832% ₹421 Cr 10,000,000 Kirloskar Oil Engines Ltd (Industrials)
Equity, Since 31 Mar 23 | KIRLOSENG2% ₹400 Cr 4,000,000 Thangamayil Jewellery Ltd (Consumer Cyclical)
Equity, Since 30 Nov 21 | THANGAMAYL2% ₹364 Cr 1,677,908 Cyient Ltd (Industrials)
Equity, Since 30 Sep 21 | CYIENT2% ₹349 Cr 3,000,000 Techno Electric & Engineering Co Ltd (Industrials)
Equity, Since 31 Jan 19 | TECHNOE2% ₹330 Cr 2,500,000 8. Kotak Small Cap Fund
Kotak Small Cap Fund
Growth Launch Date 24 Feb 05 NAV (12 Dec 25) ₹249.893 ↑ 1.25 (0.50 %) Net Assets (Cr) ₹18,024 on 31 Oct 25 Category Equity - Small Cap AMC Kotak Mahindra Asset Management Co Ltd Rating ☆☆☆ Risk Moderately High Expense Ratio 1.66 Sharpe Ratio -0.46 Information Ratio -0.97 Alpha Ratio -5.17 Min Investment 5,000 Min SIP Investment 1,000 Exit Load 0-1 Years (1%),1 Years and above(NIL) Growth of 10,000 investment over the years.
Date Value 30 Nov 20 ₹10,000 30 Nov 21 ₹17,833 30 Nov 22 ₹17,870 30 Nov 23 ₹22,639 30 Nov 24 ₹29,878 30 Nov 25 ₹27,318 Returns for Kotak Small Cap Fund
absolute basis & more than 1 year are on CAGR (Compound Annual Growth Rate) basis. as on 12 Dec 25 Duration Returns 1 Month -2.9% 3 Month -4.7% 6 Month -4.3% 1 Year -11.6% 3 Year 14.6% 5 Year 21.3% 10 Year 15 Year Since launch 16.7% Historical performance (Yearly) on absolute basis
Year Returns 2024 25.5% 2023 34.8% 2022 -3.1% 2021 70.9% 2020 34.2% 2019 5% 2018 -17.3% 2017 44% 2016 8.9% 2015 7.4% Fund Manager information for Kotak Small Cap Fund
Name Since Tenure Harish Bihani 20 Oct 23 2.04 Yr. Data below for Kotak Small Cap Fund as on 31 Oct 25
Equity Sector Allocation
Sector Value Industrials 26.47% Health Care 23.68% Consumer Cyclical 20.08% Financial Services 9.15% Basic Materials 8.78% Real Estate 4.25% Consumer Defensive 2.47% Communication Services 2.09% Technology 1.7% Asset Allocation
Asset Class Value Cash 1.33% Equity 98.67% Top Securities Holdings / Portfolio
Name Holding Value Quantity Aster DM Healthcare Ltd Ordinary Shares (Healthcare)
Equity, Since 31 Jul 24 | ASTERDM4% ₹797 Cr 11,757,234 Krishna Institute of Medical Sciences Ltd (Healthcare)
Equity, Since 31 Dec 23 | 5433083% ₹610 Cr 8,454,118 Vijaya Diagnostic Centre Ltd (Healthcare)
Equity, Since 31 Mar 24 | 5433503% ₹536 Cr 5,422,493 Century Plyboards (India) Ltd (Basic Materials)
Equity, Since 31 Oct 18 | 5325483% ₹500 Cr 6,626,898 Techno Electric & Engineering Co Ltd (Industrials)
Equity, Since 31 Dec 18 | TECHNOE3% ₹480 Cr 3,642,296 Kalpataru Projects International Ltd (Industrials)
Equity, Since 31 Jan 23 | KPIL2% ₹449 Cr 3,572,133
↑ 100,000 Brigade Enterprises Ltd (Real Estate)
Equity, Since 31 Aug 24 | 5329292% ₹427 Cr 4,112,297 Sansera Engineering Ltd (Consumer Cyclical)
Equity, Since 30 Sep 21 | 5433582% ₹396 Cr 2,615,539 Cyient Ltd (Industrials)
Equity, Since 31 Dec 19 | CYIENT2% ₹385 Cr 3,311,236 Vishal Mega Mart Ltd (Consumer Cyclical)
Equity, Since 30 Jun 25 | VMM2% ₹373 Cr 25,804,976 9. Aditya Birla Sun Life Small Cap Fund
Aditya Birla Sun Life Small Cap Fund
Growth Launch Date 31 May 07 NAV (12 Dec 25) ₹85.0202 ↑ 0.86 (1.02 %) Net Assets (Cr) ₹5,127 on 31 Oct 25 Category Equity - Small Cap AMC Birla Sun Life Asset Management Co Ltd Rating ☆☆☆☆☆ Risk Moderately High Expense Ratio 1.89 Sharpe Ratio -0.25 Information Ratio 0 Alpha Ratio 0 Min Investment 1,000 Min SIP Investment 1,000 Exit Load 0-365 Days (1%),365 Days and above(NIL) Growth of 10,000 investment over the years.
Date Value 30 Nov 20 ₹10,000 30 Nov 21 ₹15,554 30 Nov 22 ₹15,303 30 Nov 23 ₹20,167 30 Nov 24 ₹25,674 30 Nov 25 ₹24,978 Returns for Aditya Birla Sun Life Small Cap Fund
absolute basis & more than 1 year are on CAGR (Compound Annual Growth Rate) basis. as on 12 Dec 25 Duration Returns 1 Month -3.1% 3 Month -0.4% 6 Month -0.6% 1 Year -6.8% 3 Year 16.7% 5 Year 19.3% 10 Year 15 Year Since launch 12.2% Historical performance (Yearly) on absolute basis
Year Returns 2024 21.5% 2023 39.4% 2022 -6.5% 2021 51.4% 2020 19.8% 2019 -11.5% 2018 -22.6% 2017 56.7% 2016 9.7% 2015 13.4% Fund Manager information for Aditya Birla Sun Life Small Cap Fund
Name Since Tenure Abhinav Khandelwal 31 Oct 24 1 Yr. Dhaval Joshi 21 Nov 22 2.95 Yr. Data below for Aditya Birla Sun Life Small Cap Fund as on 31 Oct 25
Equity Sector Allocation
Sector Value Financial Services 19.92% Industrials 17.97% Consumer Cyclical 16.2% Basic Materials 13.09% Health Care 12.82% Consumer Defensive 7.26% Real Estate 3.26% Technology 2.19% Utility 1.54% Asset Allocation
Asset Class Value Cash 5.75% Equity 94.25% Top Securities Holdings / Portfolio
Name Holding Value Quantity Navin Fluorine International Ltd (Basic Materials)
Equity, Since 31 Jul 20 | NAVINFLUOR3% ₹148 Cr 260,056 TD Power Systems Ltd (Industrials)
Equity, Since 30 Jun 23 | TDPOWERSYS2% ₹122 Cr 1,572,000
↓ -318,924 Multi Commodity Exchange of India Ltd (Financial Services)
Equity, Since 31 Dec 24 | MCX2% ₹119 Cr 128,200
↓ -18,000 Sai Life Sciences Ltd (Healthcare)
Equity, Since 30 Jun 25 | SAILIFE2% ₹113 Cr 1,225,785 SJS Enterprises Ltd (Consumer Cyclical)
Equity, Since 30 Nov 21 | 5433872% ₹105 Cr 648,153
↓ -25,000 Tega Industries Ltd (Industrials)
Equity, Since 31 Dec 21 | 5434132% ₹104 Cr 535,000 Krishna Institute of Medical Sciences Ltd (Healthcare)
Equity, Since 31 Dec 23 | 5433082% ₹94 Cr 1,301,548 CCL Products (India) Ltd (Consumer Defensive)
Equity, Since 31 May 20 | CCL2% ₹93 Cr 1,078,825 Karur Vysya Bank Ltd (Financial Services)
Equity, Since 30 Nov 24 | 5900032% ₹93 Cr 3,808,336
↑ 500,000 PNB Housing Finance Ltd (Financial Services)
Equity, Since 31 Aug 24 | PNBHOUSING2% ₹89 Cr 956,130 10. SBI Small Cap Fund
SBI Small Cap Fund
Growth Launch Date 9 Sep 09 NAV (12 Dec 25) ₹167.519 ↑ 0.73 (0.44 %) Net Assets (Cr) ₹36,945 on 31 Oct 25 Category Equity - Small Cap AMC SBI Funds Management Private Limited Rating ☆☆☆☆☆ Risk Moderately High Expense Ratio 1.58 Sharpe Ratio -0.45 Information Ratio 0 Alpha Ratio 0 Min Investment 5,000 Min SIP Investment 500 Exit Load 0-1 Years (1%),1 Years and above(NIL) Growth of 10,000 investment over the years.
Date Value 30 Nov 20 ₹10,000 30 Nov 21 ₹15,511 30 Nov 22 ₹17,347 30 Nov 23 ₹20,864 30 Nov 24 ₹26,684 30 Nov 25 ₹25,385 Returns for SBI Small Cap Fund
absolute basis & more than 1 year are on CAGR (Compound Annual Growth Rate) basis. as on 12 Dec 25 Duration Returns 1 Month -2.4% 3 Month -3.6% 6 Month -1.4% 1 Year -8.8% 3 Year 12.7% 5 Year 19.2% 10 Year 15 Year Since launch 18.9% Historical performance (Yearly) on absolute basis
Year Returns 2024 24.1% 2023 25.3% 2022 8.1% 2021 47.6% 2020 33.6% 2019 6.1% 2018 -19.6% 2017 78.7% 2016 1.3% 2015 20.6% Fund Manager information for SBI Small Cap Fund
Name Since Tenure R. Srinivasan 16 Nov 13 11.97 Yr. Data below for SBI Small Cap Fund as on 31 Oct 25
Equity Sector Allocation
Sector Value Industrials 25.63% Consumer Cyclical 21.28% Financial Services 13.64% Basic Materials 13.21% Consumer Defensive 3.89% Health Care 2.41% Communication Services 1.42% Real Estate 1.25% Technology 0.98% Utility 0.23% Asset Allocation
Asset Class Value Cash 13.68% Equity 83.93% Debt 2.39% Top Securities Holdings / Portfolio
Name Holding Value Quantity Ather Energy Ltd (Consumer Cyclical)
Equity, Since 30 Apr 25 | ATHERENERG4% ₹1,391 Cr 20,096,960 SBFC Finance Ltd (Financial Services)
Equity, Since 31 Aug 23 | SBFC3% ₹1,019 Cr 89,318,180 E I D Parry India Ltd (Basic Materials)
Equity, Since 31 Jan 24 | EIDPARRY3% ₹1,000 Cr 9,324,049 Kalpataru Projects International Ltd (Industrials)
Equity, Since 31 May 20 | KPIL3% ₹993 Cr 7,900,000 City Union Bank Ltd (Financial Services)
Equity, Since 30 Jun 20 | CUB3% ₹953 Cr 41,665,000 Chalet Hotels Ltd (Consumer Cyclical)
Equity, Since 31 Jan 19 | CHALET2% ₹923 Cr 9,716,991 Krishna Institute of Medical Sciences Ltd (Healthcare)
Equity, Since 30 Jun 23 | 5433082% ₹889 Cr 12,323,990 182 Day T-Bill 27.02.26
Sovereign Bonds | -2% ₹884 Cr 90,000,000 Navin Fluorine International Ltd (Basic Materials)
Equity, Since 31 Mar 20 | NAVINFLUOR2% ₹853 Cr 1,500,000 DOMS Industries Ltd (Industrials)
Equity, Since 31 Dec 23 | DOMS2% ₹849 Cr 3,300,000
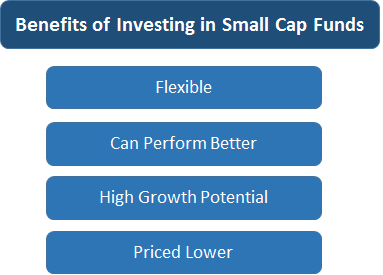
എന്തുകൊണ്ടാണ് നിങ്ങൾ സ്മോൾ ക്യാപ് ഫണ്ടുകളിൽ നിക്ഷേപിക്കേണ്ടത്?
ചിലനിക്ഷേപത്തിന്റെ നേട്ടങ്ങൾ ഒരു ചെറിയ ക്യാപ് ഫണ്ടിൽ ഇവയാണ്:
- ചെറിയ തൊപ്പികൾ വലിയ തൊപ്പികളേക്കാൾ കൂടുതൽ വഴക്കമുള്ളവയാണ്. ചെറിയ കമ്പനികൾക്ക് വലിയ കമ്പനികളേക്കാൾ വേഗത്തിൽ മാറ്റങ്ങൾ പൊരുത്തപ്പെടുത്താൻ കഴിയും, അതിനാൽ അവർക്ക് സ്ഫോടനാത്മകമായ വളർച്ച കാണിക്കാൻ കഴിയും
- ചില സമയങ്ങളിൽ,സ്മോൾ ക്യാപ് ഫണ്ടുകൾ എന്നതിനേക്കാൾ മികച്ച പ്രകടനം കാഴ്ചവയ്ക്കാൻ പ്രവണത കാണിക്കുന്നുവലിയ ക്യാപ് ഫണ്ടുകൾ, എന്നാൽ അവയുടെ അസ്ഥിരത വളരെ കൂടുതലായിരിക്കും
- വികസനത്തിന്റെ പ്രാരംഭ ഘട്ടത്തിലുള്ള കമ്പനികളാണിവ എന്നതിനാൽ, അവയ്ക്ക് അതിവേഗം വളരാൻ കഴിയും
- സ്മോൾ ക്യാപ് സ്റ്റോക്കുകൾക്ക് മിഡ് ക്യാപ്, ലാർജ് ക്യാപ് സ്റ്റോക്കുകളേക്കാൾ വില കുറവാണ്
- ഉയർന്ന റിസ്കിനൊപ്പം ഉയർന്ന വരുമാനം നേടാനുള്ള സാധ്യതയും വരുന്നു
സ്മോൾ ക്യാപ് മ്യൂച്വൽ ഫണ്ടുകളിൽ ആർ നിക്ഷേപിക്കണം
സ്മോൾ ക്യാപ് ഫണ്ടുകൾ സ്മോൾ ക്യാപ് സ്റ്റോക്കുകളിലും സ്റ്റാർട്ടപ്പുകൾ പോലുള്ള ചെറുകിട കമ്പനികളിലും നിക്ഷേപിക്കുന്നതിനാൽ, ഭാവിയിലെ വളർച്ചയ്ക്ക് അവയ്ക്ക് വലിയ സാധ്യതയുണ്ട്. പക്ഷേ, ചെറിയ തൊപ്പികളുടെ വരുമാനം ഉയർന്ന ചാഞ്ചാട്ടത്തിന് വിധേയമാകുന്നു എന്നതാണ് വസ്തുത. അങ്ങനെ, സ്മോൾ ക്യാപ് സ്റ്റോക്കുകളിൽ ചിലത് നിങ്ങളുടെ സമ്പത്ത് നശിപ്പിക്കും. എന്നിരുന്നാലും, മറുവശത്ത്, സ്മോൾ ക്യാപ്സിന് ഭാവിയിൽ നിങ്ങളുടെ നിക്ഷേപം ഇരട്ടിയാക്കാനും കഴിയും.
കമ്പനികളുടെ സ്വഭാവം കാരണം, വളർന്നുവരുന്ന വിപണിയിൽ ചെറിയ ക്യാപ്സിന് മികച്ച പ്രകടനം കാഴ്ചവയ്ക്കാൻ കഴിയുംമോശം പ്രകടനം ഒരു തകർച്ച സമയത്ത്. അതിനാൽ, നിക്ഷേപത്തിൽ ഉയർന്ന തോതിലുള്ള റിസ്ക് വഹിക്കാൻ കഴിയുന്ന നിക്ഷേപകർ മാത്രം പരിഗണിക്കുകനിക്ഷേപിക്കുന്നു സ്മോൾ ക്യാപ് ഫണ്ടുകളിൽ. മോശം വിപണി ഘട്ടത്തിൽ നിങ്ങൾക്ക് തകർച്ച സഹിക്കാൻ കഴിയണം. അത്തരം ഉയർന്ന അപകടസാധ്യതയുള്ള ഫണ്ടുകളിൽ നിക്ഷേപിക്കാൻ നിങ്ങൾ പദ്ധതിയിടുകയാണെങ്കിൽ, നിങ്ങളുടെ നിക്ഷേപങ്ങൾ ദീർഘകാലത്തേക്ക് ആസൂത്രണം ചെയ്യാൻ നിർദ്ദേശിക്കുന്നു, അതായത്, ഏകദേശം അഞ്ച് വർഷത്തിൽ കൂടുതൽ. നിങ്ങൾ ഇക്വിറ്റി മാർക്കറ്റിൽ എത്രത്തോളം നിക്ഷേപിക്കുന്നുവോ, നല്ല ലാഭം നേടാനുള്ള സാധ്യത കൂടുതലാണ്.
സ്മോൾ ക്യാപ് ഫണ്ടുകളിൽ ഓൺലൈനിൽ എങ്ങനെ നിക്ഷേപിക്കാം?
Fincash.com-ൽ ആജീവനാന്ത സൗജന്യ നിക്ഷേപ അക്കൗണ്ട് തുറക്കുക.
നിങ്ങളുടെ രജിസ്ട്രേഷനും KYC പ്രക്രിയയും പൂർത്തിയാക്കുക
രേഖകൾ അപ്ലോഡ് ചെയ്യുക (പാൻ, ആധാർ മുതലായവ).കൂടാതെ, നിങ്ങൾ നിക്ഷേപിക്കാൻ തയ്യാറാണ്!
മികച്ച സ്മോൾ ക്യാപ് ഇക്വിറ്റി ഫണ്ടുകളിൽ നിക്ഷേപിക്കുന്നതിനുള്ള നുറുങ്ങുകൾ
സ്മോൾ ക്യാപ് ഫണ്ടുകളിൽ നിക്ഷേപിക്കാൻ പദ്ധതിയിടുമ്പോൾ, നിക്ഷേപത്തിലേക്ക് കടക്കുന്നതിന് മുമ്പ് നിങ്ങൾ കണക്കിലെടുക്കേണ്ട ചില പ്രധാന പാരാമീറ്ററുകൾ ഇതാ.
മുൻകാല പ്രകടനങ്ങൾ വിലയിരുത്തുക
നിങ്ങൾ ഒരു മ്യൂച്വൽ ഫണ്ട് സ്കീമിൽ നിക്ഷേപിക്കാൻ പദ്ധതിയിടുമ്പോഴെല്ലാം, ഫണ്ടിന്റെ മുൻകാല പ്രകടനങ്ങൾ നിങ്ങൾ നന്നായി വിലയിരുത്തണം. കഴിഞ്ഞ അഞ്ച് വർഷത്തെ റിട്ടേണുകൾ എടുത്ത് മറ്റ് നല്ല ഫണ്ടുകളുമായി താരതമ്യം ചെയ്യാൻ ശ്രമിക്കുക. എല്ലാ വിപണി സാഹചര്യങ്ങളിലും ഒരു ഫണ്ട് അതിന്റെ പ്രകടനങ്ങളിൽ സ്ഥിരത പുലർത്തണം. കൂടാതെ, ഫണ്ടിന് അതിന്റെ മാനദണ്ഡം മറികടക്കാൻ കഴിയുമോ ഇല്ലയോ എന്ന് പരിശോധിക്കുക.
പദ്ധതി ഗുണമേന്മയുള്ള ഫണ്ട് ഹൗസിന്റേതായിരിക്കണം
നിങ്ങൾ നിക്ഷേപിക്കാൻ ആഗ്രഹിക്കുന്ന ഫണ്ട് ഹൗസിന്റെ ഗുണനിലവാരവും പ്രശസ്തിയും പരിശോധിക്കാൻ എപ്പോഴും നിർദ്ദേശിക്കപ്പെടുന്നു. ദീർഘകാല റെക്കോർഡുള്ള ഒരു ഫണ്ട് ഹൗസ്, മാനേജ്മെന്റിന് കീഴിലുള്ള വലിയ ആസ്തികൾ, സ്റ്റാർ ഫണ്ടുകൾ അല്ലെങ്കിൽ നല്ല പെർഫോമിംഗ് ഫണ്ട് മുതലായവ. നിക്ഷേപിക്കാൻ. സ്ഥിരമായ ട്രാക്ക് റെക്കോർഡ് ഉള്ള സാമ്പത്തിക വ്യവസായത്തിൽ ശക്തമായ സാന്നിധ്യമുള്ള ഫണ്ട് ഹൗസിന് മികച്ച മുൻഗണന നൽകണം.
ഫണ്ട് മാനേജരുടെ അനുഭവം പരിശോധിക്കുക
ഒരു മ്യൂച്വൽ ഫണ്ട് സ്കീമിന്റെ പ്രകടനത്തിന്റെ ക്രെഡിറ്റ് ഫണ്ട് മാനേജർക്കാണ്. ഫണ്ടിന്റെ പോർട്ട്ഫോളിയോയ്ക്കായി നിക്ഷേപ തീരുമാനങ്ങൾ എടുക്കുന്നതിന് ഒരു ഫണ്ട് മാനേജർ ഉത്തരവാദിയാണ്. അതിനാൽ, നിക്ഷേപകർ പ്രത്യേക ഫണ്ട് മാനേജർ കൈകാര്യം ചെയ്യുന്ന ഫണ്ടുകളുടെ പ്രകടനത്തിലൂടെ കടന്നുപോകണം, പ്രത്യേകിച്ച് കഠിനമായ വിപണി ഘട്ടങ്ങളിൽ. ഫണ്ട് മാനേജർ തന്റെ കരിയറിൽ സ്ഥിരത പുലർത്തുന്ന ഒരു ഫണ്ട് മാനേജരെ സമീപിക്കുന്നത് തിരഞ്ഞെടുക്കുന്നതാണ്.
ഇവിടെ നൽകിയിരിക്കുന്ന വിവരങ്ങൾ കൃത്യമാണെന്ന് ഉറപ്പാക്കാൻ എല്ലാ ശ്രമങ്ങളും നടത്തിയിട്ടുണ്ട്. എന്നിരുന്നാലും, ഡാറ്റയുടെ കൃത്യത സംബന്ധിച്ച് യാതൊരു ഉറപ്പും നൽകുന്നില്ല. എന്തെങ്കിലും നിക്ഷേപം നടത്തുന്നതിന് മുമ്പ് സ്കീം വിവര രേഖ ഉപയോഗിച്ച് പരിശോധിക്കുക.


AMFI Registration No. 112358 | CIN: U74999MH2016PTC282153
Shepard Technologies Pvt. Ltd. (with ARN code 112358) makes no warranties or representations, express or implied, on products offered through the platform. It accepts no liability for any damages or losses, however caused, in connection with the use of, or on the reliance of its product or related services. Terms and conditions of the website are applicable.
©2025 Shepard Technologies Private Limited. All Rights Reserved
Good n nice
I believe SBI small cap fund is the best to get good returns in long run.