 +91-22-48913909
Table of Contents
- നിങ്ങൾ എന്തിന് മിഡ് ക്യാപ് ഫണ്ടുകളിൽ നിക്ഷേപിക്കണം
- മിഡ്ക്യാപ് ഫണ്ടുകളുടെ പ്രയോജനങ്ങൾ
- 22-23 സാമ്പത്തിക വർഷത്തിൽ നിക്ഷേപിക്കുന്നതിനുള്ള മികച്ച 11 മികച്ച മിഡ് ക്യാപ് മ്യൂച്വൽ ഫണ്ടുകൾ
- മിഡ്-ക്യാപ് ഫണ്ടുകൾ തിരഞ്ഞെടുക്കുമ്പോൾ ശ്രദ്ധിക്കേണ്ട പാരാമീറ്ററുകൾ
- മിഡ് ക്യാപ് ഫണ്ടുകളിൽ ഓൺലൈനിൽ നിക്ഷേപിക്കുന്നത് എങ്ങനെ?
- ഉപസംഹാരം
Top 11 Equity - Mid Cap Funds
മികച്ച മിഡ് ക്യാപ് മ്യൂച്വൽ ഫണ്ടുകൾ 2022
മികച്ച മിഡ് ക്യാപ്പിനായി തിരയുന്നുമ്യൂച്വൽ ഫണ്ടുകൾ 2022 ൽ നിക്ഷേപിക്കണോ? ശരി, പല നിക്ഷേപകരും ഇതിലേക്ക് ചായുന്നുനിക്ഷേപിക്കുന്നു മിഡ് ക്യാപ്സിൽ, കാരണം അവ ഭാവിയായി കണക്കാക്കപ്പെടുന്നുവിപണി നേതാക്കൾ. എപ്പോൾ ഒരുനിക്ഷേപകൻ ദീർഘകാലത്തേക്ക് മിഡ് ക്യാപ്സിൽ നിക്ഷേപിക്കുന്നു, നാളത്തെ റൺവേ വിജയങ്ങളാണെന്ന് അവർ കരുതുന്ന കമ്പനികളെയാണ് അവർ ഇഷ്ടപ്പെടുന്നത്.
പരമ്പരാഗതമായി, മിഡ്-ക്യാപ്പുകൾ സാധാരണയായി ഇടത്തരം കമ്പനികളാണ്, അവ നന്നായി പ്രവർത്തിക്കുകയും നല്ല ബിസിനസ്സ് തന്ത്രം ഉണ്ടെങ്കിൽ നാളത്തെ നേതാക്കളോ വലിയ ക്യാപ്സോ ആയി മാറുകയും ചെയ്യുന്നു (ചില രാജ്യങ്ങൾ പോലും.വിളി അവ ഭീമൻ തൊപ്പികൾ).
ശരിയായ ബിസിനസ്സ് തന്ത്രം, നിർവ്വഹണത്തിനുള്ള നല്ല മാനേജ്മെന്റ്, മാറ്റങ്ങളോട് മിടുക്ക് എന്നിവ ഉപയോഗിച്ച് മിഡ്-ക്യാപ് കമ്പനികൾ അതിവേഗം വളരും. ലാർജ് ക്യാപ്പുകളേക്കാൾ ഉയർന്ന നേട്ടം കൊയ്യാൻ ആഗ്രഹിക്കുന്ന നിക്ഷേപകർ മിഡ് ക്യാപ്സിലേക്ക് നിക്ഷേപത്തിനായി നോക്കുന്നു, എന്നിരുന്നാലും ഇത് ഉയർന്ന റിസ്ക് (അല്ലെങ്കിൽ അസ്ഥിരത) കൊണ്ട് വരുന്നു.
മ്യൂച്വൽ ഫണ്ടുകളും ഫോറിൻ ഇൻസ്റ്റിറ്റ്യൂഷണൽ ഇൻവെസ്റ്റേഴ്സും (എഫ്ഐഐ) പോലുള്ള സ്ഥാപന നിക്ഷേപകർ ടോപ്പ് മിഡ് ക്യാപ്സിലും,മിഡ് ക്യാപ് ഫണ്ടുകൾ ഇക്വിറ്റി മാർക്കറ്റുകളിൽ അവരുടെ നേട്ടങ്ങൾ വർദ്ധിപ്പിക്കുന്നതിന്.
നിങ്ങൾ എന്തിന് മിഡ് ക്യാപ് ഫണ്ടുകളിൽ നിക്ഷേപിക്കണം
ചിലനിക്ഷേപത്തിന്റെ നേട്ടങ്ങൾ മിഡ് ക്യാപ് ഫണ്ടുകളിൽ ഇവയാണ്:
- ദീർഘകാല ഹോൾഡിംഗ് നൽകിയിട്ടുള്ള വലിയ തൊപ്പികളുമായി താരതമ്യപ്പെടുത്തുമ്പോൾ അവർക്ക് ശക്തമായ സമ്പത്ത് വഹിക്കാനുള്ള ശേഷിയുണ്ട്; ബുള്ളിഷ് മാർക്കറ്റുകളിലും വിപണികൾ വളരെക്കാലമായി ഉയർച്ചയിലായിരിക്കുമ്പോഴും അവ സാധാരണയായി രണ്ടാമത്തേതിനേക്കാൾ മികച്ച പ്രകടനം കാഴ്ചവയ്ക്കുന്നു.
- മിഡ് ക്യാപ് കമ്പനികൾക്ക് ലാർജ് ക്യാപ്സിനേക്കാൾ വളർച്ചയ്ക്ക് കൂടുതൽ സാധ്യതയുണ്ട്.
- അത്തരം സ്ഥാപനങ്ങൾ വിപണിയിലെ പുതിയ കണ്ടുപിടിത്തങ്ങളോടും മാറ്റങ്ങളോടും വേഗത്തിൽ പ്രതികരിക്കുന്നു, കാരണം അവർ കൂടുതൽ ശ്രദ്ധ കേന്ദ്രീകരിക്കുകയും അവരുടെ ഇടത്തിൽ പ്രത്യേകം ശ്രദ്ധിക്കുകയും വേഗതയേറിയ പാദങ്ങളുള്ളവരുമാണ്.
- മിഡ് ക്യാപ് ഓഹരികൾ ചാഞ്ചാട്ടത്തിൽ കുറവാണ്ചെറിയ തൊപ്പി ഓഹരികൾ.
- വേഗത്തിൽ വളരാനുള്ള അവരുടെ കഴിവ് കാരണം, അവ പലപ്പോഴും മികച്ച പ്രകടനം കാഴ്ചവയ്ക്കുന്നുവലിയ ക്യാപ് ഫണ്ടുകൾ ഒരു നീണ്ട കാലയളവിൽ.
Talk to our investment specialist
മിഡ്ക്യാപ് ഫണ്ടുകളുടെ പ്രയോജനങ്ങൾ
നമ്മൾ ദീർഘകാലത്തേക്ക് പരിഗണിക്കുകയാണെങ്കിൽമ്യൂച്വൽ ഫണ്ടുകളുടെ ചരിത്രം, പിന്നീട് മിഡ്-ക്യാപ് ഫണ്ടുകൾ സ്ഥിരമായി വലിയ ക്യാപ് ഫണ്ടുകളെ മറികടക്കുന്നു. വാസ്തവത്തിൽ, ഫണ്ടിന്റെ സ്വഭാവം തന്നെ അതിന്റെ പ്രവണത ഉടൻ മാറാൻ സാധ്യതയില്ല എന്നതാണ്.
വലിയ ക്യാപ് ഫണ്ടുകളുമായി താരതമ്യപ്പെടുത്തുമ്പോൾ മിഡ് ക്യാപ് ഫണ്ടുകൾ സ്റ്റോക്ക് മാർക്കറ്റുകളിൽ താരതമ്യേന കുറവാണ്. ഈ ഫണ്ടുകൾ ഉപയോഗിച്ച് നിക്ഷേപകർക്ക് അവരുടെ നിക്ഷേപങ്ങളിൽ അതിവേഗ വളർച്ച നേടാനുള്ള വലിയ അവസരം ഇത് നൽകുന്നു.
22-23 സാമ്പത്തിക വർഷത്തിൽ നിക്ഷേപിക്കുന്നതിനുള്ള മികച്ച 11 മികച്ച മിഡ് ക്യാപ് മ്യൂച്വൽ ഫണ്ടുകൾ
Fund NAV Net Assets (Cr) 3 MO (%) 6 MO (%) 1 YR (%) 3 YR (%) 5 YR (%) 2024 (%) Motilal Oswal Midcap 30 Fund Growth ₹88.6047
↓ -0.24 ₹24,488 -22.2 -17 18.1 27.5 29 57.1 Edelweiss Mid Cap Fund Growth ₹83.714
↓ -0.33 ₹8,268 -18.8 -16.6 14.5 20.8 28 38.9 SBI Magnum Mid Cap Fund Growth ₹208.897
↓ -1.01 ₹21,177 -13.4 -15.4 9.3 16.7 26.4 20.3 PGIM India Midcap Opportunities Fund Growth ₹54.9
↓ -0.18 ₹10,460 -16.3 -16.7 7.2 10.7 26.2 21 ICICI Prudential MidCap Fund Growth ₹242.64
↓ -2.69 ₹5,975 -18.2 -18.6 6.3 17.2 25 27 Kotak Emerging Equity Scheme Growth ₹110.691
↓ -0.51 ₹49,092 -19 -18.6 12.1 17.4 24.9 33.6 Invesco India Mid Cap Fund Growth ₹142.37
↓ -0.84 ₹5,645 -18.7 -16.1 17.2 20.3 24.3 43.1 BNP Paribas Mid Cap Fund Growth ₹87.3995
↓ -0.57 ₹2,046 -15.6 -17.7 8.1 16.1 24.2 28.5 TATA Mid Cap Growth Fund Growth ₹366.383
↓ -1.79 ₹4,354 -16 -19.6 6.3 16.5 22.9 22.7 Sundaram Mid Cap Fund Growth ₹1,152.09
↓ -6.45 ₹11,638 -18.2 -18.6 9.2 19.7 22.8 32 Franklin India Prima Fund Growth ₹2,356.46
↓ -16.26 ₹11,656 -16.6 -16.4 13.1 19.6 22.7 31.8 Note: Returns up to 1 year are on absolute basis & more than 1 year are on CAGR basis. as on 13 Mar 25
*മുകളിലുള്ളവരുടെ പട്ടികമിഡ് ക്യാപ് മിനിമം ഉള്ള മ്യൂച്വൽ ഫണ്ടുകൾ200 കോടി അറ്റ ആസ്തികൾ / മാനേജ്മെന്റിന് കീഴിലുള്ള അസറ്റുകൾ (AUM), ക്രമീകരിച്ചത്5 വർഷംസിഎജിആർ മടങ്ങുക.
(Erstwhile Motilal Oswal MOSt Focused Midcap 30 Fund) The investment objective of the Scheme is to achieve long term capital appreciation by investing in a maximum of 30 quality mid-cap companies having long-term competitive advantages and potential for growth. However, there can be no assurance or guarantee that the investment objective of the Scheme would be achieved. Motilal Oswal Midcap 30 Fund is a Equity - Mid Cap fund was launched on 24 Feb 14. It is a fund with Moderately High risk and has given a Below is the key information for Motilal Oswal Midcap 30 Fund Returns up to 1 year are on (Erstwhile Edelweiss Mid and Small Cap Fund ) The investment objective is to seek to generate long-term capital appreciation from a portfolio that predominantly invests in equity and equity-related securities of Mid Cap companies.
However, there can be no assurance that the investment objective of the Scheme will be realised. Edelweiss Mid Cap Fund is a Equity - Mid Cap fund was launched on 26 Dec 07. It is a fund with High risk and has given a Below is the key information for Edelweiss Mid Cap Fund Returns up to 1 year are on To provide investors with opportunities for long-term growth in capital along with the liquidity of an open-ended scheme by investing predominantly in a well diversified basket of equity stocks of Midcap companies. SBI Magnum Mid Cap Fund is a Equity - Mid Cap fund was launched on 29 Mar 05. It is a fund with Moderately High risk and has given a Below is the key information for SBI Magnum Mid Cap Fund Returns up to 1 year are on The primary objective of the Scheme is to achieve long-term capital appreciation by predominantly investing in equity & equity related instruments of mid cap companies. However, there is no assurance that the investment objective of the Scheme will be realized. PGIM India Midcap Opportunities Fund is a Equity - Mid Cap fund was launched on 2 Dec 13. It is a fund with High risk and has given a Below is the key information for PGIM India Midcap Opportunities Fund Returns up to 1 year are on To generate capital appreciation by actively investing in diversified mid cap stocks. ICICI Prudential MidCap Fund is a Equity - Mid Cap fund was launched on 28 Oct 04. It is a fund with Moderately High risk and has given a Below is the key information for ICICI Prudential MidCap Fund Returns up to 1 year are on The investment objective of the scheme is to generate long-term capital appreciation from a portfolio of equity and equity related securities, by investing predominantly in mid and small cap companies. Kotak Emerging Equity Scheme is a Equity - Mid Cap fund was launched on 30 Mar 07. It is a fund with Moderately High risk and has given a Below is the key information for Kotak Emerging Equity Scheme Returns up to 1 year are on The Scheme seeks to provide long term capital appreciation by investing in a portfolio that is predominantly constituted of equity and equity related instruments of mid cap companies. However, there can be no assurance that the funds objectives will be achieved. Invesco India Mid Cap Fund is a Equity - Mid Cap fund was launched on 19 Apr 07. It is a fund with Moderately High risk and has given a Below is the key information for Invesco India Mid Cap Fund Returns up to 1 year are on The Investment objective of the scheme is to seek to generate long-term capital appreciation by investing primarily in companies with high growth opportunities in
the middle and small capitalization segment, defi ned as ‘Future Leaders’. The fund will emphasize on companies that appear to offer opportunities for long-term growth and will be inclined towards companies that are driven by dynamic style of management and entrepreneurial fl air. However, there can be no assurance that the investment objectives of the Scheme will be realized. The Scheme does not guarantee/indicate any returns. BNP Paribas Mid Cap Fund is a Equity - Mid Cap fund was launched on 2 May 06. It is a fund with High risk and has given a Below is the key information for BNP Paribas Mid Cap Fund Returns up to 1 year are on To provide income distribution and / or medium to long term capital gains. Investments would be focused towards mid-cap stocks. TATA Mid Cap Growth Fund is a Equity - Mid Cap fund was launched on 1 Jul 94. It is a fund with Moderately High risk and has given a Below is the key information for TATA Mid Cap Growth Fund Returns up to 1 year are on (Erstwhile Sundaram Select Midcap Fund) To achieve capital appreciation by investing
in diversified stocks that are generally termed
as mid-caps. Sundaram Mid Cap Fund is a Equity - Mid Cap fund was launched on 30 Jul 02. It is a fund with Moderately High risk and has given a Below is the key information for Sundaram Mid Cap Fund Returns up to 1 year are on The investment objective of Prima Fund is to provide medium to longterm capital appreciation as a primary objective and income as a secondary objective. Franklin India Prima Fund is a Equity - Mid Cap fund was launched on 1 Dec 93. It is a fund with Moderately High risk and has given a Below is the key information for Franklin India Prima Fund Returns up to 1 year are on 1. Motilal Oswal Midcap 30 Fund
CAGR/Annualized return of 21.8% since its launch. Ranked 27 in Mid Cap category. Return for 2024 was 57.1% , 2023 was 41.7% and 2022 was 10.7% . Motilal Oswal Midcap 30 Fund
Growth Launch Date 24 Feb 14 NAV (13 Mar 25) ₹88.6047 ↓ -0.24 (-0.27 %) Net Assets (Cr) ₹24,488 on 31 Jan 25 Category Equity - Mid Cap AMC Motilal Oswal Asset Management Co. Ltd Rating ☆☆☆ Risk Moderately High Expense Ratio 0.66 Sharpe Ratio 0.93 Information Ratio 0.68 Alpha Ratio 15.2 Min Investment 5,000 Min SIP Investment 500 Exit Load 0-1 Years (1%),1 Years and above(NIL) Growth of 10,000 investment over the years.
Date Value 29 Feb 20 ₹10,000 28 Feb 21 ₹11,725 28 Feb 22 ₹15,686 28 Feb 23 ₹18,295 29 Feb 24 ₹27,817 28 Feb 25 ₹32,165 Returns for Motilal Oswal Midcap 30 Fund
absolute basis & more than 1 year are on CAGR (Compound Annual Growth Rate) basis. as on 13 Mar 25 Duration Returns 1 Month -4.9% 3 Month -22.2% 6 Month -17% 1 Year 18.1% 3 Year 27.5% 5 Year 29% 10 Year 15 Year Since launch 21.8% Historical performance (Yearly) on absolute basis
Year Returns 2024 57.1% 2023 41.7% 2022 10.7% 2021 55.8% 2020 9.3% 2019 9.7% 2018 -12.7% 2017 30.8% 2016 5.2% 2015 16.5% Fund Manager information for Motilal Oswal Midcap 30 Fund
Name Since Tenure Ajay Khandelwal 1 Oct 24 0.41 Yr. Niket Shah 1 Jul 20 4.67 Yr. Rakesh Shetty 22 Nov 22 2.27 Yr. Sunil Sawant 1 Jul 24 0.67 Yr. Data below for Motilal Oswal Midcap 30 Fund as on 31 Jan 25
Equity Sector Allocation
Sector Value Technology 34.2% Consumer Cyclical 16.45% Industrials 14.08% Health Care 4.4% Communication Services 3.36% Utility 2.23% Real Estate 1.95% Financial Services 1.73% Asset Allocation
Asset Class Value Cash 24.38% Equity 75.62% Top Securities Holdings / Portfolio
Name Holding Value Quantity Persistent Systems Ltd (Technology)
Equity, Since 31 Jan 23 | PERSISTENT10% ₹2,413 Cr 4,000,000
↑ 750,000 Coforge Ltd (Technology)
Equity, Since 31 Mar 23 | COFORGE10% ₹2,355 Cr 2,850,000
↑ 155,000 Kalyan Jewellers India Ltd (Consumer Cyclical)
Equity, Since 29 Feb 24 | KALYANKJIL7% ₹1,761 Cr 35,000,100
↑ 1,750,100 Trent Ltd (Consumer Cyclical)
Equity, Since 30 Nov 24 | 5002516% ₹1,507 Cr 2,620,200
↓ -379,800 Dixon Technologies (India) Ltd (Technology)
Equity, Since 31 Mar 23 | DIXON6% ₹1,499 Cr 1,000,000
↑ 700,130 Polycab India Ltd (Industrials)
Equity, Since 30 Sep 23 | POLYCAB5% ₹1,117 Cr 1,850,000
↓ -1,400,000 Max Healthcare Institute Ltd Ordinary Shares (Healthcare)
Equity, Since 31 Mar 24 | MAXHEALTH3% ₹855 Cr 8,056,130
↑ 556,130 Bharti Hexacom Ltd (Communication Services)
Equity, Since 31 Oct 24 | BHARTIHEXA3% ₹823 Cr 6,075,571
↑ 816,804 One97 Communications Ltd (Technology)
Equity, Since 30 Sep 24 | 5433963% ₹776 Cr 10,001,000
↑ 1,000 Oracle Financial Services Software Ltd (Technology)
Equity, Since 31 Dec 24 | OFSS3% ₹699 Cr 766,376
↓ -30,591 2. Edelweiss Mid Cap Fund
CAGR/Annualized return of 13.1% since its launch. Ranked 22 in Mid Cap category. Return for 2024 was 38.9% , 2023 was 38.4% and 2022 was 2.4% . Edelweiss Mid Cap Fund
Growth Launch Date 26 Dec 07 NAV (13 Mar 25) ₹83.714 ↓ -0.33 (-0.39 %) Net Assets (Cr) ₹8,268 on 31 Jan 25 Category Equity - Mid Cap AMC Edelweiss Asset Management Limited Rating ☆☆☆ Risk High Expense Ratio 1.86 Sharpe Ratio 0.87 Information Ratio 0.3 Alpha Ratio 8.97 Min Investment 5,000 Min SIP Investment 500 Exit Load 0-12 Months (1%),12 Months and above(NIL) Growth of 10,000 investment over the years.
Date Value 29 Feb 20 ₹10,000 28 Feb 21 ₹14,133 28 Feb 22 ₹17,305 28 Feb 23 ₹18,450 29 Feb 24 ₹27,871 28 Feb 25 ₹30,097 Returns for Edelweiss Mid Cap Fund
absolute basis & more than 1 year are on CAGR (Compound Annual Growth Rate) basis. as on 13 Mar 25 Duration Returns 1 Month -4.4% 3 Month -18.8% 6 Month -16.6% 1 Year 14.5% 3 Year 20.8% 5 Year 28% 10 Year 15 Year Since launch 13.1% Historical performance (Yearly) on absolute basis
Year Returns 2024 38.9% 2023 38.4% 2022 2.4% 2021 50.3% 2020 26.4% 2019 5.2% 2018 -15.7% 2017 52.3% 2016 2.5% 2015 9.4% Fund Manager information for Edelweiss Mid Cap Fund
Name Since Tenure Dhruv Bhatia 14 Oct 24 0.38 Yr. Trideep Bhattacharya 1 Oct 21 3.41 Yr. Raj Koradia 1 Aug 24 0.58 Yr. Data below for Edelweiss Mid Cap Fund as on 31 Jan 25
Equity Sector Allocation
Sector Value Financial Services 20.96% Consumer Cyclical 16.5% Industrials 14.68% Health Care 12.6% Technology 11.89% Basic Materials 7.86% Consumer Defensive 4.99% Real Estate 3.84% Communication Services 1.79% Energy 1.35% Asset Allocation
Asset Class Value Cash 3.54% Equity 96.46% Top Securities Holdings / Portfolio
Name Holding Value Quantity Dixon Technologies (India) Ltd (Technology)
Equity, Since 31 Jan 20 | DIXON4% ₹322 Cr 214,550
↑ 3,802 Persistent Systems Ltd (Technology)
Equity, Since 31 Mar 21 | PERSISTENT3% ₹283 Cr 468,879
↓ -102,975 Max Healthcare Institute Ltd Ordinary Shares (Healthcare)
Equity, Since 31 Jul 21 | MAXHEALTH3% ₹261 Cr 2,461,020
↑ 1,351,437 Indian Hotels Co Ltd (Consumer Cyclical)
Equity, Since 30 Sep 23 | 5008503% ₹244 Cr 3,185,298
↑ 680,114 Lupin Ltd (Healthcare)
Equity, Since 31 Jul 24 | 5002573% ₹237 Cr 1,140,343
↑ 27,563 Marico Ltd (Consumer Defensive)
Equity, Since 31 Oct 24 | 5316423% ₹223 Cr 3,318,848
↑ 1,715,413 Coforge Ltd (Technology)
Equity, Since 30 Jun 23 | COFORGE3% ₹221 Cr 267,153
↑ 6,457 PB Fintech Ltd (Financial Services)
Equity, Since 29 Feb 24 | 5433903% ₹213 Cr 1,231,780
↑ 29,774 Solar Industries India Ltd (Basic Materials)
Equity, Since 30 Sep 12 | SOLARINDS2% ₹196 Cr 192,679
↑ 4,656 UNO Minda Ltd (Consumer Cyclical)
Equity, Since 31 Aug 17 | UNOMINDA2% ₹176 Cr 1,859,803
↑ 249,595 3. SBI Magnum Mid Cap Fund
CAGR/Annualized return of 16.5% since its launch. Ranked 28 in Mid Cap category. Return for 2024 was 20.3% , 2023 was 34.5% and 2022 was 3% . SBI Magnum Mid Cap Fund
Growth Launch Date 29 Mar 05 NAV (13 Mar 25) ₹208.897 ↓ -1.01 (-0.48 %) Net Assets (Cr) ₹21,177 on 31 Jan 25 Category Equity - Mid Cap AMC SBI Funds Management Private Limited Rating ☆☆☆ Risk Moderately High Expense Ratio 1.77 Sharpe Ratio 0.61 Information Ratio -0.62 Alpha Ratio 3.49 Min Investment 5,000 Min SIP Investment 500 Exit Load 0-1 Years (1%),1 Years and above(NIL) Growth of 10,000 investment over the years.
Date Value 29 Feb 20 ₹10,000 28 Feb 21 ₹14,514 28 Feb 22 ₹18,207 28 Feb 23 ₹19,884 29 Feb 24 ₹27,325 28 Feb 25 ₹28,044 Returns for SBI Magnum Mid Cap Fund
absolute basis & more than 1 year are on CAGR (Compound Annual Growth Rate) basis. as on 13 Mar 25 Duration Returns 1 Month -2.9% 3 Month -13.4% 6 Month -15.4% 1 Year 9.3% 3 Year 16.7% 5 Year 26.4% 10 Year 15 Year Since launch 16.5% Historical performance (Yearly) on absolute basis
Year Returns 2024 20.3% 2023 34.5% 2022 3% 2021 52.2% 2020 30.4% 2019 0.1% 2018 -18% 2017 33.5% 2016 5% 2015 14.9% Fund Manager information for SBI Magnum Mid Cap Fund
Name Since Tenure Bhavin Vithlani 1 Apr 24 0.92 Yr. Pradeep Kesavan 1 Apr 24 0.92 Yr. Data below for SBI Magnum Mid Cap Fund as on 31 Jan 25
Equity Sector Allocation
Sector Value Consumer Cyclical 20.98% Financial Services 19.45% Industrials 14.27% Health Care 13.18% Basic Materials 9.26% Technology 4.32% Real Estate 3.5% Utility 3.25% Consumer Defensive 2.35% Communication Services 1.64% Energy 1.27% Asset Allocation
Asset Class Value Cash 6.39% Equity 93.47% Debt 0.14% Top Securities Holdings / Portfolio
Name Holding Value Quantity CRISIL Ltd (Financial Services)
Equity, Since 30 Apr 21 | CRISIL4% ₹869 Cr 1,600,000 Sundaram Finance Ltd (Financial Services)
Equity, Since 30 Sep 22 | SUNDARMFIN3% ₹688 Cr 1,490,000 Torrent Power Ltd (Utilities)
Equity, Since 30 Jun 19 | 5327793% ₹688 Cr 4,700,000 Bajaj Finance Ltd (Financial Services)
Equity, Since 31 Dec 23 | 5000343% ₹631 Cr 800,000 Max Healthcare Institute Ltd Ordinary Shares (Healthcare)
Equity, Since 30 Sep 21 | MAXHEALTH3% ₹584 Cr 5,500,000 Mahindra & Mahindra Financial Services Ltd (Financial Services)
Equity, Since 31 Jan 15 | M&MFIN3% ₹570 Cr 20,000,000
↑ 3,218,000 K.P.R. Mill Ltd (Consumer Cyclical)
Equity, Since 31 Oct 22 | KPRMILL3% ₹559 Cr 6,000,000 Schaeffler India Ltd (Consumer Cyclical)
Equity, Since 28 Feb 14 | SCHAEFFLER3% ₹548 Cr 1,600,000 L&T Technology Services Ltd (Technology)
Equity, Since 31 May 24 | LTTS3% ₹545 Cr 1,000,000 AIA Engineering Ltd (Industrials)
Equity, Since 30 Apr 24 | AIAENG3% ₹542 Cr 1,471,272
↑ 247,411 4. PGIM India Midcap Opportunities Fund
CAGR/Annualized return of 16.3% since its launch. Ranked 40 in Mid Cap category. Return for 2024 was 21% , 2023 was 20.8% and 2022 was -1.7% . PGIM India Midcap Opportunities Fund
Growth Launch Date 2 Dec 13 NAV (13 Mar 25) ₹54.9 ↓ -0.18 (-0.33 %) Net Assets (Cr) ₹10,460 on 31 Jan 25 Category Equity - Mid Cap AMC Pramerica Asset Managers Private Limited Rating ☆ Risk High Expense Ratio 1.72 Sharpe Ratio 0.35 Information Ratio -1.72 Alpha Ratio 0.31 Min Investment 5,000 Min SIP Investment 1,000 Exit Load 0-365 Days (1%),365 Days and above(NIL) Growth of 10,000 investment over the years.
Date Value 29 Feb 20 ₹10,000 28 Feb 21 ₹16,002 28 Feb 22 ₹21,184 28 Feb 23 ₹21,957 29 Feb 24 ₹27,871 28 Feb 25 ₹28,141 Returns for PGIM India Midcap Opportunities Fund
absolute basis & more than 1 year are on CAGR (Compound Annual Growth Rate) basis. as on 13 Mar 25 Duration Returns 1 Month -3.9% 3 Month -16.3% 6 Month -16.7% 1 Year 7.2% 3 Year 10.7% 5 Year 26.2% 10 Year 15 Year Since launch 16.3% Historical performance (Yearly) on absolute basis
Year Returns 2024 21% 2023 20.8% 2022 -1.7% 2021 63.8% 2020 48.4% 2019 3.6% 2018 -16.1% 2017 37% 2016 -1.3% 2015 7.9% Fund Manager information for PGIM India Midcap Opportunities Fund
Name Since Tenure Vinay Paharia 1 Apr 23 1.92 Yr. Puneet Pal 16 Jul 22 2.63 Yr. Utsav Mehta 1 Nov 23 1.33 Yr. Vivek Sharma 15 Apr 24 0.88 Yr. Data below for PGIM India Midcap Opportunities Fund as on 31 Jan 25
Equity Sector Allocation
Sector Value Industrials 19.88% Consumer Cyclical 17.05% Financial Services 17.01% Health Care 13.94% Technology 10.7% Basic Materials 9.01% Consumer Defensive 3.24% Communication Services 2.94% Real Estate 1.72% Utility 0.77% Asset Allocation
Asset Class Value Cash 3.56% Equity 96.26% Debt 0.18% Top Securities Holdings / Portfolio
Name Holding Value Quantity Max Healthcare Institute Ltd Ordinary Shares (Healthcare)
Equity, Since 30 Nov 22 | MAXHEALTH4% ₹374 Cr 3,526,055 Persistent Systems Ltd (Technology)
Equity, Since 30 Nov 21 | PERSISTENT4% ₹368 Cr 609,968 Dixon Technologies (India) Ltd (Technology)
Equity, Since 30 Apr 23 | DIXON3% ₹330 Cr 220,258 JK Cement Ltd (Basic Materials)
Equity, Since 30 Apr 23 | JKCEMENT3% ₹265 Cr 548,106
↑ 47,810 Solar Industries India Ltd (Basic Materials)
Equity, Since 30 Apr 23 | SOLARINDS2% ₹260 Cr 255,371
↑ 18,848 UNO Minda Ltd (Consumer Cyclical)
Equity, Since 30 Apr 23 | UNOMINDA2% ₹230 Cr 2,433,285
↓ -548,085 Indian Hotels Co Ltd (Consumer Cyclical)
Equity, Since 30 Apr 23 | 5008502% ₹226 Cr 2,956,582 Varun Beverages Ltd (Consumer Defensive)
Equity, Since 30 Apr 23 | VBL2% ₹218 Cr 4,058,845 Max Financial Services Ltd (Financial Services)
Equity, Since 31 Aug 19 | 5002712% ₹215 Cr 1,922,769 ICICI Lombard General Insurance Co Ltd (Financial Services)
Equity, Since 30 Jun 24 | ICICIGI2% ₹209 Cr 1,124,005 5. ICICI Prudential MidCap Fund
CAGR/Annualized return of 16.9% since its launch. Ranked 35 in Mid Cap category. Return for 2024 was 27% , 2023 was 32.8% and 2022 was 3.1% . ICICI Prudential MidCap Fund
Growth Launch Date 28 Oct 04 NAV (13 Mar 25) ₹242.64 ↓ -2.69 (-1.10 %) Net Assets (Cr) ₹5,975 on 31 Jan 25 Category Equity - Mid Cap AMC ICICI Prudential Asset Management Company Limited Rating ☆☆ Risk Moderately High Expense Ratio 2.11 Sharpe Ratio 0.46 Information Ratio -0.64 Alpha Ratio 1.85 Min Investment 5,000 Min SIP Investment 100 Exit Load 0-1 Years (1%),1 Years and above(NIL) Growth of 10,000 investment over the years.
Date Value 29 Feb 20 ₹10,000 28 Feb 21 ₹13,766 28 Feb 22 ₹16,505 28 Feb 23 ₹17,354 29 Feb 24 ₹26,141 28 Feb 25 ₹26,457 Returns for ICICI Prudential MidCap Fund
absolute basis & more than 1 year are on CAGR (Compound Annual Growth Rate) basis. as on 13 Mar 25 Duration Returns 1 Month -4.9% 3 Month -18.2% 6 Month -18.6% 1 Year 6.3% 3 Year 17.2% 5 Year 25% 10 Year 15 Year Since launch 16.9% Historical performance (Yearly) on absolute basis
Year Returns 2024 27% 2023 32.8% 2022 3.1% 2021 44.8% 2020 19.1% 2019 -0.6% 2018 -10.8% 2017 42.9% 2016 4.8% 2015 5.1% Fund Manager information for ICICI Prudential MidCap Fund
Name Since Tenure Lalit Kumar 1 Jul 22 2.67 Yr. Sharmila D’mello 31 Jul 22 2.59 Yr. Data below for ICICI Prudential MidCap Fund as on 31 Jan 25
Equity Sector Allocation
Sector Value Basic Materials 29.21% Industrials 19.97% Financial Services 14.53% Communication Services 12% Consumer Cyclical 10.57% Real Estate 8.42% Health Care 2.51% Technology 1.79% Utility 0.17% Consumer Defensive 0.12% Asset Allocation
Asset Class Value Cash 0.7% Equity 99.3% Top Securities Holdings / Portfolio
Name Holding Value Quantity Info Edge (India) Ltd (Communication Services)
Equity, Since 30 Sep 23 | NAUKRI5% ₹288 Cr 372,785 Muthoot Finance Ltd (Financial Services)
Equity, Since 30 Nov 23 | 5333984% ₹214 Cr 948,183 Jindal Stainless Ltd (Basic Materials)
Equity, Since 31 Aug 22 | JSL3% ₹200 Cr 3,056,731 Phoenix Mills Ltd (Real Estate)
Equity, Since 31 May 20 | 5031003% ₹190 Cr 1,156,191 UPL Ltd (Basic Materials)
Equity, Since 31 Oct 22 | UPL3% ₹189 Cr 3,135,084
↑ 500,000 Jindal Steel & Power Ltd (Basic Materials)
Equity, Since 31 Jan 22 | 5322863% ₹180 Cr 2,279,227
↑ 100,000 PB Fintech Ltd (Financial Services)
Equity, Since 31 May 24 | 5433903% ₹170 Cr 983,085
↑ 811,051 APL Apollo Tubes Ltd (Basic Materials)
Equity, Since 30 Sep 22 | APLAPOLLO3% ₹169 Cr 1,117,934 Bharti Hexacom Ltd (Communication Services)
Equity, Since 30 Apr 24 | BHARTIHEXA3% ₹167 Cr 1,235,794
↑ 269,200 Godrej Properties Ltd (Real Estate)
Equity, Since 30 Sep 22 | GODREJPROP3% ₹161 Cr 690,323 6. Kotak Emerging Equity Scheme
CAGR/Annualized return of 14.3% since its launch. Ranked 12 in Mid Cap category. Return for 2024 was 33.6% , 2023 was 31.5% and 2022 was 5.1% . Kotak Emerging Equity Scheme
Growth Launch Date 30 Mar 07 NAV (13 Mar 25) ₹110.691 ↓ -0.51 (-0.46 %) Net Assets (Cr) ₹49,092 on 31 Jan 25 Category Equity - Mid Cap AMC Kotak Mahindra Asset Management Co Ltd Rating ☆☆☆☆ Risk Moderately High Expense Ratio 1.52 Sharpe Ratio 0.82 Information Ratio -0.31 Alpha Ratio 8.2 Min Investment 5,000 Min SIP Investment 1,000 Exit Load 0-2 Years (1%),2 Years and above(NIL) Growth of 10,000 investment over the years.
Date Value 29 Feb 20 ₹10,000 28 Feb 21 ₹13,664 28 Feb 22 ₹16,709 28 Feb 23 ₹18,291 29 Feb 24 ₹24,931 28 Feb 25 ₹26,434 Returns for Kotak Emerging Equity Scheme
absolute basis & more than 1 year are on CAGR (Compound Annual Growth Rate) basis. as on 13 Mar 25 Duration Returns 1 Month -5.2% 3 Month -19% 6 Month -18.6% 1 Year 12.1% 3 Year 17.4% 5 Year 24.9% 10 Year 15 Year Since launch 14.3% Historical performance (Yearly) on absolute basis
Year Returns 2024 33.6% 2023 31.5% 2022 5.1% 2021 47.3% 2020 21.9% 2019 8.9% 2018 -11.7% 2017 43% 2016 10.4% 2015 8.4% Fund Manager information for Kotak Emerging Equity Scheme
Name Since Tenure Atul Bhole 22 Jan 24 1.11 Yr. Data below for Kotak Emerging Equity Scheme as on 31 Jan 25
Equity Sector Allocation
Sector Value Industrials 18.27% Technology 16.21% Basic Materials 15.17% Consumer Cyclical 14.37% Financial Services 11.42% Health Care 10.73% Energy 3.08% Real Estate 2.96% Communication Services 2.01% Consumer Defensive 1.39% Utility 0.82% Asset Allocation
Asset Class Value Cash 3.56% Equity 96.44% Other 0% Top Securities Holdings / Portfolio
Name Holding Value Quantity Mphasis Ltd (Technology)
Equity, Since 31 Jan 24 | 5262993% ₹1,672 Cr 5,829,668
↑ 2,142 Ipca Laboratories Ltd (Healthcare)
Equity, Since 31 Mar 21 | 5244943% ₹1,585 Cr 10,978,635
↑ 182,411 Fortis Healthcare Ltd (Healthcare)
Equity, Since 31 Mar 24 | 5328433% ₹1,583 Cr 24,724,343 Oberoi Realty Ltd (Real Estate)
Equity, Since 31 Mar 15 | OBEROIRLTY3% ₹1,452 Cr 8,010,973 Oracle Financial Services Software Ltd (Technology)
Equity, Since 31 May 24 | OFSS3% ₹1,396 Cr 1,529,941 Coromandel International Ltd (Basic Materials)
Equity, Since 31 Dec 13 | 5063953% ₹1,369 Cr 7,565,556 Persistent Systems Ltd (Technology)
Equity, Since 31 Jul 13 | PERSISTENT3% ₹1,294 Cr 2,144,997
↓ -262,019 JK Cement Ltd (Basic Materials)
Equity, Since 31 Mar 20 | JKCEMENT3% ₹1,232 Cr 2,548,700
↓ -14,204 Wipro Ltd (Technology)
Equity, Since 30 Sep 24 | 5076852% ₹1,146 Cr 36,730,132
↑ 1,849,956 Dixon Technologies (India) Ltd (Technology)
Equity, Since 31 Jan 23 | DIXON2% ₹1,129 Cr 753,620 7. Invesco India Mid Cap Fund
CAGR/Annualized return of 16% since its launch. Ranked 38 in Mid Cap category. Return for 2024 was 43.1% , 2023 was 34.1% and 2022 was 0.5% . Invesco India Mid Cap Fund
Growth Launch Date 19 Apr 07 NAV (13 Mar 25) ₹142.37 ↓ -0.84 (-0.59 %) Net Assets (Cr) ₹5,645 on 31 Jan 25 Category Equity - Mid Cap AMC Invesco Asset Management (India) Private Ltd Rating ☆☆ Risk Moderately High Expense Ratio 1.89 Sharpe Ratio 0.82 Information Ratio 0 Alpha Ratio 0 Min Investment 5,000 Min SIP Investment 500 Exit Load 0-1 Years (1%),1 Years and above(NIL) Growth of 10,000 investment over the years.
Date Value 29 Feb 20 ₹10,000 28 Feb 21 ₹13,136 28 Feb 22 ₹15,671 28 Feb 23 ₹16,374 29 Feb 24 ₹24,371 28 Feb 25 ₹26,911 Returns for Invesco India Mid Cap Fund
absolute basis & more than 1 year are on CAGR (Compound Annual Growth Rate) basis. as on 13 Mar 25 Duration Returns 1 Month -4.3% 3 Month -18.7% 6 Month -16.1% 1 Year 17.2% 3 Year 20.3% 5 Year 24.3% 10 Year 15 Year Since launch 16% Historical performance (Yearly) on absolute basis
Year Returns 2024 43.1% 2023 34.1% 2022 0.5% 2021 43.1% 2020 24.4% 2019 3.8% 2018 -5.3% 2017 44.3% 2016 1.1% 2015 6.4% Fund Manager information for Invesco India Mid Cap Fund
Name Since Tenure Aditya Khemani 9 Nov 23 1.31 Yr. Amit Ganatra 1 Sep 23 1.5 Yr. Data below for Invesco India Mid Cap Fund as on 31 Jan 25
Equity Sector Allocation
Sector Value Financial Services 22.9% Consumer Cyclical 20.76% Health Care 16.35% Technology 10.8% Industrials 10.14% Basic Materials 9.5% Real Estate 7.14% Communication Services 1.69% Asset Allocation
Asset Class Value Cash 0.72% Equity 99.28% Top Securities Holdings / Portfolio
Name Holding Value Quantity L&T Finance Ltd (Financial Services)
Equity, Since 31 Dec 23 | LTF4% ₹245 Cr 16,854,973
↑ 3,399,885 Max Healthcare Institute Ltd Ordinary Shares (Healthcare)
Equity, Since 31 Dec 22 | MAXHEALTH4% ₹238 Cr 2,246,434 The Federal Bank Ltd (Financial Services)
Equity, Since 31 Oct 22 | FEDERALBNK4% ₹234 Cr 12,506,782 Dixon Technologies (India) Ltd (Technology)
Equity, Since 28 Feb 22 | DIXON4% ₹233 Cr 155,335 BSE Ltd (Financial Services)
Equity, Since 31 Dec 23 | BSE4% ₹232 Cr 436,534 Trent Ltd (Consumer Cyclical)
Equity, Since 30 Apr 21 | 5002514% ₹209 Cr 363,079 JK Cement Ltd (Basic Materials)
Equity, Since 31 Oct 22 | JKCEMENT4% ₹208 Cr 431,234
↑ 54,676 Coforge Ltd (Technology)
Equity, Since 31 Mar 22 | COFORGE3% ₹194 Cr 234,918 Max Financial Services Ltd (Financial Services)
Equity, Since 30 Nov 23 | 5002713% ₹188 Cr 1,684,103
↑ 300,918 Prestige Estates Projects Ltd (Real Estate)
Equity, Since 30 Nov 23 | PRESTIGE3% ₹178 Cr 1,305,659 8. BNP Paribas Mid Cap Fund
CAGR/Annualized return of 12.2% since its launch. Ranked 18 in Mid Cap category. Return for 2024 was 28.5% , 2023 was 32.6% and 2022 was 4.7% . BNP Paribas Mid Cap Fund
Growth Launch Date 2 May 06 NAV (13 Mar 25) ₹87.3995 ↓ -0.57 (-0.64 %) Net Assets (Cr) ₹2,046 on 31 Jan 25 Category Equity - Mid Cap AMC BNP Paribas Asset Mgmt India Pvt. Ltd Rating ☆☆☆ Risk High Expense Ratio 2.07 Sharpe Ratio 0.56 Information Ratio -0.65 Alpha Ratio 3.21 Min Investment 5,000 Min SIP Investment 300 Exit Load 0-12 Months (1%),12 Months and above(NIL) Growth of 10,000 investment over the years.
Date Value 29 Feb 20 ₹10,000 28 Feb 21 ₹13,568 28 Feb 22 ₹16,526 28 Feb 23 ₹17,139 29 Feb 24 ₹25,144 28 Feb 25 ₹25,630 Returns for BNP Paribas Mid Cap Fund
absolute basis & more than 1 year are on CAGR (Compound Annual Growth Rate) basis. as on 13 Mar 25 Duration Returns 1 Month -4% 3 Month -15.6% 6 Month -17.7% 1 Year 8.1% 3 Year 16.1% 5 Year 24.2% 10 Year 15 Year Since launch 12.2% Historical performance (Yearly) on absolute basis
Year Returns 2024 28.5% 2023 32.6% 2022 4.7% 2021 41.5% 2020 23.1% 2019 5.2% 2018 -17.5% 2017 49% 2016 -1.2% 2015 15.3% Fund Manager information for BNP Paribas Mid Cap Fund
Name Since Tenure Shiv Chanani 13 Jul 22 2.63 Yr. Himanshu Singh 21 Oct 24 0.36 Yr. Data below for BNP Paribas Mid Cap Fund as on 31 Jan 25
Equity Sector Allocation
Sector Value Financial Services 19.23% Consumer Cyclical 14.4% Industrials 14.15% Health Care 13.39% Basic Materials 10.45% Technology 8.82% Consumer Defensive 5.49% Energy 3.19% Communication Services 3% Real Estate 2.41% Utility 1% Asset Allocation
Asset Class Value Cash 4.48% Equity 95.52% Top Securities Holdings / Portfolio
Name Holding Value Quantity PB Fintech Ltd (Financial Services)
Equity, Since 28 Feb 23 | 5433903% ₹69 Cr 400,000 Hitachi Energy India Ltd Ordinary Shares (Technology)
Equity, Since 31 Dec 22 | POWERINDIA3% ₹56 Cr 43,250 CRISIL Ltd (Financial Services)
Equity, Since 29 Feb 24 | CRISIL3% ₹54 Cr 100,000 Indian Hotels Co Ltd (Consumer Cyclical)
Equity, Since 31 Oct 21 | 5008503% ₹54 Cr 700,000 Phoenix Mills Ltd (Real Estate)
Equity, Since 31 Oct 22 | 5031002% ₹49 Cr 300,000 The Federal Bank Ltd (Financial Services)
Equity, Since 31 Jul 16 | FEDERALBNK2% ₹47 Cr 2,500,000 Lupin Ltd (Healthcare)
Equity, Since 28 Feb 22 | 5002572% ₹45 Cr 215,000 National Aluminium Co Ltd (Basic Materials)
Equity, Since 30 Apr 24 | 5322342% ₹44 Cr 2,200,000 Indian Bank (Financial Services)
Equity, Since 30 Jun 21 | 5328142% ₹44 Cr 800,000 Escorts Kubota Ltd (Industrials)
Equity, Since 31 Oct 22 | 5004952% ₹43 Cr 120,000 9. TATA Mid Cap Growth Fund
CAGR/Annualized return of 12.4% since its launch. Ranked 31 in Mid Cap category. Return for 2024 was 22.7% , 2023 was 40.5% and 2022 was 0.6% . TATA Mid Cap Growth Fund
Growth Launch Date 1 Jul 94 NAV (13 Mar 25) ₹366.383 ↓ -1.79 (-0.49 %) Net Assets (Cr) ₹4,354 on 31 Jan 25 Category Equity - Mid Cap AMC Tata Asset Management Limited Rating ☆☆ Risk Moderately High Expense Ratio 0 Sharpe Ratio 0.35 Information Ratio -0.76 Alpha Ratio 0.05 Min Investment 5,000 Min SIP Investment 150 Exit Load 0-365 Days (1%),365 Days and above(NIL) Growth of 10,000 investment over the years.
Date Value 29 Feb 20 ₹10,000 28 Feb 21 ₹13,070 28 Feb 22 ₹15,829 28 Feb 23 ₹16,477 29 Feb 24 ₹24,895 28 Feb 25 ₹24,735 Returns for TATA Mid Cap Growth Fund
absolute basis & more than 1 year are on CAGR (Compound Annual Growth Rate) basis. as on 13 Mar 25 Duration Returns 1 Month -3.8% 3 Month -16% 6 Month -19.6% 1 Year 6.3% 3 Year 16.5% 5 Year 22.9% 10 Year 15 Year Since launch 12.4% Historical performance (Yearly) on absolute basis
Year Returns 2024 22.7% 2023 40.5% 2022 0.6% 2021 40% 2020 24.3% 2019 6.5% 2018 -13% 2017 49.8% 2016 -2.2% 2015 10.8% Fund Manager information for TATA Mid Cap Growth Fund
Name Since Tenure Satish Mishra 9 Mar 21 3.98 Yr. Data below for TATA Mid Cap Growth Fund as on 31 Jan 25
Equity Sector Allocation
Sector Value Industrials 23.38% Financial Services 20.39% Health Care 14.75% Consumer Cyclical 10.86% Basic Materials 9.49% Technology 5.68% Real Estate 4.84% Communication Services 2.98% Utility 1.87% Energy 1.69% Consumer Defensive 1.13% Asset Allocation
Asset Class Value Cash 2.92% Equity 97.08% Top Securities Holdings / Portfolio
Name Holding Value Quantity Max Financial Services Ltd (Financial Services)
Equity, Since 30 Nov 23 | 5002713% ₹145 Cr 1,300,000 Muthoot Finance Ltd (Financial Services)
Equity, Since 30 Apr 24 | 5333983% ₹127 Cr 561,497
↓ -138,503 Jubilant Foodworks Ltd (Consumer Cyclical)
Equity, Since 30 Jun 18 | JUBLFOOD3% ₹127 Cr 1,800,000 Alkem Laboratories Ltd (Healthcare)
Equity, Since 31 Mar 21 | ALKEM3% ₹127 Cr 250,000 Lupin Ltd (Healthcare)
Equity, Since 31 Dec 22 | 5002573% ₹125 Cr 600,000
↑ 100,000 Aurobindo Pharma Ltd (Healthcare)
Equity, Since 30 Jun 23 | AUROPHARMA3% ₹117 Cr 1,000,000 ICICI Lombard General Insurance Co Ltd (Financial Services)
Equity, Since 31 Jul 24 | ICICIGI3% ₹112 Cr 600,000
↑ 250,000 Cummins India Ltd (Industrials)
Equity, Since 31 Mar 21 | 5004802% ₹108 Cr 369,694 UNO Minda Ltd (Consumer Cyclical)
Equity, Since 31 Mar 21 | UNOMINDA2% ₹104 Cr 1,100,000
↑ 100,000 Mphasis Ltd (Technology)
Equity, Since 31 Jul 24 | 5262992% ₹101 Cr 353,648
↑ 3,648 10. Sundaram Mid Cap Fund
CAGR/Annualized return of 23.3% since its launch. Ranked 13 in Mid Cap category. Return for 2024 was 32% , 2023 was 40.4% and 2022 was 4.8% . Sundaram Mid Cap Fund
Growth Launch Date 30 Jul 02 NAV (13 Mar 25) ₹1,152.09 ↓ -6.45 (-0.56 %) Net Assets (Cr) ₹11,638 on 31 Jan 25 Category Equity - Mid Cap AMC Sundaram Asset Management Company Ltd Rating ☆☆☆☆ Risk Moderately High Expense Ratio 1.8 Sharpe Ratio 0.73 Information Ratio 0.2 Alpha Ratio 5.98 Min Investment 5,000 Min SIP Investment 100 Exit Load 0-12 Months (1%),12 Months and above(NIL) Growth of 10,000 investment over the years.
Date Value 29 Feb 20 ₹10,000 28 Feb 21 ₹12,188 28 Feb 22 ₹14,328 28 Feb 23 ₹15,254 29 Feb 24 ₹23,173 28 Feb 25 ₹24,152 Returns for Sundaram Mid Cap Fund
absolute basis & more than 1 year are on CAGR (Compound Annual Growth Rate) basis. as on 13 Mar 25 Duration Returns 1 Month -4.7% 3 Month -18.2% 6 Month -18.6% 1 Year 9.2% 3 Year 19.7% 5 Year 22.8% 10 Year 15 Year Since launch 23.3% Historical performance (Yearly) on absolute basis
Year Returns 2024 32% 2023 40.4% 2022 4.8% 2021 37.5% 2020 11.8% 2019 -0.3% 2018 -15.4% 2017 40.8% 2016 11.3% 2015 11.2% Fund Manager information for Sundaram Mid Cap Fund
Name Since Tenure S. Bharath 24 Feb 21 4.02 Yr. Ratish Varier 24 Feb 21 4.02 Yr. Data below for Sundaram Mid Cap Fund as on 31 Jan 25
Equity Sector Allocation
Sector Value Financial Services 19.52% Consumer Cyclical 18.4% Industrials 15.29% Health Care 11.03% Basic Materials 9.99% Technology 6.45% Real Estate 3.43% Consumer Defensive 3.4% Communication Services 3.32% Utility 2.1% Energy 1.7% Asset Allocation
Asset Class Value Cash 5.37% Equity 94.63% Other 0% Top Securities Holdings / Portfolio
Name Holding Value Quantity Cummins India Ltd (Industrials)
Equity, Since 31 Dec 17 | 5004803% ₹368 Cr 1,261,598
↑ 27,698 The Federal Bank Ltd (Financial Services)
Equity, Since 31 Dec 18 | FEDERALBNK3% ₹360 Cr 19,247,362 Coromandel International Ltd (Basic Materials)
Equity, Since 30 Nov 10 | 5063953% ₹316 Cr 1,747,182 Kalyan Jewellers India Ltd (Consumer Cyclical)
Equity, Since 31 Mar 21 | KALYANKJIL3% ₹303 Cr 6,016,821 Persistent Systems Ltd (Technology)
Equity, Since 30 Apr 22 | PERSISTENT3% ₹293 Cr 484,892 Lupin Ltd (Healthcare)
Equity, Since 31 Jan 23 | 5002572% ₹281 Cr 1,350,321
↓ -37,879 Indian Bank (Financial Services)
Equity, Since 31 Jul 23 | 5328142% ₹272 Cr 4,897,146
↑ 338,790 Oberoi Realty Ltd (Real Estate)
Equity, Since 31 Jan 22 | OBEROIRLTY2% ₹252 Cr 1,389,543 Trent Ltd (Consumer Cyclical)
Equity, Since 31 Dec 06 | 5002512% ₹250 Cr 434,230
↓ -66,178 Fortis Healthcare Ltd (Healthcare)
Equity, Since 31 Dec 21 | 5328432% ₹248 Cr 3,879,249
↓ -98,100 11. Franklin India Prima Fund
CAGR/Annualized return of 19.1% since its launch. Ranked 29 in Mid Cap category. Return for 2024 was 31.8% , 2023 was 36.8% and 2022 was 2.2% . Franklin India Prima Fund
Growth Launch Date 1 Dec 93 NAV (13 Mar 25) ₹2,356.46 ↓ -16.26 (-0.69 %) Net Assets (Cr) ₹11,656 on 31 Jan 25 Category Equity - Mid Cap AMC Franklin Templeton Asst Mgmt(IND)Pvt Ltd Rating ☆☆☆ Risk Moderately High Expense Ratio 1.8 Sharpe Ratio 0.77 Information Ratio -0.24 Alpha Ratio 6.71 Min Investment 5,000 Min SIP Investment 500 Exit Load 0-1 Years (1%),1 Years and above(NIL) Growth of 10,000 investment over the years.
Date Value 29 Feb 20 ₹10,000 28 Feb 21 ₹13,255 28 Feb 22 ₹14,788 28 Feb 23 ₹15,760 29 Feb 24 ₹23,012 28 Feb 25 ₹24,630 Returns for Franklin India Prima Fund
absolute basis & more than 1 year are on CAGR (Compound Annual Growth Rate) basis. as on 13 Mar 25 Duration Returns 1 Month -4% 3 Month -16.6% 6 Month -16.4% 1 Year 13.1% 3 Year 19.6% 5 Year 22.7% 10 Year 15 Year Since launch 19.1% Historical performance (Yearly) on absolute basis
Year Returns 2024 31.8% 2023 36.8% 2022 2.2% 2021 32.6% 2020 17.8% 2019 3.5% 2018 -9.4% 2017 39.7% 2016 8.5% 2015 6.8% Fund Manager information for Franklin India Prima Fund
Name Since Tenure R. Janakiraman 1 Feb 11 14.09 Yr. Sandeep Manam 18 Oct 21 3.37 Yr. Akhil Kalluri 7 Feb 22 3.06 Yr. Data below for Franklin India Prima Fund as on 31 Jan 25
Equity Sector Allocation
Sector Value Financial Services 20.15% Consumer Cyclical 15.67% Basic Materials 14.43% Industrials 13.27% Health Care 10.25% Technology 8.72% Real Estate 5.96% Consumer Defensive 4.24% Communication Services 2.63% Utility 1.14% Energy 0.69% Asset Allocation
Asset Class Value Cash 2.83% Equity 97.17% Top Securities Holdings / Portfolio
Name Holding Value Quantity The Federal Bank Ltd (Financial Services)
Equity, Since 30 Jun 20 | FEDERALBNK4% ₹411 Cr 21,939,752
↓ -1,500,000 Persistent Systems Ltd (Technology)
Equity, Since 30 Apr 21 | PERSISTENT2% ₹265 Cr 439,990
↓ -25,000 Mphasis Ltd (Technology)
Equity, Since 30 Sep 20 | 5262992% ₹258 Cr 901,105 Deepak Nitrite Ltd (Basic Materials)
Equity, Since 31 Jan 21 | DEEPAKNTR2% ₹256 Cr 1,100,123 Dixon Technologies (India) Ltd (Technology)
Equity, Since 30 Apr 23 | DIXON2% ₹246 Cr 164,000 Coromandel International Ltd (Basic Materials)
Equity, Since 31 May 11 | 5063952% ₹237 Cr 1,311,228
↓ -150,000 Ipca Laboratories Ltd (Healthcare)
Equity, Since 30 Nov 20 | 5244942% ₹237 Cr 1,641,580 Max Healthcare Institute Ltd Ordinary Shares (Healthcare)
Equity, Since 28 Feb 22 | MAXHEALTH2% ₹229 Cr 2,153,205 PB Fintech Ltd (Financial Services)
Equity, Since 31 Mar 22 | 5433902% ₹225 Cr 1,300,578 Prestige Estates Projects Ltd (Real Estate)
Equity, Since 31 Jan 22 | PRESTIGE2% ₹222 Cr 1,631,918
മിഡ്-ക്യാപ് ഫണ്ടുകൾ തിരഞ്ഞെടുക്കുമ്പോൾ ശ്രദ്ധിക്കേണ്ട പാരാമീറ്ററുകൾ
നിക്ഷേപിക്കുന്നതിന് ശരിയായ ഫണ്ട് തിരഞ്ഞെടുക്കുമ്പോൾ നിക്ഷേപകർ ശ്രദ്ധിക്കേണ്ട ചില പ്രധാന ഗുണപരവും അളവ്പരവുമായ ഘടകങ്ങളുണ്ട്. പദ്ധതി അല്ലെങ്കിൽ മ്യൂച്വൽഫണ്ട് റേറ്റിംഗ് ആരംഭിക്കുന്നത് നല്ലതായിരിക്കണം. AUM (അസറ്റ് അണ്ടർ മാനേജ്മെന്റ്), ഫണ്ടിന്റെ പ്രായം, മുൻകാല റിട്ടേണുകൾ, ചെലവ് അനുപാതം മുതലായവ പോലുള്ള മറ്റ് ഡാറ്റയ്ക്കൊപ്പം ഇത് അനുബന്ധമായി നൽകേണ്ടതുണ്ട്. കൂടാതെ, ഒരു ഫണ്ടിന്റെ കഴിഞ്ഞ മൂന്ന് വർഷത്തെ പ്രകടനം പരിശോധിക്കാൻ നിക്ഷേപകരോട് നിർദ്ദേശിക്കുന്നു. ഒരു ഫണ്ടിന് 100 കോടി രൂപയിലധികം അറ്റ ആസ്തി ഉണ്ടായിരിക്കണം കൂടാതെ കഴിഞ്ഞ ഒരു വർഷമായി മിഡ് ക്യാപ് സ്റ്റോക്കുകൾക്ക് 50 ശതമാനത്തിൽ കൂടുതൽ ശരാശരി അലോക്കേഷൻ ഉണ്ടായിരിക്കണം. കൂടാതെ, നിക്ഷേപകർ ഫണ്ടുകളുടെ ചെലവ് അനുപാതവും പരിശോധിക്കണം, എന്നിരുന്നാലും, ഇത് ഫണ്ട് പ്രകടനം പോലുള്ള മറ്റ് പ്രധാന ഘടകങ്ങളെ അസാധുവാക്കരുത്.
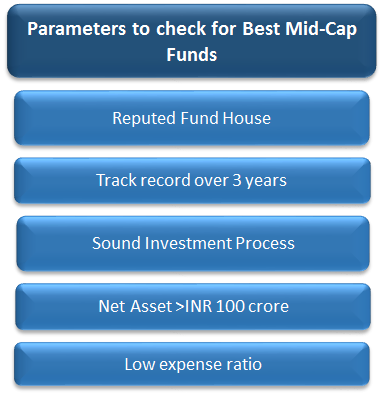
ഫണ്ട് മാനേജരുടെ ട്രാക്ക് റെക്കോർഡും നിക്ഷേപ പ്രക്രിയയും പോലെയുള്ള മറ്റ് ഗുണപരമായ ഘടകങ്ങളെ അധികമായി പരിശോധിക്കാൻ നിക്ഷേപകർ നിർദ്ദേശിക്കുന്നു. സാമ്പത്തിക വിപണികളിൽ ശക്തമായ സാന്നിധ്യമുള്ള ഫണ്ട് ഹൗസുകളെ തിരിച്ചറിയുകയും ദീർഘവും സ്ഥിരതയുള്ളതുമായ ട്രാക്ക് റെക്കോർഡുള്ള ഫണ്ടുകൾ നൽകുകയും ചെയ്യുക. നിങ്ങളുടെ പണം നിക്ഷേപിക്കുന്നതിന് നിങ്ങൾക്ക് വിശ്വാസമുള്ള ഫണ്ട് ഹൗസ് തിരഞ്ഞെടുക്കണം. എത്ര ഫണ്ടുകൾ മികച്ച പ്രകടനം കാഴ്ചവയ്ക്കുന്നുവെന്നും ഒന്ന് കാണണം. ധാരാളം നല്ല പ്രകടനം നടത്തുന്ന ഫണ്ടുകൾ ഉള്ളത് ഫണ്ട് ഹൗസിന്റെ മൊത്തത്തിലുള്ള തന്ത്രം നല്ല ക്രമത്തിലാണ് എന്നാണ് അർത്ഥമാക്കുന്നത്.
മിഡ് ക്യാപ് ഫണ്ടുകളിൽ ഓൺലൈനിൽ നിക്ഷേപിക്കുന്നത് എങ്ങനെ?
Fincash.com-ൽ ആജീവനാന്ത സൗജന്യ നിക്ഷേപ അക്കൗണ്ട് തുറക്കുക.
നിങ്ങളുടെ രജിസ്ട്രേഷനും KYC പ്രക്രിയയും പൂർത്തിയാക്കുക
രേഖകൾ അപ്ലോഡ് ചെയ്യുക (പാൻ, ആധാർ മുതലായവ).കൂടാതെ, നിങ്ങൾ നിക്ഷേപിക്കാൻ തയ്യാറാണ്!
ഉപസംഹാരം
മിഡ്-ക്യാപ് ഫണ്ടുകൾ ഉപയോഗിച്ച് പോകുന്നത് ഒരാളുടെ നിക്ഷേപ പോർട്ട്ഫോളിയോയ്ക്ക് അവർക്ക് നൽകാനാകുന്ന വരുമാനം കണക്കിലെടുത്ത് പ്രതിഫലദായകമാണ്. മിഡ്-ക്യാപ് മ്യൂച്വൽ ഫണ്ടുകളിൽ നിക്ഷേപിക്കുമ്പോൾ, നിക്ഷേപകർ എക്സ്പോഷർ ഒപ്റ്റിമൽ ലെവലിൽ നിലനിർത്തുന്നത് നല്ലതാണ്, കാരണം മിഡ്-ക്യാപ് ഉയർന്ന റിസ്ക് റിട്ടേൺ ഫണ്ടുകളാണ്.
ഇവിടെ നൽകിയിരിക്കുന്ന വിവരങ്ങൾ കൃത്യമാണെന്ന് ഉറപ്പാക്കാൻ എല്ലാ ശ്രമങ്ങളും നടത്തിയിട്ടുണ്ട്. എന്നിരുന്നാലും, ഡാറ്റയുടെ കൃത്യത സംബന്ധിച്ച് യാതൊരു ഉറപ്പും നൽകുന്നില്ല. എന്തെങ്കിലും നിക്ഷേപം നടത്തുന്നതിന് മുമ്പ് സ്കീം വിവര രേഖ ഉപയോഗിച്ച് പരിശോധിക്കുക.
You Might Also Like


AMFI Registration No. 112358 | CIN: U74999MH2016PTC282153
Shepard Technologies Pvt. Ltd. (with ARN code 112358) makes no warranties or representations, express or implied, on products offered through the platform. It accepts no liability for any damages or losses, however caused, in connection with the use of, or on the reliance of its product or related services. Terms and conditions of the website are applicable.
©2025 Shepard Technologies Private Limited. All Rights Reserved