Table of Contents
- മണി മാർക്കറ്റ് ഫണ്ടുകൾ എന്തൊക്കെയാണ്?
- സ്ഥിരവരുമാനം Vs സ്റ്റോക്കുകൾ
- സ്ഥിര വരുമാന ഉപകരണങ്ങളുടെ തരങ്ങൾ
- എന്തുകൊണ്ട് മണി മാർക്കറ്റ് മ്യൂച്വൽ ഫണ്ടുകളിൽ നിക്ഷേപിക്കണം?
- മണി മാർക്കറ്റ് ഉപകരണങ്ങളും ബോണ്ടുകളും: വ്യത്യാസം
- പരിഗണിക്കേണ്ട ഘടകങ്ങൾ
- 22-23 സാമ്പത്തിക വർഷത്തിൽ നിക്ഷേപിക്കുന്നതിനുള്ള മികച്ച മണി മാർക്കറ്റ് ഫണ്ടുകൾ
- ഉപസംഹാരം
Top 5 Debt - Money Market Funds
മണി മാർക്കറ്റ് മ്യൂച്വൽ ഫണ്ടുകൾ
മണി മാർക്കറ്റ് ഫണ്ടുകൾ എന്തൊക്കെയാണ്?
ഒരു പണംവിപണി ഫണ്ട് (എംഎംഎഫ്) ഒരു തരം ഫിക്സഡ് ആണ്വരുമാനം ഡെറ്റ് സെക്യൂരിറ്റികളിൽ നിക്ഷേപിക്കുന്ന മ്യൂച്വൽ ഫണ്ട്. പക്ഷേ, നമ്മൾ മണി മാർക്കറ്റ് ഫണ്ടുകൾ ആരംഭിക്കുന്നതിന് മുമ്പ്, ഒരു സ്ഥിര വരുമാന ഉപകരണം എന്താണെന്ന് മനസ്സിലാക്കേണ്ടത് പ്രധാനമാണ്? ശരി, പേര് സൂചിപ്പിക്കുന്നത് പോലെ, ഒരു നിശ്ചിത കാലയളവിൽ ഒരു നിശ്ചിത തുക വരുമാനം സൃഷ്ടിക്കുന്ന ഒന്നാണ് സ്ഥിര വരുമാന ഉപകരണം. ദിനിക്ഷേപകൻ ഇഷ്യൂവർ കൈവശം വച്ചിരിക്കുന്ന ആസ്തികളിൽ ഒരു നിശ്ചിത ക്ലെയിം നൽകുന്നു, സ്ഥിര വരുമാന ഉപകരണങ്ങൾ കുറഞ്ഞ അപകടസാധ്യതയുള്ളതും കുറഞ്ഞ വരുമാനമുള്ളതുമായ നിക്ഷേപങ്ങളായി കണക്കാക്കപ്പെടുന്നു.
അടിസ്ഥാനപരമായി, സ്ഥിരവരുമാന ഉപകരണങ്ങൾ ഒന്നുമല്ല, ഫണ്ടുകൾ കടം വാങ്ങുന്നതിനുള്ള ഒരു മാർഗമാണ് (ഇഷ്യു ചെയ്യുന്നയാൾ കടമെടുക്കുന്നത്).
സ്ഥിരവരുമാനം Vs സ്റ്റോക്കുകൾ
തുടക്കക്കാർക്ക്, സ്ഥിരവരുമാനം ഉടമയ്ക്ക് സാമ്പത്തിക അവകാശങ്ങൾ നൽകുന്നു, അതിൽ പലിശ പേയ്മെന്റുകൾ സ്വീകരിക്കുന്നതിനുള്ള അവകാശവും എല്ലാ അല്ലെങ്കിൽ ഭാഗവും തിരികെ നൽകാനുള്ള അവകാശവും ഉൾപ്പെടുന്നു.മൂലധനം ഒരു നിശ്ചിത തീയതിയിൽ നിക്ഷേപിച്ചു. വിപരീതമായി, ദിഓഹരി ഉടമ (സ്റ്റോക്ക് ഉടമ) ഇഷ്യൂവറിൽ നിന്ന് ലാഭവിഹിതം സ്വീകരിക്കുന്നു, എന്നാൽ ലാഭവിഹിതം നൽകാൻ കമ്പനി ഒരു നിയമത്തിനും വിധേയമല്ല. കൂടാതെ, മറ്റൊരു പ്രധാന വ്യത്യാസം, സ്ഥിരവരുമാനമുള്ളയാൾ സെക്യൂരിറ്റി നൽകുന്ന കമ്പനിയുടെ കടക്കാരനാണ്, അതേസമയം ഒരു ഓഹരിയുടമ ഒരു പങ്കാളിയാണ്, മൂലധന സ്റ്റോക്കിന്റെ ഒരു ഭാഗം സ്വന്തമാക്കുന്നു. കമ്പനി തകരുകയാണെങ്കിൽ, കടക്കാർക്ക് (ബോണ്ട് ഹോൾഡർമാർ) ഷെയർഹോൾഡർമാരേക്കാൾ (ഇക്വിറ്റി ഹോൾഡർമാർ) മുൻഗണന ഉണ്ടെന്ന് ഇവിടെ മനസ്സിലാക്കേണ്ടത് പ്രധാനമാണ്.
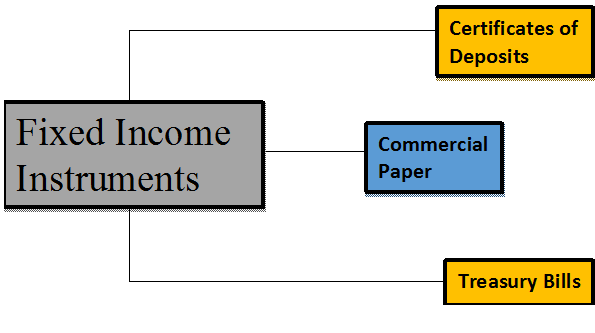
സ്ഥിര വരുമാന ഉപകരണങ്ങളുടെ തരങ്ങൾ
മണി മാർക്കറ്റ് ഉപകരണങ്ങളുടെ കീഴിൽ വരുന്ന വ്യത്യസ്ത സ്ഥിരവരുമാന ഉപകരണങ്ങൾ ഉണ്ട്, അവയിൽ ചിലത്:
നിക്ഷേപങ്ങളുടെ സർട്ടിഫിക്കറ്റുകൾ (സിഡികൾ)
ടേം ഡെപ്പോസിറ്റുകൾ പോലുള്ള സമയ നിക്ഷേപങ്ങൾ സാധാരണയായി ബാങ്കുകളും (ഷെഡ്യൂൾഡ് വാണിജ്യ ബാങ്കുകളും) അഖിലേന്ത്യാ ധനകാര്യ സ്ഥാപനങ്ങളും ഉപഭോക്താക്കൾക്ക് വാഗ്ദാനം ചെയ്യുന്നു. ഇതും a ലെ ടേം ഡെപ്പോസിറ്റും തമ്മിലുള്ള വ്യത്യാസംബാങ്ക് സിഡികൾ പിൻവലിക്കാൻ കഴിയില്ല എന്നതാണ്.
വാണിജ്യ പേപ്പർ (CPs)
വാണിജ്യ പേപ്പറുകൾ സാധാരണയായി പ്രോമിസറി നോട്ടുകൾ എന്നറിയപ്പെടുന്നു, അവ സുരക്ഷിതമല്ലാത്തതും സാധാരണയായി കമ്പനികളും ധനകാര്യ സ്ഥാപനങ്ങളും അവയുടെ ഡിസ്കൗണ്ട് നിരക്കിൽ വിതരണം ചെയ്യുന്നതുമാണ്.മുഖവില. വാണിജ്യ പേപ്പറുകളുടെ നിശ്ചിത കാലാവധി 1 മുതൽ 270 ദിവസം വരെയാണ്. അവ ഇഷ്യൂ ചെയ്യുന്ന ഉദ്ദേശ്യങ്ങൾ - ഇൻവെന്ററി ഫിനാൻസിംഗ്, അക്കൗണ്ടുകൾലഭിക്കേണ്ടവ, ഹ്രസ്വകാല ബാധ്യതകൾ അല്ലെങ്കിൽ വായ്പകൾ തീർപ്പാക്കൽ.
Talk to our investment specialist
ട്രഷറി ബില്ലുകൾ (ടി-ബില്ലുകൾ)
ട്രഷറി ബില്ലുകൾ ആദ്യമായി ഇഷ്യൂ ചെയ്തത് 1917-ൽ ഇന്ത്യൻ സർക്കാർ ആണ്. ട്രഷറി ബില്ലുകൾ രാജ്യത്തിന്റെ സെൻട്രൽ ബാങ്ക് നൽകുന്ന ഹ്രസ്വകാല സാമ്പത്തിക ഉപകരണങ്ങളാണ്. നിക്ഷേപങ്ങളിൽ നിന്നുള്ള വരുമാനം അത്ര വലുതല്ലെങ്കിലും, വിപണി അപകടസാധ്യതകളില്ലാത്തതിനാൽ ഇത് ഏറ്റവും സുരക്ഷിതമായ മണി മാർക്കറ്റ് ഉപകരണങ്ങളിലൊന്നാണ് (റിസ്ക് പരമാധികാരമുള്ളതിനാൽ അല്ലെങ്കിൽ ഈ സാഹചര്യത്തിൽ ഇന്ത്യാ ഗവൺമെന്റാണ്). ട്രഷറി ബില്ലുകൾ പ്രൈമറി, സെക്കൻഡറി മാർക്കറ്റുകൾ വഴി വിതരണം ചെയ്യുന്നു. ട്രഷറി ബില്ലുകളുടെ കാലാവധി യഥാക്രമം 3-മാസം, 6-മാസം, 1-വർഷം എന്നിവയാണ്.
റീപർച്ചേസ് എഗ്രിമെന്റുകൾ (റിപ്പോകൾ), അസറ്റ്-ബാക്ക്ഡ് സെക്യൂരിറ്റികൾ മുതലായ നിരവധി സ്ഥിരവരുമാന ഉപകരണങ്ങൾ ഇന്ത്യൻ സ്ഥിര വരുമാന വിപണിയിലും നിലവിലുണ്ട്, എന്നാൽ മുകളിൽ പറഞ്ഞവയാണ് കൂടുതൽ സാധാരണമായത്.
എന്തുകൊണ്ട് മണി മാർക്കറ്റ് മ്യൂച്വൽ ഫണ്ടുകളിൽ നിക്ഷേപിക്കണം?
- മണി മാർക്കറ്റിലെ സെക്യൂരിറ്റികൾ താരതമ്യേന അപകടസാധ്യത കുറവാണ്.
- മണി മാർക്കറ്റ് ഫണ്ടുകൾ എല്ലാ മ്യൂച്വൽ ഫണ്ട് നിക്ഷേപങ്ങളുടെയും സുരക്ഷിതവും സുരക്ഷിതവുമാണ്.
- മണി മാർക്കറ്റ് ഫണ്ടുകൾ കണക്കിലെടുക്കുമ്പോൾ, ഒരു മണി മാർക്കറ്റ് അക്കൗണ്ടിൽ നിക്ഷേപിക്കുന്നത് എളുപ്പമാണ്.നിക്ഷേപിക്കുന്നു വഴിമ്യൂച്വൽ ഫണ്ടുകൾ നിക്ഷേപകർക്ക് അവരുടെ സൗകര്യത്തിനനുസരിച്ച് ഒരു അക്കൗണ്ട് തുറക്കാനും നിക്ഷേപം നടത്താനും പിൻവലിക്കാനും കഴിയും.
- എല്ലാ മ്യൂച്വൽ ഫണ്ട് നിക്ഷേപങ്ങളിലും ഏറ്റവും കുറഞ്ഞ അസ്ഥിരമായ തരങ്ങളിലൊന്നായി മണി മാർക്കറ്റ് ഫണ്ടുകൾ കണക്കാക്കപ്പെടുന്നു.
- മണി മാർക്കറ്റ് ഫണ്ടുകളുടെ പ്രകടനം റിസർവ് ബാങ്ക് ഓഫ് ഇന്ത്യ നിശ്ചയിക്കുന്ന പലിശ നിരക്കുകളുമായി അടുത്ത് ബന്ധപ്പെട്ടിരിക്കുന്നു.സെൻട്രൽ ബാങ്ക് ഓഫ് ഇന്ത്യ. അതിനാൽ, ആർബിഐ വിപണിയിൽ നിരക്കുകൾ ഉയർത്തുമ്പോൾ, ആദായം വർദ്ധിക്കുകയും മണി മാർക്കറ്റ് ഫണ്ടുകൾക്ക് നല്ല വരുമാനം നൽകുകയും ചെയ്യുന്നു.
മണി മാർക്കറ്റ് ഉപകരണങ്ങളും ബോണ്ടുകളും: വ്യത്യാസം
ബോണ്ടുകൾ സാധാരണയായി ഒരു വർഷത്തിൽ താഴെ കാലാവധിയുള്ള വാണിജ്യ പേപ്പറുകൾ, ട്രഷറി ബില്ലുകൾ, മറ്റ് മണി മാർക്കറ്റ് ഉപകരണങ്ങൾ എന്നിവ പോലെയുള്ള മറ്റ് ഡെറ്റ് സെക്യൂരിറ്റികളിൽ നിന്ന് വ്യത്യസ്തമാക്കുന്ന ഒരു വർഷത്തിൽ കൂടുതൽ മെച്യൂരിറ്റി കാലയളവ് ഉണ്ടായിരിക്കും.
എന്താണ് മണി മാർക്കറ്റ്?
ചെറിയ മെച്യൂരിറ്റികളുള്ള (ഒരു വർഷത്തിൽ താഴെ) ഉയർന്നതും ഉയർന്നതുമായ സാമ്പത്തിക ഉപകരണങ്ങൾ ഉള്ള ഫിനാൻഷ്യൽ മാർക്കറ്റിന്റെ ഒരു വിഭാഗത്തെയാണ് മണി മാർക്കറ്റ് പൊതുവെ സൂചിപ്പിക്കുന്നത്.ദ്രവ്യത കച്ചവടം ചെയ്യപ്പെടുന്നു. ഇന്ത്യയ്ക്ക് വളരെ സജീവമായ പണവിപണിയുണ്ട്, അവിടെ ധാരാളം ഉപകരണങ്ങൾ വ്യാപാരം നടക്കുന്നു. ഇവിടെ നിങ്ങൾക്ക് മ്യൂച്വൽ ഫണ്ട് കമ്പനികളും സർക്കാർ ബാങ്കുകളും മറ്റ് വിവിധ വലിയ ആഭ്യന്തര സ്ഥാപനങ്ങളും പങ്കെടുക്കുന്നു. വാണിജ്യ പേപ്പറുകൾ, ട്രഷറി ബില്ലുകൾ തുടങ്ങിയ ഹ്രസ്വകാല സെക്യൂരിറ്റികൾ വാങ്ങുന്നതിനും വിൽക്കുന്നതിനുമുള്ള സാമ്പത്തിക വിപണിയുടെ ഒരു ഘടകമായി മണി മാർക്കറ്റ് മാറിയിരിക്കുന്നു.
മണി മാർക്കറ്റ് നിരക്കുകൾ
ഹ്രസ്വകാല മണി മാർക്കറ്റ് ഉപകരണങ്ങൾ വാഗ്ദാനം ചെയ്യുന്ന പലിശ നിരക്കുകളാണ് മണി മാർക്കറ്റ് നിരക്കുകൾ. ഈ ഉപകരണങ്ങൾക്ക് 1 ദിവസം മുതൽ ഒരു വർഷം വരെ കാലാവധിയുണ്ട്. ട്രഷറി ബില്ലുകൾ പോലുള്ള സങ്കീർണ്ണമായ ഉപകരണങ്ങളിൽ മണി മാർക്കറ്റ് നിരക്കുകൾ വ്യത്യാസപ്പെടുന്നു.വിളി പണം,വാണിജ്യ പേപ്പർ (സിപി), നിക്ഷേപങ്ങളുടെ സർട്ടിഫിക്കറ്റുകൾ (സിഡികൾ), റിപ്പോകൾ മുതലായവ. റിസർവ് ബാങ്ക് ഓഫ് ഇന്ത്യ (ആർബിഐ) ആണ് പണവിപണികളുടെ മേൽ അധികാരം.
2017 ഫെബ്രുവരി 28-ന് ആർബിഐ സൈറ്റിൽ നൽകിയിരിക്കുന്ന വിവിധ ഉപകരണങ്ങളുടെ മണി മാർക്കറ്റ് നിരക്കുകളുടെ ഒരു ഉദാഹരണം റഫറൻസിനായി ചുവടെയുണ്ട്.
| വോളിയം (ഒരു കാൽ) | വെയ്റ്റഡ് ശരാശരി നിരക്ക് | പരിധി | |
|---|---|---|---|
| എ. ഓവർനൈറ്റ് സെഗ്മെന്റ് (I+II+III+IV) | 4,00,659.36 | 3.25 | 0.01-5.30 |
| I. കോൾ മണി | 12,671.70 | 3.23 | 1.90-3.50 |
| II. ട്രൈപാർട്ടി റിപ്പോ | 2,79,349.70 | 3.26 | 2.00-3.45 |
| III. മാർക്കറ്റ് റിപ്പോ | 1,07,582.96 | 3.25 | 0.01-3.50 |
| IV. കോർപ്പറേറ്റ് ബോണ്ടിൽ റിപ്പോ | 1,055.00 | 3.56 | 3.40-5.30 |
| ബി. ടേം സെഗ്മെന്റ് | |||
| I. നോട്ടീസ് മണി** | 45.00 | 2.97 | 2.65-3.50 |
| II. ടേം മണി@@ | 311.00 | - | 3.15-3.45 |
| III. ട്രൈപാർട്ടി റിപ്പോ | 1,493.00 | 3.30 | 3.30-3.35 |
| IV. മാർക്കറ്റ് റിപ്പോ | 5,969.10 | 3.37 | 0.01-3.60 |
| കോർപ്പറേറ്റ് ബോണ്ടിലെ വി | 0.00 | - | - |
ഉറവിടം: മണി മാർക്കറ്റ് ഓപ്പറേഷൻസ്, ആർബിഐ തീയതി- തീയതി: 30 മാർച്ച് 2021
മ്യൂച്വൽ ഫണ്ട് കമ്പനികൾ മണി മാർക്കറ്റ് ഫണ്ടുകൾ വാഗ്ദാനം ചെയ്യുന്നു
മുകളിൽ പറഞ്ഞിരിക്കുന്ന വിവിധ തരം ഉപകരണങ്ങളെക്കുറിച്ച് നമ്മൾ പഠിച്ചതുപോലെ, ഒരു നിക്ഷേപകന് മണി മാർക്കറ്റ് ഫണ്ടുകളിൽ എങ്ങനെ നിക്ഷേപിക്കാമെന്ന് അറിയേണ്ടത് പ്രധാനമാണ്. 44 ഉണ്ട്എഎംസികൾ (അസറ്റ് മാനേജ്മെന്റ് കമ്പനികൾ) ഇന്ത്യയിൽ, അവയിൽ മിക്കതുംവഴിപാട് മണി മാർക്കറ്റ് ഫണ്ടുകൾ (പ്രധാനമായുംലിക്വിഡ് ഫണ്ടുകൾ നിക്ഷേപകർക്കുള്ള അൾട്രാ ഷോർട്ട് ഫണ്ടുകളും). നിക്ഷേപകർക്ക് ബാങ്കുകൾ, ബ്രോക്കർമാർ തുടങ്ങിയ വിതരണക്കാർ വഴിയും നിക്ഷേപിക്കാം. മണി മാർക്കറ്റ് ഫണ്ടുകളിൽ നിക്ഷേപിക്കുന്നതിന്, ബന്ധപ്പെട്ട നടപടിക്രമങ്ങളും പ്രസക്തമായ ആപ്ലിക്കേഷനുകളും പിന്തുടരേണ്ടതുണ്ട്. ഡെറ്റ് മ്യൂച്വൽ ഫണ്ടുകളുടെ നിബന്ധനകളും വ്യവസ്ഥകളും വ്യത്യാസപ്പെടാം, അതിനാൽ മൊത്തത്തിലുള്ള അറിവ് നേടുകയും തുടർന്ന് നിങ്ങളുടെ ആവശ്യങ്ങൾ നിറവേറ്റുന്ന ഒന്ന് തിരഞ്ഞെടുക്കുകയും ചെയ്യേണ്ടത് പ്രധാനമാണ്. മാത്രമല്ല, ഏതെങ്കിലും മണി മാർക്കറ്റ് മ്യൂച്വൽ ഫണ്ടുകളിൽ നിക്ഷേപിക്കുന്നതിനുമുമ്പ് അതിന്റെ നിക്ഷേപ ലക്ഷ്യങ്ങൾ, അപകടസാധ്യതകൾ, വരുമാനം, ചെലവുകൾ എന്നിവ ശ്രദ്ധാപൂർവ്വം പരിഗണിക്കുക.
പരിഗണിക്കേണ്ട ഘടകങ്ങൾ
ഇന്ത്യയിലെ മണി മാർക്കറ്റ് ഫണ്ടുകളിൽ നിക്ഷേപിക്കുന്നതിന് മുമ്പ് നിങ്ങൾ പരിഗണിക്കേണ്ട ചില പ്രധാന വശങ്ങൾ ഇതാ:
എ. റിസ്കുകളും റിട്ടേണുകളും
മണി മാർക്കറ്റ് ഫണ്ടുകളാണ്ഡെറ്റ് ഫണ്ട് അതിനാൽ പലിശ നിരക്ക് അപകടസാധ്യത, ക്രെഡിറ്റ് റിസ്ക് തുടങ്ങിയ ഡെറ്റ് ഫണ്ടുകൾക്ക് ബാധകമായ എല്ലാ അപകടസാധ്യതകളും വഹിക്കുക. കൂടാതെ, റിട്ടേൺ വർദ്ധിപ്പിക്കുന്നതിനായി ഫണ്ട് മാനേജർ അൽപ്പം ഉയർന്ന റിസ്ക് ഘടകങ്ങളുള്ള ഉപകരണങ്ങളിൽ നിക്ഷേപിച്ചേക്കാം. സാധാരണയായി, മണി മാർക്കറ്റ് ഫണ്ടുകൾ പതിവുള്ളതിനേക്കാൾ മികച്ച വരുമാനം വാഗ്ദാനം ചെയ്യുന്നുസേവിംഗ്സ് അക്കൗണ്ട്. മൊത്തം അസറ്റ് മൂല്യം അല്ലെങ്കിൽഅല്ല ഈ ഫണ്ടുകളുടെ പലിശ നിരക്ക് വ്യവസ്ഥയിൽ മാറ്റം വരുന്നു.
ബി. ചെലവ് അനുപാതം
റിട്ടേണുകൾ വളരെ ഉയർന്നതല്ലാത്തതിനാൽ, ചെലവ് അനുപാതം നിങ്ങളുടേത് നിർണ്ണയിക്കുന്നതിൽ ഒരു പ്രധാന പങ്ക് വഹിക്കുന്നുവരുമാനം ഒരു മണി മാർക്കറ്റ് ഫണ്ടിൽ നിന്ന്. ഫണ്ട് മാനേജ്മെന്റ് സേവനങ്ങൾക്കായി ഫണ്ട് ഹൗസ് ഈടാക്കുന്ന ഫണ്ടിന്റെ മൊത്തം ആസ്തിയുടെ ഒരു ചെറിയ ശതമാനമാണ് ചെലവ് അനുപാതം.
നിങ്ങളുടെ വരുമാനം പരമാവധിയാക്കാൻ കുറഞ്ഞ ചെലവ് അനുപാതമുള്ള ഫണ്ടുകൾക്കായി നിങ്ങൾ നോക്കണം.
സി. നിങ്ങളുടെ നിക്ഷേപ പദ്ധതി പ്രകാരം നിക്ഷേപിക്കുക
സാധാരണയായി, 90-365 ദിവസത്തെ നിക്ഷേപ ചക്രവാളമുള്ള നിക്ഷേപകർക്ക് മണി മാർക്കറ്റ് ഫണ്ടുകൾ ശുപാർശ ചെയ്യപ്പെടുന്നു. ഈ സ്കീമുകൾക്ക് നിങ്ങളുടെ പോർട്ട്ഫോളിയോ വൈവിധ്യവത്കരിക്കാനും പണലഭ്യത നിലനിർത്തിക്കൊണ്ടുതന്നെ അധിക പണം നിക്ഷേപിക്കാനും സഹായിക്കും. നിങ്ങളുടെ നിക്ഷേപത്തിനനുസരിച്ച് നിക്ഷേപിക്കുന്നുവെന്ന് ഉറപ്പാക്കുകനിക്ഷേപ പദ്ധതി.
ഡി. നികുതി
മണി മാർക്കറ്റ് ഫണ്ടുകളുടെ കാര്യത്തിൽ, നികുതി നിയമങ്ങൾ ഇപ്രകാരമാണ്:
മൂലധന നേട്ട നികുതി
നിങ്ങൾ മൂന്ന് വർഷം വരെ സ്കീമിന്റെ യൂണിറ്റുകൾ കൈവശം വയ്ക്കുകയാണെങ്കിൽ, പിന്നെമൂലധന നേട്ടം നിങ്ങൾ സമ്പാദിച്ചതിനെ ഹ്രസ്വകാല മൂലധന നേട്ടം അല്ലെങ്കിൽ STCG എന്ന് വിളിക്കുന്നു. STCG നിങ്ങളിലേക്ക് ചേർത്തുനികുതി ബാധ്യമായ വരുമാനം ബാധകമായ പ്രകാരം നികുതിയുംആദായ നികുതി സ്ലാബ്.
നിങ്ങൾ മൂന്ന് വർഷത്തിൽ കൂടുതൽ സ്കീമിന്റെ യൂണിറ്റുകൾ കൈവശം വെച്ചാൽ, നിങ്ങൾ നേടിയ മൂലധന നേട്ടങ്ങളെ ദീർഘകാല മൂലധന നേട്ടം അല്ലെങ്കിൽ LTCG എന്ന് വിളിക്കുന്നു. ഇൻഡക്സേഷൻ ആനുകൂല്യങ്ങളോടെ ഇതിന് 20% നികുതി ചുമത്തുന്നു.
22-23 സാമ്പത്തിക വർഷത്തിൽ നിക്ഷേപിക്കുന്നതിനുള്ള മികച്ച മണി മാർക്കറ്റ് ഫണ്ടുകൾ
ഇന്ത്യയിലെ ചില മികച്ച മണി മാർക്കറ്റ് ഫണ്ടുകൾ ഇനിപ്പറയുന്നവയാണ്-Fund NAV Net Assets (Cr) 3 MO (%) 6 MO (%) 1 YR (%) 3 YR (%) 2023 (%) Debt Yield (YTM) Mod. Duration Eff. Maturity UTI Money Market Fund Growth ₹3,043.35
↑ 0.84 ₹18,083 2.3 4.2 8 7.2 7.7 7.51% 6M 1D 6M 1D Franklin India Savings Fund Growth ₹49.521
↑ 0.02 ₹2,599 2.4 4.2 8 7 7.7 7.47% 6M 18D 7M 2D ICICI Prudential Money Market Fund Growth ₹374.547
↑ 0.11 ₹25,882 2.3 4.1 8 7.2 7.7 7.48% 7M 6D 7M 23D Nippon India Money Market Fund Growth ₹4,096.12
↑ 1.21 ₹16,856 2.3 4.1 8 7.2 7.8 7.63% 8M 2D 8M 20D Aditya Birla Sun Life Money Manager Fund Growth ₹365.168
↑ 0.11 ₹26,752 2.3 4.1 7.9 7.2 7.8 7.6% 6M 22D 6M 22D Note: Returns up to 1 year are on absolute basis & more than 1 year are on CAGR basis. as on 17 Apr 25
To provide highest possible current income consistent with preservation of capital and providing liquidity from investing in a diversified portfolio of short term money market securities. UTI Money Market Fund is a Debt - Money Market fund was launched on 13 Jul 09. It is a fund with Low risk and has given a Below is the key information for UTI Money Market Fund Returns up to 1 year are on (Erstwhile Franklin India Savings Plus Fund Retail Option) Aims to provide income consistent with the prudent risk from a portfolio comprising substantially of floating rate debt instruments, fixed rate debt instruments swapped for floating rate returns, and also fixed rate instruments and money market instruments. Franklin India Savings Fund is a Debt - Money Market fund was launched on 11 Feb 02. It is a fund with Moderately Low risk and has given a Below is the key information for Franklin India Savings Fund Returns up to 1 year are on The objective of the Plan will be to seek to provide reasonable returns, commensurate with low risk while providing a high level of liquidity, through investments made primarily in money market and debt securities. ICICI Prudential Money Market Fund is a Debt - Money Market fund was launched on 9 Mar 06. It is a fund with Low risk and has given a Below is the key information for ICICI Prudential Money Market Fund Returns up to 1 year are on (Erstwhile Reliance Liquidity Fund) The investment objective of the Scheme is to generate optimal returns consistent with moderate levels of risk and high liquidity. Accordingly, investments shall predominantly be made in Debt and Money Market Instruments. Nippon India Money Market Fund is a Debt - Money Market fund was launched on 16 Jun 05. It is a fund with Low risk and has given a Below is the key information for Nippon India Money Market Fund Returns up to 1 year are on (Erstwhile Aditya Birla Sun Life Floating Rate Fund - Short Term) The primary objective of the schemes is to generate regular income through investment in a portfolio comprising substantially of floating rate debt / money market instruments. The schemes may invest a portion of its net assets in fixed rate debt securities and money market instruments. Aditya Birla Sun Life Money Manager Fund is a Debt - Money Market fund was launched on 13 Oct 05. It is a fund with Low risk and has given a Below is the key information for Aditya Birla Sun Life Money Manager Fund Returns up to 1 year are on 1. UTI Money Market Fund
CAGR/Annualized return of 7.3% since its launch. Ranked 23 in Money Market category. Return for 2024 was 7.7% , 2023 was 7.4% and 2022 was 4.9% . UTI Money Market Fund
Growth Launch Date 13 Jul 09 NAV (17 Apr 25) ₹3,043.35 ↑ 0.84 (0.03 %) Net Assets (Cr) ₹18,083 on 28 Feb 25 Category Debt - Money Market AMC UTI Asset Management Company Ltd Rating ☆☆☆☆ Risk Low Expense Ratio 0.27 Sharpe Ratio 3.42 Information Ratio 0 Alpha Ratio 0 Min Investment 10,000 Min SIP Investment 500 Exit Load NIL Yield to Maturity 7.51% Effective Maturity 6 Months 1 Day Modified Duration 6 Months 1 Day Growth of 10,000 investment over the years.
Date Value 31 Mar 20 ₹10,000 31 Mar 21 ₹10,552 31 Mar 22 ₹10,963 31 Mar 23 ₹11,589 31 Mar 24 ₹12,470 31 Mar 25 ₹13,440 Returns for UTI Money Market Fund
absolute basis & more than 1 year are on CAGR (Compound Annual Growth Rate) basis. as on 17 Apr 25 Duration Returns 1 Month 1.2% 3 Month 2.3% 6 Month 4.2% 1 Year 8% 3 Year 7.2% 5 Year 6.2% 10 Year 15 Year Since launch 7.3% Historical performance (Yearly) on absolute basis
Year Returns 2023 7.7% 2022 7.4% 2021 4.9% 2020 3.7% 2019 6% 2018 8% 2017 7.8% 2016 6.7% 2015 7.7% 2014 8.4% Fund Manager information for UTI Money Market Fund
Name Since Tenure Anurag Mittal 1 Dec 21 3.25 Yr. Amit Sharma 7 Jul 17 7.65 Yr. Data below for UTI Money Market Fund as on 28 Feb 25
Asset Allocation
Asset Class Value Cash 82.6% Debt 17.15% Other 0.25% Debt Sector Allocation
Sector Value Corporate 46.79% Cash Equivalent 34.77% Government 18.19% Credit Quality
Rating Value AAA 100% Top Securities Holdings / Portfolio
Name Holding Value Quantity India (Republic of)
- | -3% ₹470 Cr 5,000,000,000
↑ 5,000,000,000 HDFC Bank Ltd.
Debentures | -2% ₹372 Cr 4,000,000,000
↑ 4,000,000,000 Axis Bank Ltd.
Debentures | -2% ₹326 Cr 3,500,000,000
↑ 3,500,000,000 Small Industries Development Bank of India
Debentures | -2% ₹325 Cr 3,500,000,000
↑ 3,500,000,000 Indian Bank
Domestic Bonds | -2% ₹279 Cr 3,000,000,000
↑ 3,000,000,000 India (Republic of)
- | -1% ₹235 Cr 2,500,000,000
↑ 2,500,000,000 Canara Bank
Domestic Bonds | -1% ₹233 Cr 2,500,000,000
↑ 2,500,000,000 182 DTB 27062025
Sovereign Bonds | -1% ₹196 Cr 2,000,000,000 364 DTB 12022026
Sovereign Bonds | -1% ₹189 Cr 2,000,000,000 364 DTB 27022026
Sovereign Bonds | -1% ₹188 Cr 2,000,000,000
↑ 2,000,000,000 2. Franklin India Savings Fund
CAGR/Annualized return of 7.1% since its launch. Ranked 47 in Money Market category. Return for 2024 was 7.7% , 2023 was 7.3% and 2022 was 4.4% . Franklin India Savings Fund
Growth Launch Date 11 Feb 02 NAV (17 Apr 25) ₹49.521 ↑ 0.02 (0.03 %) Net Assets (Cr) ₹2,599 on 28 Feb 25 Category Debt - Money Market AMC Franklin Templeton Asst Mgmt(IND)Pvt Ltd Rating ☆☆☆ Risk Moderately Low Expense Ratio 0.27 Sharpe Ratio 3.09 Information Ratio 0 Alpha Ratio 0 Min Investment 10,000 Min SIP Investment 500 Exit Load NIL Yield to Maturity 7.47% Effective Maturity 7 Months 2 Days Modified Duration 6 Months 18 Days Growth of 10,000 investment over the years.
Date Value 31 Mar 20 ₹10,000 31 Mar 21 ₹10,521 31 Mar 22 ₹10,910 31 Mar 23 ₹11,485 31 Mar 24 ₹12,344 31 Mar 25 ₹13,300 Returns for Franklin India Savings Fund
absolute basis & more than 1 year are on CAGR (Compound Annual Growth Rate) basis. as on 17 Apr 25 Duration Returns 1 Month 1.2% 3 Month 2.4% 6 Month 4.2% 1 Year 8% 3 Year 7% 5 Year 5.9% 10 Year 15 Year Since launch 7.1% Historical performance (Yearly) on absolute basis
Year Returns 2023 7.7% 2022 7.3% 2021 4.4% 2020 3.6% 2019 6% 2018 8.5% 2017 7.5% 2016 7.2% 2015 8.1% 2014 8.3% Fund Manager information for Franklin India Savings Fund
Name Since Tenure Rahul Goswami 6 Oct 23 1.4 Yr. Rohan Maru 10 Oct 24 0.39 Yr. Chandni Gupta 30 Apr 24 0.84 Yr. Data below for Franklin India Savings Fund as on 28 Feb 25
Asset Allocation
Asset Class Value Cash 64.34% Debt 35.42% Other 0.25% Debt Sector Allocation
Sector Value Corporate 42.61% Government 34.59% Cash Equivalent 22.56% Credit Quality
Rating Value AAA 100% Top Securities Holdings / Portfolio
Name Holding Value Quantity Export-Import Bank of India
Domestic Bonds | -9% ₹233 Cr 5,000
↑ 5,000 India (Republic of)
- | -8% ₹212 Cr 22,500,000
↑ 22,500,000 India (Republic of)
- | -5% ₹117 Cr 12,500,000
↑ 12,500,000 Canara Bank
Domestic Bonds | -3% ₹70 Cr 1,500
↑ 1,500 Indian Bank
Domestic Bonds | -3% ₹70 Cr 1,500
↑ 1,500 Kotak Mahindra Bank Ltd.
Debentures | -3% ₹70 Cr 1,500
↑ 1,500 Indian Bank
Domestic Bonds | -3% ₹70 Cr 1,500
↑ 1,500 HDFC Bank Ltd.
Debentures | -3% ₹70 Cr 1,500
↑ 1,500 Corporate Debt Market Development Fund Class A2
Investment Fund | -0% ₹6 Cr 5,772 364 DTB 22012026
Sovereign Bonds | -0% ₹3 Cr 316,500 3. ICICI Prudential Money Market Fund
CAGR/Annualized return of 7.2% since its launch. Ranked 17 in Money Market category. Return for 2024 was 7.7% , 2023 was 7.4% and 2022 was 4.7% . ICICI Prudential Money Market Fund
Growth Launch Date 9 Mar 06 NAV (17 Apr 25) ₹374.547 ↑ 0.11 (0.03 %) Net Assets (Cr) ₹25,882 on 28 Feb 25 Category Debt - Money Market AMC ICICI Prudential Asset Management Company Limited Rating ☆☆☆☆ Risk Low Expense Ratio 0.32 Sharpe Ratio 2.95 Information Ratio 0 Alpha Ratio 0 Min Investment 500 Min SIP Investment 100 Exit Load NIL Yield to Maturity 7.48% Effective Maturity 7 Months 23 Days Modified Duration 7 Months 6 Days Growth of 10,000 investment over the years.
Date Value 31 Mar 20 ₹10,000 31 Mar 21 ₹10,561 31 Mar 22 ₹10,963 31 Mar 23 ₹11,572 31 Mar 24 ₹12,450 31 Mar 25 ₹13,414 Returns for ICICI Prudential Money Market Fund
absolute basis & more than 1 year are on CAGR (Compound Annual Growth Rate) basis. as on 17 Apr 25 Duration Returns 1 Month 1.2% 3 Month 2.3% 6 Month 4.1% 1 Year 8% 3 Year 7.2% 5 Year 6.1% 10 Year 15 Year Since launch 7.2% Historical performance (Yearly) on absolute basis
Year Returns 2023 7.7% 2022 7.4% 2021 4.7% 2020 3.7% 2019 6.2% 2018 7.9% 2017 7.7% 2016 6.7% 2015 7.7% 2014 8.3% Fund Manager information for ICICI Prudential Money Market Fund
Name Since Tenure Manish Banthia 12 Jun 23 1.72 Yr. Nikhil Kabra 3 Aug 16 8.58 Yr. Data below for ICICI Prudential Money Market Fund as on 28 Feb 25
Asset Allocation
Asset Class Value Cash 83.1% Debt 16.62% Other 0.27% Debt Sector Allocation
Sector Value Corporate 45.53% Cash Equivalent 30.51% Government 23.68% Credit Quality
Rating Value AAA 100% Top Securities Holdings / Portfolio
Name Holding Value Quantity India (Republic of)
- | -7% ₹1,879 Cr 200,000,000
↑ 200,000,000 India (Republic of)
- | -2% ₹470 Cr 50,000,000
↑ 50,000,000 National Bank for Agriculture and Rural Development
Domestic Bonds | -1% ₹325 Cr 7,000
↑ 7,000 Small Industries Development Bank of India
Debentures | -1% ₹279 Cr 6,000
↑ 6,000 India (Republic of)
- | -1% ₹250 Cr 25,000,000
↓ -15,000,000 Muthoot Finance Ltd.
Debentures | -1% ₹185 Cr 4,000
↑ 4,000 08.22 Tn SDL 2025dec
Sovereign Bonds | -1% ₹146 Cr 14,500,000 08.20 GJ Sdl 2025dec
Sovereign Bonds | -1% ₹141 Cr 14,000,000 08.38 OD Sdl 2026
Sovereign Bonds | -1% ₹127 Cr 12,500,000 Bank of Baroda
Debentures | -0% ₹116 Cr 2,500
↑ 2,500 4. Nippon India Money Market Fund
CAGR/Annualized return of 7.4% since its launch. Ranked 27 in Money Market category. Return for 2024 was 7.8% , 2023 was 7.4% and 2022 was 5% . Nippon India Money Market Fund
Growth Launch Date 16 Jun 05 NAV (17 Apr 25) ₹4,096.12 ↑ 1.21 (0.03 %) Net Assets (Cr) ₹16,856 on 28 Feb 25 Category Debt - Money Market AMC Nippon Life Asset Management Ltd. Rating ☆☆☆ Risk Low Expense Ratio 0.37 Sharpe Ratio 2.85 Information Ratio 0 Alpha Ratio 0 Min Investment 5,000 Min SIP Investment 100 Exit Load NIL Yield to Maturity 7.63% Effective Maturity 8 Months 20 Days Modified Duration 8 Months 2 Days Growth of 10,000 investment over the years.
Date Value 31 Mar 20 ₹10,000 31 Mar 21 ₹10,540 31 Mar 22 ₹10,954 31 Mar 23 ₹11,584 31 Mar 24 ₹12,463 31 Mar 25 ₹13,425 Returns for Nippon India Money Market Fund
absolute basis & more than 1 year are on CAGR (Compound Annual Growth Rate) basis. as on 17 Apr 25 Duration Returns 1 Month 1.2% 3 Month 2.3% 6 Month 4.1% 1 Year 8% 3 Year 7.2% 5 Year 6.1% 10 Year 15 Year Since launch 7.4% Historical performance (Yearly) on absolute basis
Year Returns 2023 7.8% 2022 7.4% 2021 5% 2020 3.8% 2019 6% 2018 8.1% 2017 7.9% 2016 6.6% 2015 7.6% 2014 8.3% Fund Manager information for Nippon India Money Market Fund
Name Since Tenure Kinjal Desai 16 Jul 18 6.63 Yr. Vikash Agarwal 14 Sep 24 0.46 Yr. Data below for Nippon India Money Market Fund as on 28 Feb 25
Asset Allocation
Asset Class Value Cash 78.43% Debt 21.29% Other 0.27% Debt Sector Allocation
Sector Value Corporate 48.96% Cash Equivalent 30.14% Government 20.63% Credit Quality
Rating Value AAA 100% Top Securities Holdings / Portfolio
Name Holding Value Quantity HDFC Bank Ltd.
Debentures | -2% ₹372 Cr 8,000
↑ 8,000 Small Industries Development Bank of India
Debentures | -2% ₹279 Cr 6,000
↑ 6,000 364 DTB 27022026
Sovereign Bonds | -1% ₹235 Cr 25,000,000 India (Republic of)
- | -1% ₹235 Cr 25,000,000
↑ 25,000,000 India (Republic of)
- | -1% ₹235 Cr 25,000,000
↑ 25,000,000 Indusind Bank Ltd.
Debentures | -1% ₹232 Cr 5,000
↑ 5,000 Axis Bank Ltd.
Debentures | -1% ₹209 Cr 4,500
↑ 4,500 India (Republic of)
- | -1% ₹194 Cr 20,000,000
↑ 20,000,000 364 DTB 04122025
Sovereign Bonds | -1% ₹191 Cr 20,000,000 Small Industries Development Bank of India
Debentures | -1% ₹186 Cr 4,000
↑ 4,000 5. Aditya Birla Sun Life Money Manager Fund
CAGR/Annualized return of 6.9% since its launch. Ranked 7 in Money Market category. Return for 2024 was 7.8% , 2023 was 7.4% and 2022 was 4.8% . Aditya Birla Sun Life Money Manager Fund
Growth Launch Date 13 Oct 05 NAV (17 Apr 25) ₹365.168 ↑ 0.11 (0.03 %) Net Assets (Cr) ₹26,752 on 28 Feb 25 Category Debt - Money Market AMC Birla Sun Life Asset Management Co Ltd Rating ☆☆☆☆☆ Risk Low Expense Ratio 0.34 Sharpe Ratio 3.48 Information Ratio 0 Alpha Ratio 0 Min Investment 1,000 Min SIP Investment 1,000 Exit Load NIL Yield to Maturity 7.6% Effective Maturity 6 Months 22 Days Modified Duration 6 Months 22 Days Growth of 10,000 investment over the years.
Date Value 31 Mar 20 ₹10,000 31 Mar 21 ₹10,587 31 Mar 22 ₹11,008 31 Mar 23 ₹11,630 31 Mar 24 ₹12,519 31 Mar 25 ₹13,489 Returns for Aditya Birla Sun Life Money Manager Fund
absolute basis & more than 1 year are on CAGR (Compound Annual Growth Rate) basis. as on 17 Apr 25 Duration Returns 1 Month 1.1% 3 Month 2.3% 6 Month 4.1% 1 Year 7.9% 3 Year 7.2% 5 Year 6.2% 10 Year 15 Year Since launch 6.9% Historical performance (Yearly) on absolute basis
Year Returns 2023 7.8% 2022 7.4% 2021 4.8% 2020 3.8% 2019 6.6% 2018 8% 2017 7.9% 2016 6.8% 2015 7.7% 2014 8.4% Fund Manager information for Aditya Birla Sun Life Money Manager Fund
Name Since Tenure Kaustubh Gupta 15 Jul 11 13.64 Yr. Anuj Jain 22 Mar 21 3.94 Yr. Mohit Sharma 1 Apr 17 7.92 Yr. Data below for Aditya Birla Sun Life Money Manager Fund as on 28 Feb 25
Asset Allocation
Asset Class Value Cash 87.23% Debt 12.53% Other 0.25% Debt Sector Allocation
Sector Value Cash Equivalent 44.21% Corporate 42.1% Government 13.44% Credit Quality
Rating Value AAA 100% Top Securities Holdings / Portfolio
Name Holding Value Quantity 182 DTB 29082025
Sovereign Bonds | -4% ₹1,117 Cr 115,000,000 91 Days Tbill
Sovereign Bonds | -2% ₹496 Cr 50,000,000 91 DTB 10042025
Sovereign Bonds | -1% ₹388 Cr 39,000,000
↓ -25,000,000 India (Republic of)
- | -1% ₹291 Cr 30,000,000
↑ 30,000,000 National Bank for Agriculture and Rural Development
Domestic Bonds | -1% ₹256 Cr 5,500
↑ 5,500 7.59% Govt Stock 2026
Sovereign Bonds | -1% ₹232 Cr 23,000,000 Indian Bank
Domestic Bonds | -1% ₹186 Cr 4,000
↑ 4,000 HDFC Bank Ltd.
Debentures | -1% ₹186 Cr 4,000
↑ 4,000 08.16 KA Sdl 2025
Sovereign Bonds | -1% ₹182 Cr 18,000,000 08.14 KA Sdl 2025
Sovereign Bonds | -0% ₹131 Cr 13,000,000
ഉപസംഹാരം
മണി മാർക്കറ്റ് ഉപകരണങ്ങളെക്കുറിച്ച് നമ്മൾ പഠിച്ചിരിക്കുമ്പോൾ, ഡെറ്റ് മ്യൂച്വൽ ഫണ്ടുകളെക്കുറിച്ചും അവയുടെ തരങ്ങളെക്കുറിച്ചും വർഗ്ഗീകരണങ്ങളെക്കുറിച്ചും അറിയേണ്ടത് പ്രധാനമാണ്. ശരി, ഡെറ്റ് മ്യൂച്വൽ ഫണ്ടുകൾ ലിക്വിഡ് ഫണ്ടുകൾ, അൾട്രാ എന്നിങ്ങനെ പൊതുവായ വിശാലമായ വിഭാഗങ്ങളായി തരംതിരിച്ചിട്ടുണ്ട്ഹ്രസ്വകാല ഫണ്ടുകൾ, ഹ്രസ്വകാല ഫണ്ടുകൾ, ദീർഘകാല വരുമാന ഫണ്ടുകൾ കൂടാതെഗിൽറ്റ് ഫണ്ടുകൾ.
എന്നിരുന്നാലും, മണി മാർക്കറ്റ് ഫണ്ടുകളിൽ നിക്ഷേപിക്കുന്നതിന്, അതിന്റെ സാഹചര്യം മനസ്സിലാക്കേണ്ടത് വളരെ പ്രധാനമാണ്സമ്പദ്, പലിശനിരക്കുകളുടെ ദിശ, നിക്ഷേപം നടത്തുമ്പോൾ കോർപ്പറേറ്റ് കടത്തിലും സർക്കാർ കടത്തിലും ആദായത്തിന്റെ ചലനത്തിന്റെ പ്രതീക്ഷിത ദിശ.
ഇവിടെ നൽകിയിരിക്കുന്ന വിവരങ്ങൾ കൃത്യമാണെന്ന് ഉറപ്പാക്കാൻ എല്ലാ ശ്രമങ്ങളും നടത്തിയിട്ടുണ്ട്. എന്നിരുന്നാലും, ഡാറ്റയുടെ കൃത്യത സംബന്ധിച്ച് യാതൊരു ഉറപ്പും നൽകുന്നില്ല. എന്തെങ്കിലും നിക്ഷേപം നടത്തുന്നതിന് മുമ്പ് സ്കീം വിവര രേഖ ഉപയോഗിച്ച് പരിശോധിക്കുക.


?")


AMFI Registration No. 112358 | CIN: U74999MH2016PTC282153
Shepard Technologies Pvt. Ltd. (with ARN code 112358) makes no warranties or representations, express or implied, on products offered through the platform. It accepts no liability for any damages or losses, however caused, in connection with the use of, or on the reliance of its product or related services. Terms and conditions of the website are applicable.
©2025 Shepard Technologies Private Limited. All Rights Reserved