Table of Contents
Sensitivity Analysis
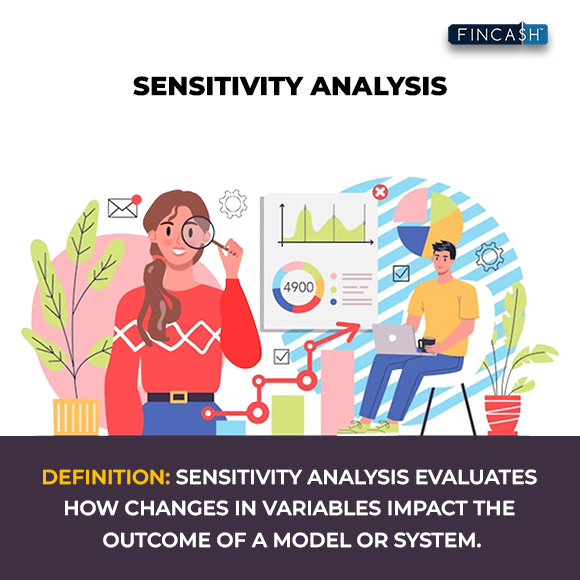
Sensitivity analysis is a concept that helps comprehend how diverse values of a sole variable impacts a specific dependent variable in the provided set of assumptions. In simple words, sensitivity analysis studies how varying sources of uncertainty in a mathematical model will contribute to the overall indecision of the model.

This technique is used in certain boundaries that depend on one or more input variables. It is also used in the world of business and the Economics fields. Economists and financial analysts prevalently use sensitivity analysis. It is also called what-if analysis.
Understanding How the Sensitivity Analysis Works
Sensitivity Analysis is a method that predicts the result of a decision provided by a specific Range of variables. With this set of variables, an analyst will determine how changes in a single variable can impact the result. The independent and dependent – or target and input – variables are evaluated whenever sensitivity analysis is performed. The expert performing this analysis looks at how these variables move, and the input variable impacts the target.
Sensitivity analysis is helpful when it comes to making predictions regarding the share prices of public organisations. Some variables affecting stock prices are:
- Company Earnings
- Number of outstanding shares
- Debt-to-Equity ratios (D/E)
- Number of competitors present in the Industry
Talk to our investment specialist
How is Sensitivity Analysis used?
Financial models that integrate sensitivity analysis can offer management a variety of feedback useful in varying scenarios. The span of how sensitivity analysis can be used is mentioned below:
- Comprehending Influencing Factors: This comprises what and how varying external factors intermingle with a certain undertaking or project.
- Decreasing Uncertainty: The models of complex sensitivity analysis spread education among users on varying elements that affect a project. In return, this informs members on a specific project regarding what can be alerted and what can be planned.
- Noticing Errors: By executing different iterations of analysis, the management can easily notice and catch errors in the real analysis.
- Streamlining the Model: Through sensitivity analysis, users can understand the factors that don’t matter; thus, they can be removed from the entire model.
- Communicating Outcomes: The upper management might be inquisitive or defensive regarding an undertaking. By compiling the analysis of different situations, decision-makers can get information about outcomes.
Advantages and Disadvantages of Sensitivity Analysis
Here are the pros and cons of sensitivity analysis:
| Pros of Sensitivity Analysis | Cons of Sensitivity Analysis |
|---|---|
| Offers varying output situations on the Basis of changing variables or risk | Heavily dependent on assumptions that may not turn true in the future |
| Can help management target certain inputs to accomplish better results | Might put a burden on computer systems with intensive, complicated models |
| Can effortlessly bring communicating areas to concentrate on bigger risks | Could be overly complex that might distort the ability of an analyst |
| Can discover mistakes and errors in the original benchmark | May not integrate independent variables accurately |
| Decreases the unpredictability and uncertainty of an undertaking | One variable may not affect another variable accurately |
Sensitivity Analysis Example
Let’s understand it better with an example of sensitivity analysis. Suppose you are a sales manager and want to understand the effect of customer traffic on total sales. Now, you will determine that sales are a part of transaction volume and price. The price of a commodity is Rs. 1,000, and you have sold 100 of them in the last year, thus, generating a total sale of Rs. 100,000.
You have also determined a 10% increase in the overall customer traffic, which increased the transaction volume up to 5%. This will let you develop a financial model and execute sensitivity analysis around the equation on the basis of what-if statements. It will tell you what will happen to sales in case the customer traffic increases by 10%, 50%, or even 100%.
On the basis of 100 transactions, a 10%, 50%, or 100% upsurge in customer traffic will equal an increase in transactions by almost 5%, 25%, or 50%.
Calculating Sensitivity Analysis Excel
Often, sensitivity analysis is performed in analysis software. Excel has an inbuilt function that helps to perform the analysis. Generally, sensitivity analysis is calculated by leveraging formulas that refer to varying input cells.
Two Types Sensitivity Analysis
There are two types of sensitivity analysis, such as:
Local Sensitivity Analysis: It evaluates the impact of a single parameter at the time when all the other parameters remain constant.
Global Sensitivity Analysis: It evaluates a broader analysis that is used in a more complicated situation.
Wrapping Up
Whenever an organisation wishes to comprehend varying possible results for a project, it might consider performing an analysis. With sensitivity analysis, several opportunities can be identified, risks can be mitigated, and communications can be managed with ease.
All efforts have been made to ensure the information provided here is accurate. However, no guarantees are made regarding correctness of data. Please verify with scheme information document before making any investment.


