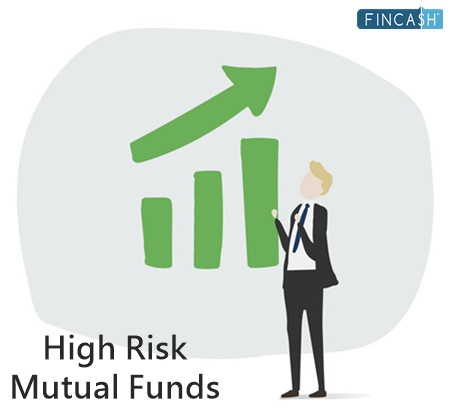
భారతదేశంలోని టాప్ 5 బెస్ట్ హై రిస్క్ మ్యూచువల్ ఫండ్లు
అధిక ప్రమాదంమ్యూచువల్ ఫండ్స్ భవిష్యత్తులో అధిక రాబడిని అందించే అవకాశం ఉన్న ఫండ్లను చూడండి.
ఇన్వెస్ట్మెంట్లో అధిక స్థాయి రిస్క్ తీసుకోవడానికి ఇష్టపడే పెట్టుబడిదారులకు ఆదర్శంగా ఉండే ఫండ్స్ ఇవి. కానీ, ఈ నిధులు చాలా అస్థిర స్వభావం కలిగి ఉంటాయి. అందుకే పోర్ట్ఫోలియోలో ఉన్న అధిక-రిస్క్ ఫండ్ను ఎప్పటికప్పుడు చురుకుగా నిర్వహించాల్సి ఉంటుంది. అధిక రిస్క్ మ్యూచువల్ ఫండ్లు సాధారణంగా పెట్టుబడిదారులకు గొప్ప డివిడెండ్లను అందిస్తాయి. అందువల్ల, మంచి రాబడిని సంపాదించడానికి మీరు అధిక-రిస్క్ తీసుకోవడానికి సిద్ధంగా ఉంటే, మీరు ప్రాధాన్యత ఇవ్వవచ్చుపెట్టుబడి పెడుతున్నారు ఈ లిస్టెడ్ ఫండ్లలో.
హై రిస్క్ ఇన్వెస్ట్మెంట్స్ అంటే ఏమిటి?
అధిక రిస్క్ ఫండ్లు దీర్ఘకాలిక సంపద సృష్టికి సహాయపడతాయి. ఒకరు తమ దీర్ఘకాలిక ప్రణాళికను కూడా చేసుకోవచ్చుఆర్థిక లక్ష్యాలు వంటివిపదవీ విరమణ, ఈ ఫండ్స్లో పెట్టుబడి పెట్టడం ద్వారా ప్రపంచ పర్యటన, కలల ఇంటి కొనుగోలు, వివాహం మొదలైనవి. అధిక రిస్క్ ఫండ్లు దీర్ఘకాలిక పెట్టుబడులు, ఇవి 5 సంవత్సరాల కంటే ఎక్కువ కాలం పాటు పెట్టుబడి పెట్టడానికి ఉద్దేశించబడ్డాయి.
మ్యూచువల్ ఫండ్స్ అటువంటి పెట్టుబడుల కోసం సూచించబడతాయిఈక్విటీ ఫండ్స్. ఈక్విటీ ఫండ్ అధిక-రిస్క్, అధిక రాబడి ఫండ్గా పరిగణించబడుతుంది. ఈక్విటీ ఫండ్స్ కంపెనీల స్టాక్లు/షేర్లలో పెట్టుబడి పెడతాయి. నేరుగా సంస్థను ప్రారంభించకుండా లేదా పెట్టుబడి పెట్టకుండా వ్యాపారాన్ని (చిన్న భాగంలో) స్వంతం చేసుకోవడానికి ఇది ఉత్తమ మార్గం. వంటి వివిధ రకాల ఈక్విటీ ఫండ్స్ ఉన్నాయిలార్జ్ క్యాప్ ఫండ్స్, మధ్య &స్మాల్ క్యాప్ ఫండ్స్,డైవర్సిఫైడ్ ఫండ్స్,రంగ నిధులు మరియుELSS (ఈక్విటీ లింక్డ్ సేవింగ్స్ స్కీములు).
బెస్ట్ హై రిస్క్ మ్యూచువల్ ఫండ్స్
మిడ్ & స్మాల్ క్యాప్ ఫండ్స్
మిడ్ & స్మాల్ క్యాప్ ఫండ్స్ వరుసగా మిడ్ & స్మాల్ (లేదా స్టార్టప్) కంపెనీలలో ఇన్వెస్ట్ చేస్తాయి. ఈ నిధులు అభివృద్ధి చెందుతున్న కంపెనీల స్టాక్ను కలిగి ఉన్నందున, అవి చాలా ప్రమాదకర స్వభావం కలిగి ఉంటాయి. కాబట్టి, దాదాపు 7-10 సంవత్సరాలు & అంతకంటే ఎక్కువ కాలం పెట్టుబడి పెట్టగల పెట్టుబడిదారులు ఈ ఫండ్స్లో మాత్రమే పెట్టుబడి పెట్టడానికి ఇష్టపడాలి. కంపెనీలు దీర్ఘకాలంలో బాగా ఉంటే, పెట్టుబడిదారులు మంచి రాబడిని పొందవచ్చు.
Fund NAV Net Assets (Cr) 3 MO (%) 6 MO (%) 1 YR (%) 3 YR (%) 5 YR (%) 2024 (%) Invesco India Mid Cap Fund Growth ₹184.76
↑ 1.81 ₹9,320 0.8 3.5 4.2 25.9 24.8 43.1 HDFC Mid-Cap Opportunities Fund Growth ₹202.339
↑ 1.61 ₹89,383 2.7 3.9 3.2 24.5 25.6 28.6 Edelweiss Mid Cap Fund Growth ₹103.673
↑ 0.92 ₹12,647 1.5 1.3 -1.1 24 25.4 38.9 Motilal Oswal Midcap 30 Fund Growth ₹100.406
↑ 1.27 ₹37,501 -5.6 -2.2 -12.6 23.3 28.4 57.1 Sundaram Mid Cap Fund Growth ₹1,426.73
↑ 12.36 ₹13,236 2.1 4.9 1 23.1 23.4 32 Note: Returns up to 1 year are on absolute basis & more than 1 year are on CAGR basis. as on 12 Dec 25 Research Highlights & Commentary of 5 Funds showcased
Commentary Invesco India Mid Cap Fund HDFC Mid-Cap Opportunities Fund Edelweiss Mid Cap Fund Motilal Oswal Midcap 30 Fund Sundaram Mid Cap Fund Point 1 Bottom quartile AUM (₹9,320 Cr). Highest AUM (₹89,383 Cr). Bottom quartile AUM (₹12,647 Cr). Upper mid AUM (₹37,501 Cr). Lower mid AUM (₹13,236 Cr). Point 2 Established history (18+ yrs). Established history (18+ yrs). Established history (17+ yrs). Established history (11+ yrs). Oldest track record among peers (23 yrs). Point 3 Rating: 2★ (bottom quartile). Rating: 3★ (upper mid). Rating: 3★ (lower mid). Rating: 3★ (bottom quartile). Top rated. Point 4 Risk profile: Moderately High. Risk profile: Moderately High. Risk profile: High. Risk profile: Moderately High. Risk profile: Moderately High. Point 5 5Y return: 24.79% (bottom quartile). 5Y return: 25.61% (upper mid). 5Y return: 25.39% (lower mid). 5Y return: 28.39% (top quartile). 5Y return: 23.43% (bottom quartile). Point 6 3Y return: 25.92% (top quartile). 3Y return: 24.48% (upper mid). 3Y return: 24.01% (lower mid). 3Y return: 23.28% (bottom quartile). 3Y return: 23.07% (bottom quartile). Point 7 1Y return: 4.23% (top quartile). 1Y return: 3.15% (upper mid). 1Y return: -1.14% (bottom quartile). 1Y return: -12.62% (bottom quartile). 1Y return: 1.03% (lower mid). Point 8 Alpha: 0.00 (upper mid). Alpha: 1.17 (top quartile). Alpha: -0.23 (bottom quartile). Alpha: -4.22 (bottom quartile). Alpha: -0.05 (lower mid). Point 9 Sharpe: 0.43 (top quartile). Sharpe: 0.15 (upper mid). Sharpe: 0.07 (bottom quartile). Sharpe: -0.13 (bottom quartile). Sharpe: 0.08 (lower mid). Point 10 Information ratio: 0.00 (bottom quartile). Information ratio: 0.61 (top quartile). Information ratio: 0.18 (lower mid). Information ratio: 0.20 (upper mid). Information ratio: 0.16 (bottom quartile). Invesco India Mid Cap Fund
HDFC Mid-Cap Opportunities Fund
Edelweiss Mid Cap Fund
Motilal Oswal Midcap 30 Fund
Sundaram Mid Cap Fund
సెక్టార్ ఫండ్స్
ఇవి రంగానికి సంబంధించిన ఫండ్లు, అంటే అవి ఇన్ఫ్రా, ఫార్మా, బ్యాంకింగ్ వంటి నిర్దిష్ట రంగంలో పెట్టుబడి పెడతాయి. ఇవి అధిక-రిస్క్ ఫండ్లు, అవి మీ డబ్బును రెట్టింపు చేయవచ్చు లేదా ఇబ్బంది పెట్టవచ్చు. కాబట్టి, అతను పెట్టుబడి పెట్టాలనుకునే రంగం యొక్క భవిష్యత్తు వృద్ధి గురించి అవగాహన ఉన్న పెట్టుబడిదారులు ఈ ఫండ్లలో పెట్టుబడి పెట్టడానికి మాత్రమే ఇష్టపడాలి.
Fund NAV Net Assets (Cr) 3 MO (%) 6 MO (%) 1 YR (%) 3 YR (%) 5 YR (%) 2024 (%) UTI Transportation & Logistics Fund Growth ₹294.196
↑ 1.52 ₹4,008 0.5 12.9 13.7 24.5 23 18.7 SBI Banking & Financial Services Fund Growth ₹45.6727
↑ 0.28 ₹9,273 7.3 7.2 13.7 18.9 17.3 19.6 ICICI Prudential Banking and Financial Services Fund Growth ₹139.32
↑ 0.56 ₹10,593 4.8 4.5 12 14.7 16.6 11.6 Nippon India Banking Fund Growth ₹662.358
↑ 3.01 ₹7,543 7 3.4 11.8 16.9 20.5 10.3 TATA Banking and Financial Services Fund Growth ₹45.0911
↑ 0.27 ₹3,125 6.2 3 11.3 15.7 16 9 Note: Returns up to 1 year are on absolute basis & more than 1 year are on CAGR basis. as on 12 Dec 25 Research Highlights & Commentary of 5 Funds showcased
Commentary UTI Transportation & Logistics Fund SBI Banking & Financial Services Fund ICICI Prudential Banking and Financial Services Fund Nippon India Banking Fund TATA Banking and Financial Services Fund Point 1 Bottom quartile AUM (₹4,008 Cr). Upper mid AUM (₹9,273 Cr). Highest AUM (₹10,593 Cr). Lower mid AUM (₹7,543 Cr). Bottom quartile AUM (₹3,125 Cr). Point 2 Established history (21+ yrs). Established history (10+ yrs). Established history (17+ yrs). Oldest track record among peers (22 yrs). Established history (9+ yrs). Point 3 Rating: 3★ (upper mid). Not Rated. Top rated. Rating: 3★ (lower mid). Not Rated. Point 4 Risk profile: High. Risk profile: High. Risk profile: High. Risk profile: High. Risk profile: High. Point 5 5Y return: 23.00% (top quartile). 5Y return: 17.29% (lower mid). 5Y return: 16.62% (bottom quartile). 5Y return: 20.54% (upper mid). 5Y return: 15.96% (bottom quartile). Point 6 3Y return: 24.50% (top quartile). 3Y return: 18.85% (upper mid). 3Y return: 14.71% (bottom quartile). 3Y return: 16.90% (lower mid). 3Y return: 15.73% (bottom quartile). Point 7 1Y return: 13.73% (top quartile). 1Y return: 13.67% (upper mid). 1Y return: 11.98% (lower mid). 1Y return: 11.79% (bottom quartile). 1Y return: 11.30% (bottom quartile). Point 8 Alpha: 0.00 (upper mid). Alpha: 0.79 (top quartile). Alpha: -2.18 (lower mid). Alpha: -2.56 (bottom quartile). Alpha: -2.40 (bottom quartile). Point 9 Sharpe: 0.60 (upper mid). Sharpe: 0.70 (top quartile). Sharpe: 0.44 (bottom quartile). Sharpe: 0.45 (bottom quartile). Sharpe: 0.47 (lower mid). Point 10 Information ratio: 0.00 (bottom quartile). Information ratio: 0.74 (top quartile). Information ratio: 0.26 (bottom quartile). Information ratio: 0.64 (upper mid). Information ratio: 0.47 (lower mid). UTI Transportation & Logistics Fund
SBI Banking & Financial Services Fund
ICICI Prudential Banking and Financial Services Fund
Nippon India Banking Fund
TATA Banking and Financial Services Fund
Talk to our investment specialist
డైవర్సిఫైడ్ ఫండ్స్ లేదా మల్టీ క్యాప్ ఫండ్స్
ఈ ఫండ్స్ అన్నింటిలో పెట్టుబడి పెడతాయిసంత క్యాప్- లార్జ్ క్యాప్, మిడ్ & స్మాల్ క్యాప్ ఫండ్స్. దాని పెట్టుబడి సాంకేతికత కారణంగా, వారు పోర్ట్ఫోలియోను బ్యాలెన్స్ చేయడంలో ప్రావీణ్యం సంపాదించారు. దీని కారణంగా ప్రమాదం మధ్యస్తంగా ఉంటుంది. ఒక ఫండ్ బాగా పని చేయడంలో విఫలమైతే, మిగిలినవి పోర్ట్ఫోలియోను బ్యాలెన్స్ చేయడానికి ఉన్నాయి. పెట్టుబడిదారులు ఆదర్శంగా కనీసం 5 సంవత్సరాలు & అంతకంటే ఎక్కువ కాలం పెట్టుబడి పెట్టాలి.
Fund NAV Net Assets (Cr) 3 MO (%) 6 MO (%) 1 YR (%) 3 YR (%) 5 YR (%) 2024 (%) Nippon India Multi Cap Fund Growth ₹301.585
↑ 1.94 ₹49,314 -1 -0.5 -0.3 20.9 25.6 25.8 HDFC Equity Fund Growth ₹2,073.28
↑ 10.53 ₹91,041 2.6 4.5 7.8 20.7 24 23.5 Motilal Oswal Multicap 35 Fund Growth ₹61.0731
↑ 0.65 ₹14,319 -4.1 -0.7 -6.7 20.3 15.8 45.7 JM Multicap Fund Growth ₹97.0281
↑ 0.79 ₹6,080 -2.4 -1.7 -10.4 19 20.6 33.3 Mahindra Badhat Yojana Growth ₹35.739
↑ 0.28 ₹6,055 1.2 2.3 0.4 18.5 21.8 23.4 Note: Returns up to 1 year are on absolute basis & more than 1 year are on CAGR basis. as on 12 Dec 25 Research Highlights & Commentary of 5 Funds showcased
Commentary Nippon India Multi Cap Fund HDFC Equity Fund Motilal Oswal Multicap 35 Fund JM Multicap Fund Mahindra Badhat Yojana Point 1 Upper mid AUM (₹49,314 Cr). Highest AUM (₹91,041 Cr). Lower mid AUM (₹14,319 Cr). Bottom quartile AUM (₹6,080 Cr). Bottom quartile AUM (₹6,055 Cr). Point 2 Established history (20+ yrs). Oldest track record among peers (30 yrs). Established history (11+ yrs). Established history (17+ yrs). Established history (8+ yrs). Point 3 Rating: 2★ (bottom quartile). Rating: 3★ (lower mid). Top rated. Rating: 4★ (upper mid). Not Rated. Point 4 Risk profile: Moderately High. Risk profile: Moderately High. Risk profile: Moderately High. Risk profile: Moderately High. Risk profile: Moderately High. Point 5 5Y return: 25.59% (top quartile). 5Y return: 24.04% (upper mid). 5Y return: 15.84% (bottom quartile). 5Y return: 20.59% (bottom quartile). 5Y return: 21.76% (lower mid). Point 6 3Y return: 20.89% (top quartile). 3Y return: 20.70% (upper mid). 3Y return: 20.26% (lower mid). 3Y return: 19.04% (bottom quartile). 3Y return: 18.50% (bottom quartile). Point 7 1Y return: -0.31% (lower mid). 1Y return: 7.83% (top quartile). 1Y return: -6.72% (bottom quartile). 1Y return: -10.39% (bottom quartile). 1Y return: 0.37% (upper mid). Point 8 Alpha: -0.58 (bottom quartile). Alpha: 3.93 (top quartile). Alpha: 0.60 (upper mid). Alpha: -10.27 (bottom quartile). Alpha: 0.43 (lower mid). Point 9 Sharpe: -0.07 (bottom quartile). Sharpe: 0.39 (top quartile). Sharpe: 0.05 (upper mid). Sharpe: -0.64 (bottom quartile). Sharpe: 0.00 (lower mid). Point 10 Information ratio: 0.64 (lower mid). Information ratio: 1.44 (top quartile). Information ratio: 0.57 (bottom quartile). Information ratio: 0.89 (upper mid). Information ratio: 0.13 (bottom quartile). Nippon India Multi Cap Fund
HDFC Equity Fund
Motilal Oswal Multicap 35 Fund
JM Multicap Fund
Mahindra Badhat Yojana
లార్జ్ క్యాప్ ఫండ్స్
ఇవి భారతదేశంలోని పెద్ద-పరిమాణ కంపెనీలలో పెట్టుబడి పెట్టే ఫండ్స్. ఇవి పరిశ్రమలో అగ్రగామిగా ఉన్న సంస్థలు మరియు స్థిరమైన రాబడికి ప్రసిద్ధి చెందాయి. లార్జ్ క్యాప్ ఫండ్స్ మిడ్ & స్మాల్ క్యాప్ల కంటే తక్కువ రిస్క్ ఉన్న పెద్ద కంపెనీలలో పెట్టుబడి పెడతాయి. కానీ, ఈక్విటీ ఫండ్ అయినందున, రిస్క్ ఎల్లప్పుడూ ఉంటుంది. మితమైన మరియు అధిక స్థాయి రిస్క్ను భరించగలిగే పెట్టుబడిదారులు మరియు 5 సంవత్సరాలు & అంతకంటే ఎక్కువ కాలం పాటు పెట్టుబడి పెట్టగలిగే పెట్టుబడిదారులు ఈ పథకాలలో పెట్టుబడి పెట్టవచ్చు.
Fund NAV Net Assets (Cr) 3 MO (%) 6 MO (%) 1 YR (%) 3 YR (%) 5 YR (%) 2024 (%) Nippon India Large Cap Fund Growth ₹94.0548
↑ 0.55 ₹48,871 2 2.9 4.2 18.3 20.8 18.2 ICICI Prudential Bluechip Fund Growth ₹115.49
↑ 0.75 ₹75,863 3.8 5.8 7.3 17.6 18.7 16.9 HDFC Top 100 Fund Growth ₹1,175.92
↑ 7.65 ₹39,779 2.7 2.7 2.7 15 17.7 11.6 TATA Large Cap Fund Growth ₹525.104
↑ 3.60 ₹2,790 3.8 3.6 3.8 14.1 16.7 12.9 Invesco India Largecap Fund Growth ₹70.99
↑ 0.45 ₹1,686 0.7 1.6 0.6 16.1 16.4 20 Note: Returns up to 1 year are on absolute basis & more than 1 year are on CAGR basis. as on 12 Dec 25 Research Highlights & Commentary of 5 Funds showcased
Commentary Nippon India Large Cap Fund ICICI Prudential Bluechip Fund HDFC Top 100 Fund TATA Large Cap Fund Invesco India Largecap Fund Point 1 Upper mid AUM (₹48,871 Cr). Highest AUM (₹75,863 Cr). Lower mid AUM (₹39,779 Cr). Bottom quartile AUM (₹2,790 Cr). Bottom quartile AUM (₹1,686 Cr). Point 2 Established history (18+ yrs). Established history (17+ yrs). Oldest track record among peers (29 yrs). Established history (27+ yrs). Established history (16+ yrs). Point 3 Top rated. Rating: 4★ (upper mid). Rating: 3★ (lower mid). Rating: 3★ (bottom quartile). Rating: 3★ (bottom quartile). Point 4 Risk profile: Moderately High. Risk profile: Moderately High. Risk profile: Moderately High. Risk profile: Moderately High. Risk profile: Moderately High. Point 5 5Y return: 20.77% (top quartile). 5Y return: 18.68% (upper mid). 5Y return: 17.65% (lower mid). 5Y return: 16.69% (bottom quartile). 5Y return: 16.42% (bottom quartile). Point 6 3Y return: 18.31% (top quartile). 3Y return: 17.58% (upper mid). 3Y return: 14.98% (bottom quartile). 3Y return: 14.09% (bottom quartile). 3Y return: 16.15% (lower mid). Point 7 1Y return: 4.16% (upper mid). 1Y return: 7.26% (top quartile). 1Y return: 2.71% (bottom quartile). 1Y return: 3.79% (lower mid). 1Y return: 0.58% (bottom quartile). Point 8 Alpha: 0.46 (upper mid). Alpha: 0.55 (top quartile). Alpha: -2.94 (bottom quartile). Alpha: -0.86 (bottom quartile). Alpha: 0.09 (lower mid). Point 9 Sharpe: 0.15 (top quartile). Sharpe: 0.12 (upper mid). Sharpe: -0.20 (bottom quartile). Sharpe: 0.00 (bottom quartile). Sharpe: 0.08 (lower mid). Point 10 Information ratio: 1.44 (top quartile). Information ratio: 1.23 (upper mid). Information ratio: 0.60 (bottom quartile). Information ratio: 0.37 (bottom quartile). Information ratio: 0.72 (lower mid). Nippon India Large Cap Fund
ICICI Prudential Bluechip Fund
HDFC Top 100 Fund
TATA Large Cap Fund
Invesco India Largecap Fund
To generate capital appreciation and income distribution to unit holders by investing predominantly in equity/equity related securities of the companies belonging to the infrastructure development and balance in debt securities and money market instruments. Below is the key information for ICICI Prudential Infrastructure Fund Returns up to 1 year are on (Erstwhile Motilal Oswal MOSt Focused Midcap 30 Fund) The investment objective of the Scheme is to achieve long term capital appreciation by investing in a maximum of 30 quality mid-cap companies having long-term competitive advantages and potential for growth. However, there can be no assurance or guarantee that the investment objective of the Scheme would be achieved. Research Highlights for Motilal Oswal Midcap 30 Fund Below is the key information for Motilal Oswal Midcap 30 Fund Returns up to 1 year are on The objective of the scheme would be to provide investors with opportunities for long-term growth in capital along with the liquidity of an open-ended scheme through an active management of investments in a diversified basket of equity stocks of domestic Public Sector Undertakings and in debt and money market instruments issued by PSUs AND others. Research Highlights for SBI PSU Fund Below is the key information for SBI PSU Fund Returns up to 1 year are on To seek long-term capital appreciation by investing predominantly in equity and equity related securities of companies engaged in or expected to benefit from growth and development of infrastructure. Research Highlights for HDFC Infrastructure Fund Below is the key information for HDFC Infrastructure Fund Returns up to 1 year are on The primary investment objective of the scheme is to generate long term capital appreciation by investing predominantly in equity and equity related instruments of small cap companies and the secondary objective is to generate consistent returns by investing in debt and money market securities. Research Highlights for Nippon India Small Cap Fund Below is the key information for Nippon India Small Cap Fund Returns up to 1 year are on 1. ICICI Prudential Infrastructure Fund
ICICI Prudential Infrastructure Fund
Growth Launch Date 31 Aug 05 NAV (12 Dec 25) ₹194.78 ↑ 1.57 (0.81 %) Net Assets (Cr) ₹8,232 on 31 Oct 25 Category Equity - Sectoral AMC ICICI Prudential Asset Management Company Limited Rating ☆☆☆ Risk High Expense Ratio 1.89 Sharpe Ratio 0 Information Ratio 0 Alpha Ratio 0 Min Investment 5,000 Min SIP Investment 100 Exit Load 0-1 Years (1%),1 Years and above(NIL) Growth of 10,000 investment over the years.
Date Value 30 Nov 20 ₹10,000 30 Nov 21 ₹16,536 30 Nov 22 ₹21,423 30 Nov 23 ₹28,347 30 Nov 24 ₹40,177 30 Nov 25 ₹42,083 Returns for ICICI Prudential Infrastructure Fund
absolute basis & more than 1 year are on CAGR (Compound Annual Growth Rate) basis. as on 12 Dec 25 Duration Returns 1 Month -2.4% 3 Month 0.5% 6 Month -0.5% 1 Year 0% 3 Year 23.9% 5 Year 30.4% 10 Year 15 Year Since launch 15.8% Historical performance (Yearly) on absolute basis
Year Returns 2024 27.4% 2023 44.6% 2022 28.8% 2021 50.1% 2020 3.6% 2019 2.6% 2018 -14% 2017 40.8% 2016 2% 2015 -3.4% Fund Manager information for ICICI Prudential Infrastructure Fund
Name Since Tenure Ihab Dalwai 3 Jun 17 8.42 Yr. Sharmila D’mello 30 Jun 22 3.34 Yr. Data below for ICICI Prudential Infrastructure Fund as on 31 Oct 25
Equity Sector Allocation
Sector Value Industrials 38.24% Financial Services 14.97% Basic Materials 12.93% Energy 10.52% Utility 10.49% Real Estate 2.69% Consumer Cyclical 1.96% Communication Services 1.25% Asset Allocation
Asset Class Value Cash 5.98% Equity 93.94% Debt 0.08% Top Securities Holdings / Portfolio
Name Holding Value Quantity Larsen & Toubro Ltd (Industrials)
Equity, Since 30 Nov 09 | LT9% ₹743 Cr 1,843,204 NTPC Ltd (Utilities)
Equity, Since 29 Feb 16 | 5325554% ₹370 Cr 10,976,448
↑ 646,975 NCC Ltd (Industrials)
Equity, Since 31 Aug 21 | NCC3% ₹277 Cr 13,053,905 Adani Ports & Special Economic Zone Ltd (Industrials)
Equity, Since 31 May 24 | ADANIPORTS3% ₹269 Cr 1,854,934 Reliance Industries Ltd (Energy)
Equity, Since 31 Jul 23 | RELIANCE3% ₹265 Cr 1,779,725
↓ -250,000 Axis Bank Ltd (Financial Services)
Equity, Since 31 Dec 20 | 5322153% ₹246 Cr 1,996,057 Vedanta Ltd (Basic Materials)
Equity, Since 31 Jul 24 | 5002953% ₹232 Cr 4,700,000
↓ -1,579,591 AIA Engineering Ltd (Industrials)
Equity, Since 28 Feb 21 | AIAENG3% ₹228 Cr 701,953
↑ 41,183 Kalpataru Projects International Ltd (Industrials)
Equity, Since 30 Sep 06 | KPIL3% ₹227 Cr 1,803,566 IndusInd Bank Ltd (Financial Services)
Equity, Since 31 Oct 24 | INDUSINDBK2% ₹193 Cr 2,424,016
↑ 450,000 2. Motilal Oswal Midcap 30 Fund
Motilal Oswal Midcap 30 Fund
Growth Launch Date 24 Feb 14 NAV (12 Dec 25) ₹100.406 ↑ 1.27 (1.28 %) Net Assets (Cr) ₹37,501 on 31 Oct 25 Category Equity - Mid Cap AMC Motilal Oswal Asset Management Co. Ltd Rating ☆☆☆ Risk Moderately High Expense Ratio 1.56 Sharpe Ratio -0.13 Information Ratio 0.2 Alpha Ratio -4.22 Min Investment 5,000 Min SIP Investment 500 Exit Load 0-1 Years (1%),1 Years and above(NIL) Growth of 10,000 investment over the years.
Date Value 30 Nov 20 ₹10,000 30 Nov 21 ₹15,596 30 Nov 22 ₹18,569 30 Nov 23 ₹24,148 30 Nov 24 ₹38,652 30 Nov 25 ₹36,880 Returns for Motilal Oswal Midcap 30 Fund
absolute basis & more than 1 year are on CAGR (Compound Annual Growth Rate) basis. as on 12 Dec 25 Duration Returns 1 Month -3.8% 3 Month -5.6% 6 Month -2.2% 1 Year -12.6% 3 Year 23.3% 5 Year 28.4% 10 Year 15 Year Since launch 21.5% Historical performance (Yearly) on absolute basis
Year Returns 2024 57.1% 2023 41.7% 2022 10.7% 2021 55.8% 2020 9.3% 2019 9.7% 2018 -12.7% 2017 30.8% 2016 5.2% 2015 16.5% Fund Manager information for Motilal Oswal Midcap 30 Fund
Name Since Tenure Ajay Khandelwal 1 Oct 24 1.08 Yr. Niket Shah 1 Jul 20 5.34 Yr. Rakesh Shetty 22 Nov 22 2.94 Yr. Sunil Sawant 1 Jul 24 1.34 Yr. Data below for Motilal Oswal Midcap 30 Fund as on 31 Oct 25
Equity Sector Allocation
Sector Value Technology 40.62% Consumer Cyclical 22.89% Industrials 12.61% Communication Services 3.47% Financial Services 3.46% Real Estate 2.56% Health Care 1.61% Asset Allocation
Asset Class Value Cash 12.78% Equity 87.22% Top Securities Holdings / Portfolio
Name Holding Value Quantity Persistent Systems Ltd (Technology)
Equity, Since 31 Jan 23 | PERSISTENT9% ₹3,550 Cr 6,000,000 Coforge Ltd (Technology)
Equity, Since 31 Mar 23 | COFORGE9% ₹3,494 Cr 19,650,699
↓ -99,301 One97 Communications Ltd (Technology)
Equity, Since 30 Sep 24 | 5433969% ₹3,258 Cr 25,000,000 Dixon Technologies (India) Ltd (Technology)
Equity, Since 31 Mar 23 | DIXON9% ₹3,254 Cr 2,100,000
↑ 62,479 Eternal Ltd (Consumer Cyclical)
Equity, Since 31 Aug 25 | 5433208% ₹3,178 Cr 100,000,000 Kalyan Jewellers India Ltd (Consumer Cyclical)
Equity, Since 29 Feb 24 | KALYANKJIL8% ₹3,058 Cr 60,000,000 Trent Ltd (Consumer Cyclical)
Equity, Since 30 Nov 24 | 5002516% ₹2,347 Cr 4,999,694 Polycab India Ltd (Industrials)
Equity, Since 30 Sep 23 | POLYCAB5% ₹2,060 Cr 2,673,670
↓ -476,330 Kaynes Technology India Ltd (Technology)
Equity, Since 30 Jun 25 | KAYNES4% ₹1,676 Cr 2,500,000
↑ 150,000 KEI Industries Ltd (Industrials)
Equity, Since 30 Nov 24 | KEI4% ₹1,613 Cr 4,000,000 3. SBI PSU Fund
SBI PSU Fund
Growth Launch Date 7 Jul 10 NAV (12 Dec 25) ₹33.0142 ↑ 0.32 (0.97 %) Net Assets (Cr) ₹5,714 on 31 Oct 25 Category Equity - Sectoral AMC SBI Funds Management Private Limited Rating ☆☆ Risk High Expense Ratio 1.89 Sharpe Ratio 0.09 Information Ratio -0.57 Alpha Ratio -0.58 Min Investment 5,000 Min SIP Investment 500 Exit Load 0-1 Years (1%),1 Years and above(NIL) Growth of 10,000 investment over the years.
Date Value 30 Nov 20 ₹10,000 30 Nov 21 ₹13,886 30 Nov 22 ₹18,323 30 Nov 23 ₹23,973 30 Nov 24 ₹36,302 30 Nov 25 ₹38,023 Returns for SBI PSU Fund
absolute basis & more than 1 year are on CAGR (Compound Annual Growth Rate) basis. as on 12 Dec 25 Duration Returns 1 Month -3.4% 3 Month 3.8% 6 Month 0.1% 1 Year -0.3% 3 Year 26% 5 Year 28.3% 10 Year 15 Year Since launch 8% Historical performance (Yearly) on absolute basis
Year Returns 2024 23.5% 2023 54% 2022 29% 2021 32.4% 2020 -10% 2019 6% 2018 -23.8% 2017 21.9% 2016 16.2% 2015 -11.1% Fund Manager information for SBI PSU Fund
Name Since Tenure Rohit Shimpi 1 Jun 24 1.42 Yr. Data below for SBI PSU Fund as on 31 Oct 25
Equity Sector Allocation
Sector Value Financial Services 37.03% Utility 29.3% Energy 13.78% Industrials 12.67% Basic Materials 5.75% Asset Allocation
Asset Class Value Cash 1.48% Equity 98.52% Top Securities Holdings / Portfolio
Name Holding Value Quantity State Bank of India (Financial Services)
Equity, Since 31 Jul 10 | SBIN16% ₹930 Cr 9,927,500 Bharat Electronics Ltd (Industrials)
Equity, Since 30 Jun 24 | BEL10% ₹553 Cr 12,975,000 NTPC Ltd (Utilities)
Equity, Since 31 Jul 10 | 5325559% ₹490 Cr 14,543,244 Power Grid Corp Of India Ltd (Utilities)
Equity, Since 31 Jul 10 | 5328988% ₹476 Cr 16,535,554 GAIL (India) Ltd (Utilities)
Equity, Since 31 May 24 | 5321558% ₹471 Cr 25,750,000 Bharat Petroleum Corp Ltd (Energy)
Equity, Since 31 Aug 24 | 5005476% ₹346 Cr 9,700,000 Bank of Baroda (Financial Services)
Equity, Since 31 Aug 24 | 5321345% ₹306 Cr 11,000,000 NMDC Ltd (Basic Materials)
Equity, Since 31 Oct 23 | 5263714% ₹211 Cr 27,900,000 Indian Bank (Financial Services)
Equity, Since 30 Jun 21 | 5328144% ₹208 Cr 2,427,235 Oil India Ltd (Energy)
Equity, Since 31 Mar 24 | OIL3% ₹167 Cr 3,850,000 4. HDFC Infrastructure Fund
HDFC Infrastructure Fund
Growth Launch Date 10 Mar 08 NAV (12 Dec 25) ₹47.054 ↑ 0.41 (0.87 %) Net Assets (Cr) ₹2,586 on 31 Oct 25 Category Equity - Sectoral AMC HDFC Asset Management Company Limited Rating ☆☆☆ Risk High Expense Ratio 2.06 Sharpe Ratio -0.15 Information Ratio 0 Alpha Ratio 0 Min Investment 5,000 Min SIP Investment 300 Exit Load 0-1 Years (1%),1 Years and above(NIL) Growth of 10,000 investment over the years.
Date Value 30 Nov 20 ₹10,000 30 Nov 21 ₹16,017 30 Nov 22 ₹19,623 30 Nov 23 ₹27,687 30 Nov 24 ₹38,227 30 Nov 25 ₹38,951 Returns for HDFC Infrastructure Fund
absolute basis & more than 1 year are on CAGR (Compound Annual Growth Rate) basis. as on 12 Dec 25 Duration Returns 1 Month -3.6% 3 Month -1.3% 6 Month -3.1% 1 Year -4.3% 3 Year 23.7% 5 Year 28% 10 Year 15 Year Since launch Historical performance (Yearly) on absolute basis
Year Returns 2024 23% 2023 55.4% 2022 19.3% 2021 43.2% 2020 -7.5% 2019 -3.4% 2018 -29% 2017 43.3% 2016 -1.9% 2015 -2.5% Fund Manager information for HDFC Infrastructure Fund
Name Since Tenure Dhruv Muchhal 22 Jun 23 2.36 Yr. Ashish Shah 1 Nov 25 0 Yr. Data below for HDFC Infrastructure Fund as on 31 Oct 25
Equity Sector Allocation
Sector Value Industrials 39.38% Financial Services 19.46% Basic Materials 10.52% Utility 6.92% Energy 6.63% Communication Services 3.84% Real Estate 2.42% Health Care 1.78% Technology 1.47% Consumer Cyclical 0.55% Asset Allocation
Asset Class Value Cash 7.03% Equity 92.97% Top Securities Holdings / Portfolio
Name Holding Value Quantity Larsen & Toubro Ltd (Industrials)
Equity, Since 30 Jun 12 | LT6% ₹153 Cr 380,000 ICICI Bank Ltd (Financial Services)
Equity, Since 31 Oct 09 | ICICIBANK6% ₹148 Cr 1,100,000 HDFC Bank Ltd (Financial Services)
Equity, Since 31 Aug 23 | HDFCBANK5% ₹138 Cr 1,400,000 Kalpataru Projects International Ltd (Industrials)
Equity, Since 31 Jan 23 | KPIL4% ₹95 Cr 758,285 J Kumar Infraprojects Ltd (Industrials)
Equity, Since 31 Oct 15 | JKIL4% ₹92 Cr 1,400,000 InterGlobe Aviation Ltd (Industrials)
Equity, Since 31 Dec 21 | INDIGO3% ₹84 Cr 150,000 Reliance Industries Ltd (Energy)
Equity, Since 31 May 24 | RELIANCE3% ₹74 Cr 500,000 NTPC Ltd (Utilities)
Equity, Since 31 Dec 17 | 5325553% ₹74 Cr 2,200,000 Bharti Airtel Ltd (Communication Services)
Equity, Since 30 Sep 20 | BHARTIARTL3% ₹72 Cr 350,000 State Bank of India (Financial Services)
Equity, Since 31 Mar 08 | SBIN3% ₹66 Cr 704,361 5. Nippon India Small Cap Fund
Nippon India Small Cap Fund
Growth Launch Date 16 Sep 10 NAV (12 Dec 25) ₹165.332 ↑ 1.11 (0.67 %) Net Assets (Cr) ₹68,969 on 31 Oct 25 Category Equity - Small Cap AMC Nippon Life Asset Management Ltd. Rating ☆☆☆☆ Risk Moderately High Expense Ratio 1.44 Sharpe Ratio -0.35 Information Ratio -0.11 Alpha Ratio -2.66 Min Investment 5,000 Min SIP Investment 100 Exit Load 0-1 Years (1%),1 Years and above(NIL) Growth of 10,000 investment over the years.
Date Value 30 Nov 20 ₹10,000 30 Nov 21 ₹17,553 30 Nov 22 ₹20,288 30 Nov 23 ₹28,079 30 Nov 24 ₹37,706 30 Nov 25 ₹36,088 Returns for Nippon India Small Cap Fund
absolute basis & more than 1 year are on CAGR (Compound Annual Growth Rate) basis. as on 12 Dec 25 Duration Returns 1 Month -2.8% 3 Month -3.2% 6 Month -3.8% 1 Year -10.1% 3 Year 20% 5 Year 27.8% 10 Year 15 Year Since launch 20.2% Historical performance (Yearly) on absolute basis
Year Returns 2024 26.1% 2023 48.9% 2022 6.5% 2021 74.3% 2020 29.2% 2019 -2.5% 2018 -16.7% 2017 63% 2016 5.6% 2015 15.1% Fund Manager information for Nippon India Small Cap Fund
Name Since Tenure Samir Rachh 2 Jan 17 8.83 Yr. Kinjal Desai 25 May 18 7.44 Yr. Lokesh Maru 5 Sep 25 0.16 Yr. Divya Sharma 5 Sep 25 0.16 Yr. Data below for Nippon India Small Cap Fund as on 31 Oct 25
Equity Sector Allocation
Sector Value Industrials 20.62% Financial Services 15.84% Consumer Cyclical 15.32% Basic Materials 11.51% Consumer Defensive 9.7% Health Care 8.96% Technology 7.64% Utility 2.56% Energy 1.78% Communication Services 1.38% Real Estate 0.56% Asset Allocation
Asset Class Value Cash 4.15% Equity 95.85% Top Securities Holdings / Portfolio
Name Holding Value Quantity Multi Commodity Exchange of India Ltd (Financial Services)
Equity, Since 28 Feb 21 | MCX2% ₹1,711 Cr 1,851,010 HDFC Bank Ltd (Financial Services)
Equity, Since 30 Apr 22 | HDFCBANK2% ₹1,313 Cr 13,300,000 State Bank of India (Financial Services)
Equity, Since 31 Oct 19 | SBIN1% ₹970 Cr 10,347,848
↑ 1,247,848 Karur Vysya Bank Ltd (Financial Services)
Equity, Since 28 Feb 17 | 5900031% ₹927 Cr 38,140,874 Kirloskar Brothers Ltd (Industrials)
Equity, Since 31 Oct 12 | KIRLOSBROS1% ₹838 Cr 4,472,130 eClerx Services Ltd (Technology)
Equity, Since 31 Jul 20 | ECLERX1% ₹810 Cr 1,712,794
↓ -49,536 Zydus Wellness Ltd (Consumer Defensive)
Equity, Since 31 Aug 16 | ZYDUSWELL1% ₹803 Cr 16,848,030 TD Power Systems Ltd (Industrials)
Equity, Since 31 Dec 15 | TDPOWERSYS1% ₹796 Cr 10,278,244 Apar Industries Ltd (Industrials)
Equity, Since 31 Mar 17 | APARINDS1% ₹780 Cr 899,271 Bharat Heavy Electricals Ltd (Industrials)
Equity, Since 30 Sep 22 | 5001031% ₹758 Cr 28,538,232
హై రిస్క్ ఇన్వెస్ట్మెంట్స్లో SIP మార్గాన్ని తీసుకోవడం ఎందుకు స్మార్ట్ ఛాయిస్?
ఒక సిస్టమాటిక్పెట్టుబడి ప్రణాళిక (SIP) మ్యూచువల్ ఫండ్స్లో, ముఖ్యంగా ఈక్విటీ ఫండ్స్లో సమర్థవంతమైన పెట్టుబడి విధానం. ఒక SIP అనుమతిస్తుందిపెట్టుబడిదారుడు పథకంలో స్థిరమైన మొత్తాన్ని క్రమం తప్పకుండా పెట్టుబడి పెట్టడానికి. SIPల యొక్క ముఖ్యమైన ప్రయోజనాల్లో ఒకటి, ఇది రూపాయి ధర సగటున సహాయపడుతుంది. మార్కెట్ పరిస్థితులతో సంబంధం లేకుండా మీరు నిర్దిష్ట కాల వ్యవధిలో క్రమం తప్పకుండా పెట్టుబడి పెట్టినప్పుడు, మార్కెట్ తక్కువగా ఉన్నప్పుడు ఎక్కువ యూనిట్లు మరియు మార్కెట్ ఎక్కువగా ఉన్నప్పుడు తక్కువ యూనిట్లు పొందుతారు. ఇది మీ మ్యూచువల్ ఫండ్ యూనిట్ల కొనుగోలు ధరను సగటున అంచనా వేస్తుంది.
ఇతర ప్రయోజనం ఏమిటంటేసమ్మేళనం యొక్క శక్తి. మీరు ఎక్కువ కాలం పెట్టుబడి పెట్టినప్పుడు మీ డబ్బు సమ్మిళితం కావడం ప్రారంభమవుతుంది. సేకరించబడిన కార్పస్ మార్కెట్లో తిరిగి పెట్టుబడి పెట్టబడుతుంది మరియు మీరు మీ పెట్టుబడి ద్వారా సంపాదించిన రాబడిపై రాబడిని పొందుతారు. సాధారణ చిన్న పెట్టుబడులతో మీ దీర్ఘకాలిక లక్ష్యాలను సాధించడంలో మీకు సహాయపడే పెద్ద కార్పస్ను నిర్మించడంలో ఇది సహాయపడుతుంది.
SIP యొక్క కొన్ని ఇతర ప్రయోజనాలు:
- కనీస పెట్టుబడి INR 500తో ప్రారంభమవుతుంది
- దీర్ఘకాలిక పొదుపు అలవాటును ఏర్పరుస్తుంది
- దీర్ఘకాలిక ప్రమాదాన్ని తగ్గిస్తుంది
- లక్ష్యాల వారీగా పెట్టుబడి పెట్టడంలో సహాయపడుతుంది
అధిక రిస్క్ మ్యూచువల్ ఫండ్స్లో ఎలా పెట్టుబడి పెట్టాలి?
Fincash.comలో జీవితకాలం కోసం ఉచిత పెట్టుబడి ఖాతాను తెరవండి.
మీ రిజిస్ట్రేషన్ మరియు KYC ప్రక్రియను పూర్తి చేయండి
పత్రాలను అప్లోడ్ చేయండి (పాన్, ఆధార్, మొదలైనవి).మరియు, మీరు పెట్టుబడి పెట్టడానికి సిద్ధంగా ఉన్నారు!
ఇక్కడ అందించిన సమాచారం ఖచ్చితమైనదని నిర్ధారించడానికి అన్ని ప్రయత్నాలు చేయబడ్డాయి. అయినప్పటికీ, డేటా యొక్క ఖచ్చితత్వానికి సంబంధించి ఎటువంటి హామీలు ఇవ్వబడవు. దయచేసి ఏదైనా పెట్టుబడి పెట్టే ముందు పథకం సమాచార పత్రంతో ధృవీకరించండి.


AMFI Registration No. 112358 | CIN: U74999MH2016PTC282153
Shepard Technologies Pvt. Ltd. (with ARN code 112358) makes no warranties or representations, express or implied, on products offered through the platform. It accepts no liability for any damages or losses, however caused, in connection with the use of, or on the reliance of its product or related services. Terms and conditions of the website are applicable.
©2025 Shepard Technologies Private Limited. All Rights Reserved
Research Highlights for ICICI Prudential Infrastructure Fund