Table of Contents
سرمایہ کاروں کو کورونا وائرس کی فکر کیوں نہیں کرنی چاہیے؟
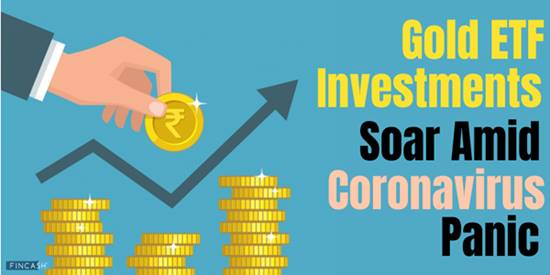
دنیا بھر میں کورونا وائرس کا رجحان ہے۔ چین میں اس کے بڑے پیمانے پر پھیلنے کے ساتھ، ملک اپنی اقتصادی اور مالیاتی ترقی میں سست روی کا سامنا کر رہا ہے۔ دوسرے ممالک جیسے امریکہ، سنگاپور، برطانیہ، ملائیشیا، تھائی لینڈ، وغیرہ نے بھی کچھ جوابی فائر محسوس کیا ہے۔
مختلف فارما مصنوعات کی قیمتیں بڑھ گئی ہیں اور سرمایہ کارمارکیٹ خوفزدہ ہیں. اور چونکہ ہندوستان چینی مصنوعات کے سب سے بڑے درآمد کنندگان میں سے ایک ہے، اس لیے ہندوستانی سرمایہ کاروں میں مارکیٹ میں مندی کا خوف رجحان میں ہے۔

سرمایہ کاروں کے لیے خوشخبری!
صنعت کے ماہرین نے پوری صورت حال کا مطالعہ کیا ہے اور ہر سرمایہ کار کی سمت ہری جھنڈی لہرا رہے ہیں۔
ایک حالیہ رپورٹ کے مطابق اقتصادی امور کے سکریٹری اتانو چکرورتی نے کہا کہ کورونا وائرس کے پھیلنے سے ہندوستانی اقتصادی سرگرمیوں پر کوئی اثر نہیں پڑے گا۔ مزید برآں، رپورٹ میں یہ بھی بتایا گیا کہ بینکرز نے کہا کہ وہ ابھی تک ایسی کوئی چیز نہیں دیکھ سکے ہیں جس سے بینکوں پر اثر پڑے۔معیشت.
آپ کو فکر کیوں نہیں کرنی چاہیے؟
تاریخی طور پر، ابھرتی ہوئی بیماریوں کے لیے مارکیٹ کا ردِ عمل قلیل المدت رہا ہے۔ اگر آپ دیکھتے ہیں، شدید ایکیوٹ ریسپائریٹری سنڈروم (SARS) 2003، جو کہ کورونا وائرس سے ملتا جلتا تھا۔ درحقیقت، اس سے 8100 افراد متاثر ہوئے اور 770 اموات ہوئیں، لیکن اس وقت سارس واحد چیز تھی جب اسٹاک واپس لوٹا تھا۔
سب سے قابل ذکر بات یہ ہے کہ سوائن فلو کے بحران کے بعد بہت زیادہ فوائد حاصل ہوئے اور اس کے بعد ایک زبردست بحالی ہوئی۔کساد بازاری.
ہندوستان نے عالمی سطح پر مختلف وباء کا مشاہدہ کیا ہے جس نے ہندوستانی معیشت کو بھی متاثر کیا ہے۔ تاہم، معیشت واپس اچھالتی ہے اور جب معیشت کو دھچکا لگا ہوتا ہے تو سرمایہ کاروں کو ہمیشہ مزید سرمایہ کاری کرنے کی ترغیب دی جاتی ہے۔
قلیل مدتی مارکیٹ کے اتار چڑھاؤ ان سرمایہ کاروں کے منافع کو متاثر نہیں کر سکتے جو طویل مدتی سرمایہ کاری پر توجہ مرکوز کرتے ہیں کیونکہ طویل مدت میں مارکیٹ اچھالتی ہے۔
Talk to our investment specialist
لہذا، طویل مدتی پر توجہ مرکوز کریں!
سرمایہ کاروں کو ٹھنڈا رہنا چاہئے اور طویل مدتی فوائد پر اپنی توجہ مرکوز رکھنا چاہئے۔ مختصر مدت کے بازار کے اتار چڑھاو سے بچیں، نظم و ضبط میں رہیں اور اپنے اثاثے پر قائم رہیں۔
اپنے فنڈز کو مختلف شعبوں میں تقسیم کریں اور اپنے پورٹ فولیو کو متنوع بنائیں۔ یہ آپ کے خطرے اور واپسی کو متوازن کرنے کا ایک بہترین طریقہ ہے۔ اس طرح، اگر ایک فنڈ کارکردگی دکھانے میں ناکام رہتا ہے، تو دوسرے فنڈز واپسی کو متوازن کر سکتے ہیں۔
آپ بہترین انتخاب کرسکتے ہیں۔گھونٹ کے ذریعے موڈباہمی چندہجہاں ایک چھوٹی سی رقم کی سرمایہ کاری کی جاتی ہے۔ایکویٹی فنڈز ایک باقاعدہ وقفہ سے زیادہ۔ جیسا کہ ایک SIP کا فائدہ دیتا ہے۔کمپاؤنڈنگ کی طاقت اور روپے کی اوسط قیمت، مارکیٹ کے قلیل مدتی نقصانات آپ کے پورٹ فولیو کو زیادہ متاثر نہیں کرتے ہیں۔ طویل مدت میں واپسی مثبت ہے۔
FY 22 - 23 کی سرمایہ کاری کے لیے بہترین کارکردگی کا مظاہرہ کرنے والے SIP فنڈز
To generate capital appreciation and income distribution to unit holders by investing predominantly in equity/equity related securities of the companies belonging to the infrastructure development and balance in debt securities and money market instruments. ICICI Prudential Infrastructure Fund is a Equity - Sectoral fund was launched on 31 Aug 05. It is a fund with High risk and has given a Below is the key information for ICICI Prudential Infrastructure Fund Returns up to 1 year are on The investment objective of the scheme is to seek to generate long-term capital growth through an active diversified portfolio of predominantly equity and equity related instruments of companies that are participating in and benefiting from growth in Indian infrastructure and infrastructural related activities. However, there can be no assurance that the investment objective of the scheme will be realized. IDFC Infrastructure Fund is a Equity - Sectoral fund was launched on 8 Mar 11. It is a fund with High risk and has given a Below is the key information for IDFC Infrastructure Fund Returns up to 1 year are on (Erstwhile Reliance Diversified Power Sector Fund) The primary investment objective of the scheme is to generate long term capital appreciation by investing predominantly in equity and equity related securities of companies in the power sector. Nippon India Power and Infra Fund is a Equity - Sectoral fund was launched on 8 May 04. It is a fund with High risk and has given a Below is the key information for Nippon India Power and Infra Fund Returns up to 1 year are on To seek long-term capital appreciation by investing predominantly in equity and equity related securities of companies engaged in or expected to benefit from growth and development of infrastructure. HDFC Infrastructure Fund is a Equity - Sectoral fund was launched on 10 Mar 08. It is a fund with High risk and has given a Below is the key information for HDFC Infrastructure Fund Returns up to 1 year are on To generate long-term capital appreciation from a diversified portfolio of predominantly equity and equity related securities, including equity derivatives, in the Indian markets with key theme focus being emerging companies (small cap stocks). The Scheme could also additionally invest in Foreign Securities. L&T Emerging Businesses Fund is a Equity - Small Cap fund was launched on 12 May 14. It is a fund with High risk and has given a Below is the key information for L&T Emerging Businesses Fund Returns up to 1 year are on Fund NAV Net Assets (Cr) Min SIP Investment 3 MO (%) 6 MO (%) 1 YR (%) 3 YR (%) 5 YR (%) 2023 (%) ICICI Prudential Infrastructure Fund Growth ₹177.92
↑ 0.49 ₹6,886 100 -5.5 -12.2 5.1 28.1 41.2 27.4 IDFC Infrastructure Fund Growth ₹46.073
↑ 0.20 ₹1,400 100 -12.1 -18.2 3.2 25.8 38.6 39.3 Nippon India Power and Infra Fund Growth ₹317.396
↑ 2.06 ₹6,125 100 -9.9 -16.6 0.5 27.5 38.1 26.9 HDFC Infrastructure Fund Growth ₹43.488
↑ 0.25 ₹2,105 300 -7.4 -13.2 2.7 28.9 37.6 23 L&T Emerging Businesses Fund Growth ₹72.9721
↑ 0.79 ₹13,334 500 -18.9 -19 1.7 17 37.2 28.5 Note: Returns up to 1 year are on absolute basis & more than 1 year are on CAGR basis. as on 2 Apr 25 200 کروڑ میوچل فنڈز کی ایکویٹی کیٹیگری میں 5 سال کی بنیاد پر آرڈر کیا گیا۔سی اے جی آر واپسی1. ICICI Prudential Infrastructure Fund
CAGR/Annualized return of 15.8% since its launch. Ranked 27 in Sectoral category. Return for 2024 was 27.4% , 2023 was 44.6% and 2022 was 28.8% . ICICI Prudential Infrastructure Fund
Growth Launch Date 31 Aug 05 NAV (02 Apr 25) ₹177.92 ↑ 0.49 (0.28 %) Net Assets (Cr) ₹6,886 on 28 Feb 25 Category Equity - Sectoral AMC ICICI Prudential Asset Management Company Limited Rating ☆☆☆ Risk High Expense Ratio 2.22 Sharpe Ratio -0.25 Information Ratio 0 Alpha Ratio 0 Min Investment 5,000 Min SIP Investment 100 Exit Load 0-1 Years (1%),1 Years and above(NIL) Growth of 10,000 investment over the years.
Date Value 31 Mar 20 ₹10,000 31 Mar 21 ₹18,670 31 Mar 22 ₹25,304 31 Mar 23 ₹30,899 31 Mar 24 ₹50,465 31 Mar 25 ₹54,540 Returns for ICICI Prudential Infrastructure Fund
absolute basis & more than 1 year are on CAGR (Compound Annual Growth Rate) basis. as on 2 Apr 25 Duration Returns 1 Month 8.8% 3 Month -5.5% 6 Month -12.2% 1 Year 5.1% 3 Year 28.1% 5 Year 41.2% 10 Year 15 Year Since launch 15.8% Historical performance (Yearly) on absolute basis
Year Returns 2023 27.4% 2022 44.6% 2021 28.8% 2020 50.1% 2019 3.6% 2018 2.6% 2017 -14% 2016 40.8% 2015 2% 2014 -3.4% Fund Manager information for ICICI Prudential Infrastructure Fund
Name Since Tenure Ihab Dalwai 3 Jun 17 7.75 Yr. Sharmila D’mello 30 Jun 22 2.67 Yr. Data below for ICICI Prudential Infrastructure Fund as on 28 Feb 25
Equity Sector Allocation
Sector Value Industrials 36.49% Basic Materials 21.39% Financial Services 16.91% Utility 8.65% Energy 7.09% Communication Services 1.63% Consumer Cyclical 0.89% Real Estate 0.35% Asset Allocation
Asset Class Value Cash 5.98% Equity 93.39% Debt 0.62% Top Securities Holdings / Portfolio
Name Holding Value Quantity Larsen & Toubro Ltd (Industrials)
Equity, Since 30 Nov 09 | LT9% ₹649 Cr 2,052,790
↑ 126,940 Adani Ports & Special Economic Zone Ltd (Industrials)
Equity, Since 31 May 24 | ADANIPORTS4% ₹288 Cr 2,695,324 Shree Cement Ltd (Basic Materials)
Equity, Since 30 Apr 24 | 5003874% ₹268 Cr 98,408
↓ -10,339 ICICI Bank Ltd (Financial Services)
Equity, Since 31 Dec 16 | ICICIBANK3% ₹240 Cr 1,990,000 NTPC Ltd (Utilities)
Equity, Since 29 Feb 16 | 5325553% ₹226 Cr 7,260,775 HDFC Bank Ltd (Financial Services)
Equity, Since 31 Jan 22 | HDFCBANK3% ₹212 Cr 1,225,000 NCC Ltd (Industrials)
Equity, Since 31 Aug 21 | NCC3% ₹210 Cr 12,006,117
↑ 1,500,000 Reliance Industries Ltd (Energy)
Equity, Since 31 Jul 23 | RELIANCE3% ₹205 Cr 1,709,486
↑ 100,000 Vedanta Ltd (Basic Materials)
Equity, Since 31 Jul 24 | 5002953% ₹194 Cr 4,923,662
↑ 100,000 Cummins India Ltd (Industrials)
Equity, Since 31 May 17 | 5004803% ₹173 Cr 635,000 2. IDFC Infrastructure Fund
CAGR/Annualized return of 11.5% since its launch. Ranked 1 in Sectoral category. Return for 2024 was 39.3% , 2023 was 50.3% and 2022 was 1.7% . IDFC Infrastructure Fund
Growth Launch Date 8 Mar 11 NAV (02 Apr 25) ₹46.073 ↑ 0.20 (0.43 %) Net Assets (Cr) ₹1,400 on 28 Feb 25 Category Equity - Sectoral AMC IDFC Asset Management Company Limited Rating ☆☆☆☆☆ Risk High Expense Ratio 2.33 Sharpe Ratio -0.3 Information Ratio 0 Alpha Ratio 0 Min Investment 5,000 Min SIP Investment 100 Exit Load 0-365 Days (1%),365 Days and above(NIL) Growth of 10,000 investment over the years.
Date Value 31 Mar 20 ₹10,000 31 Mar 21 ₹20,153 31 Mar 22 ₹24,848 31 Mar 23 ₹27,324 31 Mar 24 ₹47,064 31 Mar 25 ₹50,038 Returns for IDFC Infrastructure Fund
absolute basis & more than 1 year are on CAGR (Compound Annual Growth Rate) basis. as on 2 Apr 25 Duration Returns 1 Month 13% 3 Month -12.1% 6 Month -18.2% 1 Year 3.2% 3 Year 25.8% 5 Year 38.6% 10 Year 15 Year Since launch 11.5% Historical performance (Yearly) on absolute basis
Year Returns 2023 39.3% 2022 50.3% 2021 1.7% 2020 64.8% 2019 6.3% 2018 -5.3% 2017 -25.9% 2016 58.7% 2015 10.7% 2014 -0.2% Fund Manager information for IDFC Infrastructure Fund
Name Since Tenure Vishal Biraia 24 Jan 24 1.1 Yr. Ritika Behera 7 Oct 23 1.4 Yr. Gaurav Satra 7 Jun 24 0.73 Yr. Data below for IDFC Infrastructure Fund as on 28 Feb 25
Equity Sector Allocation
Sector Value Industrials 54.7% Utility 13.22% Basic Materials 10.84% Communication Services 4.49% Energy 3.88% Consumer Cyclical 3.46% Financial Services 2.99% Technology 2.07% Health Care 1.9% Asset Allocation
Asset Class Value Cash 2.43% Equity 97.57% Top Securities Holdings / Portfolio
Name Holding Value Quantity Kirloskar Brothers Ltd (Industrials)
Equity, Since 31 Dec 17 | KIRLOSBROS5% ₹71 Cr 443,385 Larsen & Toubro Ltd (Industrials)
Equity, Since 29 Feb 12 | LT4% ₹58 Cr 183,173
↑ 11,726 Reliance Industries Ltd (Energy)
Equity, Since 30 Jun 24 | RELIANCE4% ₹54 Cr 452,706 Bharti Airtel Ltd (Communication Services)
Equity, Since 30 Apr 19 | BHARTIARTL4% ₹52 Cr 330,018
↑ 40,855 UltraTech Cement Ltd (Basic Materials)
Equity, Since 31 Mar 14 | 5325384% ₹51 Cr 50,452
↑ 3,476 GPT Infraprojects Ltd (Industrials)
Equity, Since 30 Nov 17 | GPTINFRA3% ₹45 Cr 4,797,143 Adani Ports & Special Economic Zone Ltd (Industrials)
Equity, Since 31 Dec 23 | ADANIPORTS3% ₹39 Cr 365,137
↓ -69,842 PTC India Financial Services Ltd (Financial Services)
Equity, Since 31 Dec 23 | PFS3% ₹39 Cr 12,400,122 Bharat Electronics Ltd (Industrials)
Equity, Since 31 Oct 19 | BEL3% ₹35 Cr 1,431,700 KEC International Ltd (Industrials)
Equity, Since 30 Jun 24 | 5327143% ₹35 Cr 512,915 3. Nippon India Power and Infra Fund
CAGR/Annualized return of 18% since its launch. Ranked 13 in Sectoral category. Return for 2024 was 26.9% , 2023 was 58% and 2022 was 10.9% . Nippon India Power and Infra Fund
Growth Launch Date 8 May 04 NAV (02 Apr 25) ₹317.396 ↑ 2.06 (0.65 %) Net Assets (Cr) ₹6,125 on 28 Feb 25 Category Equity - Sectoral AMC Nippon Life Asset Management Ltd. Rating ☆☆☆☆ Risk High Expense Ratio 2.05 Sharpe Ratio -0.55 Information Ratio 1.03 Alpha Ratio 1.38 Min Investment 5,000 Min SIP Investment 100 Exit Load 0-1 Years (1%),1 Years and above(NIL) Growth of 10,000 investment over the years.
Date Value 31 Mar 20 ₹10,000 31 Mar 21 ₹18,563 31 Mar 22 ₹23,186 31 Mar 23 ₹26,891 31 Mar 24 ₹47,550 31 Mar 25 ₹48,861 Returns for Nippon India Power and Infra Fund
absolute basis & more than 1 year are on CAGR (Compound Annual Growth Rate) basis. as on 2 Apr 25 Duration Returns 1 Month 11.7% 3 Month -9.9% 6 Month -16.6% 1 Year 0.5% 3 Year 27.5% 5 Year 38.1% 10 Year 15 Year Since launch 18% Historical performance (Yearly) on absolute basis
Year Returns 2023 26.9% 2022 58% 2021 10.9% 2020 48.9% 2019 10.8% 2018 -2.9% 2017 -21.1% 2016 61.7% 2015 0.1% 2014 0.3% Fund Manager information for Nippon India Power and Infra Fund
Name Since Tenure Kinjal Desai 25 May 18 6.77 Yr. Rahul Modi 19 Aug 24 0.53 Yr. Data below for Nippon India Power and Infra Fund as on 28 Feb 25
Equity Sector Allocation
Sector Value Industrials 40.77% Utility 19.49% Energy 9.09% Basic Materials 9.08% Communication Services 8.44% Real Estate 3.99% Technology 2.14% Health Care 2.08% Consumer Cyclical 1.96% Financial Services 1.78% Asset Allocation
Asset Class Value Cash 1.18% Equity 98.82% Top Securities Holdings / Portfolio
Name Holding Value Quantity Reliance Industries Ltd (Energy)
Equity, Since 30 Nov 18 | RELIANCE8% ₹480 Cr 4,000,000
↑ 250,000 NTPC Ltd (Utilities)
Equity, Since 31 May 09 | 5325558% ₹480 Cr 15,400,000 Larsen & Toubro Ltd (Industrials)
Equity, Since 30 Nov 07 | LT8% ₹472 Cr 1,492,001 Bharti Airtel Ltd (Communication Services)
Equity, Since 30 Apr 18 | BHARTIARTL7% ₹408 Cr 2,600,000 UltraTech Cement Ltd (Basic Materials)
Equity, Since 31 Oct 19 | 5325384% ₹243 Cr 240,038 Tata Power Co Ltd (Utilities)
Equity, Since 30 Apr 23 | 5004004% ₹237 Cr 6,975,789
↑ 500,000 Kaynes Technology India Ltd (Industrials)
Equity, Since 30 Nov 22 | KAYNES3% ₹176 Cr 423,938 Siemens Ltd (Industrials)
Equity, Since 31 May 21 | 5005503% ₹162 Cr 350,000 CG Power & Industrial Solutions Ltd (Industrials)
Equity, Since 30 Sep 24 | 5000932% ₹151 Cr 2,632,923
↑ 80,000 Carborundum Universal Ltd (Industrials)
Equity, Since 30 Sep 23 | CARBORUNIV2% ₹150 Cr 1,800,000 4. HDFC Infrastructure Fund
CAGR/Annualized return of since its launch. Ranked 26 in Sectoral category. Return for 2024 was 23% , 2023 was 55.4% and 2022 was 19.3% . HDFC Infrastructure Fund
Growth Launch Date 10 Mar 08 NAV (02 Apr 25) ₹43.488 ↑ 0.25 (0.58 %) Net Assets (Cr) ₹2,105 on 28 Feb 25 Category Equity - Sectoral AMC HDFC Asset Management Company Limited Rating ☆☆☆ Risk High Expense Ratio 2.31 Sharpe Ratio -0.55 Information Ratio 0 Alpha Ratio 0 Min Investment 5,000 Min SIP Investment 300 Exit Load 0-1 Years (1%),1 Years and above(NIL) Growth of 10,000 investment over the years.
Date Value 31 Mar 20 ₹10,000 31 Mar 21 ₹17,356 31 Mar 22 ₹21,727 31 Mar 23 ₹25,279 31 Mar 24 ₹45,346 31 Mar 25 ₹47,548 Returns for HDFC Infrastructure Fund
absolute basis & more than 1 year are on CAGR (Compound Annual Growth Rate) basis. as on 2 Apr 25 Duration Returns 1 Month 9.8% 3 Month -7.4% 6 Month -13.2% 1 Year 2.7% 3 Year 28.9% 5 Year 37.6% 10 Year 15 Year Since launch Historical performance (Yearly) on absolute basis
Year Returns 2023 23% 2022 55.4% 2021 19.3% 2020 43.2% 2019 -7.5% 2018 -3.4% 2017 -29% 2016 43.3% 2015 -1.9% 2014 -2.5% Fund Manager information for HDFC Infrastructure Fund
Name Since Tenure Srinivasan Ramamurthy 12 Jan 24 1.13 Yr. Dhruv Muchhal 22 Jun 23 1.69 Yr. Data below for HDFC Infrastructure Fund as on 28 Feb 25
Equity Sector Allocation
Sector Value Industrials 38.42% Financial Services 20.62% Basic Materials 10.93% Utility 7.4% Energy 6.96% Communication Services 3.76% Health Care 1.73% Technology 0.98% Real Estate 0.94% Consumer Cyclical 0.58% Asset Allocation
Asset Class Value Cash 6.48% Equity 92.31% Debt 1.21% Top Securities Holdings / Portfolio
Name Holding Value Quantity ICICI Bank Ltd (Financial Services)
Equity, Since 31 Oct 09 | ICICIBANK7% ₹157 Cr 1,300,000 HDFC Bank Ltd (Financial Services)
Equity, Since 31 Aug 23 | HDFCBANK6% ₹121 Cr 700,000 Larsen & Toubro Ltd (Industrials)
Equity, Since 30 Jun 12 | LT6% ₹120 Cr 380,000
↑ 30,000 J Kumar Infraprojects Ltd (Industrials)
Equity, Since 31 Oct 15 | JKIL5% ₹98 Cr 1,450,000
↓ -50,000 NTPC Ltd (Utilities)
Equity, Since 31 Dec 17 | 5325553% ₹69 Cr 2,200,000 InterGlobe Aviation Ltd (Industrials)
Equity, Since 31 Dec 21 | INDIGO3% ₹67 Cr 150,000 Kalpataru Projects International Ltd (Industrials)
Equity, Since 31 Jan 23 | KPIL3% ₹67 Cr 758,285 Coal India Ltd (Energy)
Equity, Since 31 Oct 18 | COALINDIA3% ₹63 Cr 1,700,000 Reliance Industries Ltd (Energy)
Equity, Since 31 May 24 | RELIANCE3% ₹60 Cr 500,000 Bharti Airtel Ltd (Communication Services)
Equity, Since 30 Sep 20 | BHARTIARTL3% ₹55 Cr 350,000
↓ -50,000 5. L&T Emerging Businesses Fund
CAGR/Annualized return of 20% since its launch. Ranked 2 in Small Cap category. Return for 2024 was 28.5% , 2023 was 46.1% and 2022 was 1% . L&T Emerging Businesses Fund
Growth Launch Date 12 May 14 NAV (02 Apr 25) ₹72.9721 ↑ 0.79 (1.09 %) Net Assets (Cr) ₹13,334 on 28 Feb 25 Category Equity - Small Cap AMC L&T Investment Management Ltd Rating ☆☆☆☆☆ Risk High Expense Ratio 1.73 Sharpe Ratio -0.4 Information Ratio -0.11 Alpha Ratio 1.44 Min Investment 5,000 Min SIP Investment 500 Exit Load 0-1 Years (1%),1 Years and above(NIL) Growth of 10,000 investment over the years.
Date Value 31 Mar 20 ₹10,000 31 Mar 21 ₹20,010 31 Mar 22 ₹29,870 31 Mar 23 ₹31,289 31 Mar 24 ₹46,026 31 Mar 25 ₹48,026 Returns for L&T Emerging Businesses Fund
absolute basis & more than 1 year are on CAGR (Compound Annual Growth Rate) basis. as on 2 Apr 25 Duration Returns 1 Month 8.7% 3 Month -18.9% 6 Month -19% 1 Year 1.7% 3 Year 17% 5 Year 37.2% 10 Year 15 Year Since launch 20% Historical performance (Yearly) on absolute basis
Year Returns 2023 28.5% 2022 46.1% 2021 1% 2020 77.4% 2019 15.5% 2018 -8.1% 2017 -13.7% 2016 66.5% 2015 10.2% 2014 12.3% Fund Manager information for L&T Emerging Businesses Fund
Name Since Tenure Venugopal Manghat 17 Dec 19 5.21 Yr. Cheenu Gupta 1 Oct 23 1.42 Yr. Sonal Gupta 1 Oct 23 1.42 Yr. Data below for L&T Emerging Businesses Fund as on 28 Feb 25
Equity Sector Allocation
Sector Value Industrials 24.78% Consumer Cyclical 15.58% Financial Services 14.01% Basic Materials 10.75% Technology 9.78% Health Care 5.55% Real Estate 4.98% Consumer Defensive 4.06% Energy 1.26% Asset Allocation
Asset Class Value Cash 6.91% Equity 93.09% Top Securities Holdings / Portfolio
Name Holding Value Quantity Neuland Laboratories Limited
Equity, Since 31 Jan 24 | -2% ₹310 Cr 292,479
↓ -6,521 Aditya Birla Real Estate Ltd (Basic Materials)
Equity, Since 30 Sep 22 | 5000402% ₹297 Cr 1,595,574 Suven Pharmaceuticals Ltd (Healthcare)
Equity, Since 31 Mar 20 | SUVENPHAR2% ₹279 Cr 2,298,085 K.P.R. Mill Ltd (Consumer Cyclical)
Equity, Since 28 Feb 15 | KPRMILL2% ₹263 Cr 3,286,897 BSE Ltd (Financial Services)
Equity, Since 29 Feb 24 | BSE2% ₹257 Cr 555,021
↓ -297,579 Time Technoplast Ltd (Consumer Cyclical)
Equity, Since 31 Jan 24 | TIMETECHNO2% ₹243 Cr 6,810,500 Karur Vysya Bank Ltd (Financial Services)
Equity, Since 31 Oct 22 | 5900032% ₹240 Cr 11,912,400 Brigade Enterprises Ltd (Real Estate)
Equity, Since 31 Jul 19 | 5329292% ₹237 Cr 2,499,622 The Federal Bank Ltd (Financial Services)
Equity, Since 30 Sep 22 | FEDERALBNK2% ₹236 Cr 13,286,579 Sumitomo Chemical India Ltd Ordinary Shares (Basic Materials)
Equity, Since 31 Oct 20 | SUMICHEM2% ₹215 Cr 4,672,221
پرسکون رہیں، طویل مدتی منافع پر توجہ مرکوز کریں اور اپنی سرمایہ کاری کو مختصر مدت کے اتار چڑھاو سے واپس آنے دیں!
یہاں فراہم کردہ معلومات کے درست ہونے کو یقینی بنانے کے لیے تمام کوششیں کی گئی ہیں۔ تاہم، ڈیٹا کی درستگی کے حوالے سے کوئی ضمانت نہیں دی جاتی ہے۔ براہ کرم کوئی بھی سرمایہ کاری کرنے سے پہلے اسکیم کی معلومات کے دستاویز کے ساتھ تصدیق کریں۔


