Table of Contents
ইএলএসএস বনাম ট্যাক্স সেভিং এফডি
ইক্যুইটি লিঙ্কড সেভিংস স্কিম (ELSS)
ইএলএসএস একমাত্রপারস্পরিক তহবিল 80C ছাড়ের জন্য যোগ্য। এটি একটি বৈচিত্র্যপূর্ণ ইক্যুইটি মিউচুয়াল ফান্ড যা 100000 টাকা পর্যন্ত কর কর্তনের প্রস্তাব দেয়৷ 1.5 লক্ষ বার্ষিক অধীনেধারা 80C এরআয়কর আইন (আইটি আইন 1961)।

ফেব্রুয়ারী বাজেট 2018 প্রবর্তনের আগে, এর রিটার্ন সম্পূর্ণ করমুক্ত ছিল। যাইহোক, এখন এটি 10% দীর্ঘমেয়াদী সাপেক্ষেমূলধন লাভ ট্যাক্স যদি আপনারমূলধন লাভ টাকা অতিক্রম এক বছর পর ১ লাখ টাকা। এমনকি 10% ট্যাক্স কাটার পরেও, ELSS-এর অন্যান্য ট্যাক্স-সেভিং ইন্সট্রুমেন্টের তুলনায় উচ্চতর রিটার্ন দেওয়ার সম্ভাবনা রয়েছে। ELSS বিনিয়োগের সুবিধাগুলি সীমাবদ্ধ নয়করের সংরক্ষিত. দ্যযৌগিক শক্তি নিশ্চিত করে যে আপনার বিনিয়োগ দ্বিগুণ হবে যদি আপনি বিনিয়োগ করেন, বলুন, 5 বছরের জন্য (কর-সঞ্চয়ের মেয়াদFD) এর সাথে যোগ করতে, সর্বনিম্ন লক-ইন সময়কাল মাত্র 3 বছর।
ট্যাক্স সেভিং ফিক্সড ডিপোজিট
বিনিয়োগ ব্যাঙ্কে ফিক্সড ডিপোজিটে থাকা টাকা ব্যক্তি এবং HUF-কে ট্যাক্স দাবি করতে দেয়ডিডাকশন টাকা পর্যন্ত 1,50,000 একটি আর্থিক বছরে। এই আমানতের লক-ইন পিরিয়ড 5 বছরের। আপনি, যাইহোক, সময়ের আগে এই আমানত তুলতে পারবেন না। কিন্তু আপনি প্রতিযোগিতামূলক হারে আপনার FD-এর বিপরীতে ঋণ পেতে পারেন। এই আমানতের উপর অর্জিত সুদ, তবে, ব্যক্তির করযোগ্য প্রান্তিক হার (ট্যাক্স বন্ধনী অনুসারে)।
ট্যাক্স সেভার এফডির হাইলাইটস
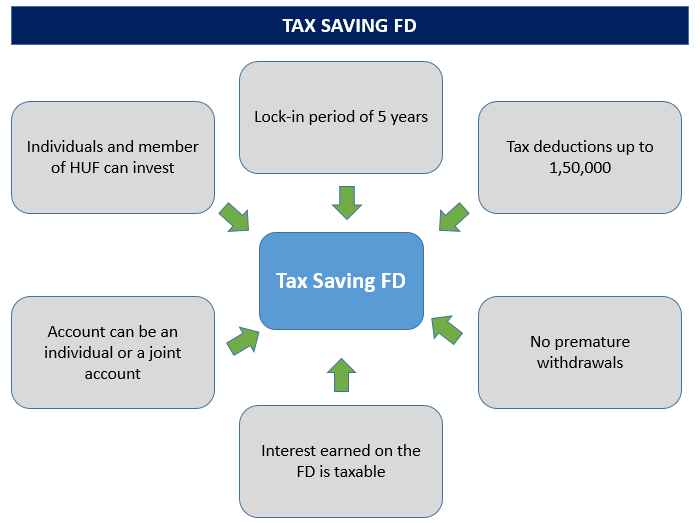
আসুন এর মূল হাইলাইটগুলি দেখিট্যাক্স সেভার FD -
- শুধুমাত্র ব্যক্তি এবং সদস্যদেরহিন্দু অবিভক্ত পরিবার (HUF) বিনিয়োগ করতে পারেনট্যাক্স সেভিং এফডি পরিকল্পনা
- ট্যাক্স সেভার এফডি-এর ন্যূনতম বিনিয়োগের পরিমাণ থেকে পরিবর্তিত হয়ব্যাংক ব্যাংক করতে
- ট্যাক্স সেভিং এফডির লক-ইন পিরিয়ড হল পাঁচ বছর
- আপনি টাকা পর্যন্ত কর ছাড় পেতে পারেন৷ 1,50,000
- অকাল প্রত্যাহারের কোন বিধান নেই
- আপনি এই ট্যাক্স সেভার এফডির বিপরীতে ঋণের জন্য আবেদন করতে পারবেন না
- এই ট্যাক্স সেভার এফডি-তে বিনিয়োগ যেকোন বেসরকারি বা সরকারি ব্যাঙ্কে করা যেতে পারে (সমবায় ও গ্রামীণ ব্যাঙ্ক ছাড়া)
- বিনিয়োগ করা হয়েছেডাক ঘর পাঁচ বছরের বেশি সময়ের জন্য আমানতও ট্যাক্স সেভিং এফডি হিসাবে যোগ্যতা অর্জন করে
- আপনি পোস্ট অফিস এফডি এক পোস্ট অফিস থেকে অন্য পোস্ট অফিসে স্থানান্তর করতে পারেন
- এই ধরনের FD থেকে অর্জিত সুদ করযোগ্য এবং উৎস থেকে কেটে নেওয়া হবে
- ট্যাক্স সেভিং ডিপোজিট অ্যাকাউন্ট পৃথকভাবে পাশাপাশি যৌথভাবে খোলা যেতে পারে।
- যৌথ অ্যাকাউন্টের ক্ষেত্রে, যৌথ অ্যাকাউন্টের প্রথম ধারক কর সুবিধা ভোগ করবেন
Talk to our investment specialist
ELSS বনাম FD - তুলনা
এখানে বিভিন্ন পরামিতিগুলির উপর ELSS এবং ট্যাক্স সেভিং FD-এর মধ্যে পার্থক্যগুলির একটি দ্রুত ওভারভিউ দেওয়া হল:
| প্যারামিটার | FD | ইএলএসএস |
|---|---|---|
| মেয়াদ | 5 বছর লক-ইন | 3 বছর লক-ইন |
| রিটার্নস | 7.00 - 8.00 % (বার্ষিক চক্রবৃদ্ধি) | কোন নিশ্চিত লভ্যাংশ / এটি হিসাবে রিটার্নবাজার সাধারণত প্রায় 16 - 17% প্রতি বছর সংযুক্ত |
| মিন. বিনিয়োগ | রুপি 1000 | রুপি 500 |
| সর্বোচ্চ বিনিয়োগ | কোন উচ্চ সীমা | কোন উচ্চ সীমা |
| 80c-এর নিচে কাটার জন্য যোগ্য পরিমাণ | রুপি ১.৫ লাখ | রুপি ১.৫ লাখ |
| সুদ/রিটার্নের জন্য কর | সুদ করযোগ্য | টাকা পর্যন্ত লাভ ১ লাখ করমুক্ত। টাকার উপরে লাভের ক্ষেত্রে 10% ট্যাক্স প্রযোজ্য। ১ লাখ |
| নিরাপত্তা/রেটিং | নিরাপদ | বিট রিস্কি |
| তারল্য | আপনি 5 বছরের আগে ট্যাক্স সেভিং এফডি তুলতে পারবেন না | আপনি 3 বছর পরে ELSS থেকে প্রস্থান বা প্রত্যাহার করতে পারেন। |
| অনলাইন বিকল্প | সব ব্যাঙ্ক অনলাইনে অফার করে নাসুবিধা একটি এফডি খুলতে | কেউ অনলাইনে একটি ELSS শুরু করতে পারে – একমুহূর্তে বাচুমুক |
শীর্ষ ELSS মিউচুয়াল ফান্ড FY 22 - 23
Fund NAV Net Assets (Cr) 3 MO (%) 6 MO (%) 1 YR (%) 3 YR (%) 5 YR (%) 2024 (%) Motilal Oswal Long Term Equity Fund Growth ₹47.0276
↑ 1.20 ₹3,817 -4.5 -13.5 11.1 22.4 27.1 47.7 IDBI Equity Advantage Fund Growth ₹43.39
↑ 0.04 ₹485 9.7 15.1 16.9 20.8 10 Franklin India Taxshield Growth ₹1,419.98
↑ 17.73 ₹6,359 2.9 -4.9 12.1 18.2 27.7 22.4 JM Tax Gain Fund Growth ₹45.6874
↑ 0.60 ₹184 -0.4 -9.7 10.7 18.2 27.1 29 L&T Tax Advantage Fund Growth ₹126.191
↑ 2.14 ₹3,871 0.2 -7 13.1 17.1 24.5 33 Note: Returns up to 1 year are on absolute basis & more than 1 year are on CAGR basis. as on 21 Apr 25
*নীচে 100 - 15000 কোটির মধ্যে AUM আছে এবং তহবিলের বয়স 3 বছরের উপরে। 3 বছরের পারফরম্যান্সের উপর ভিত্তি করে। (Erstwhile Motilal Oswal MOSt Focused Long Term Fund) The investment objective of the Scheme is to generate long-term capital appreciation from a diversified portfolio of predominantly equity and equity related instruments. However, there can be no assurance or guarantee that the investment objective of the Scheme would be achieved. Motilal Oswal Long Term Equity Fund is a Equity - ELSS fund was launched on 21 Jan 15. It is a fund with Moderately High risk and has given a Below is the key information for Motilal Oswal Long Term Equity Fund Returns up to 1 year are on The Scheme will seek to invest predominantly in a diversified portfolio of equity and equity related instruments with the objective to provide investors with opportunities for capital appreciation and income along with the benefit of income-tax deduction(under section 80C of the Income-tax Act, 1961) on their investments. Investments in this scheme would be subject to a statutory lock-in of 3 years from the date of allotment to be eligible for income-tax benefits under Section 80C. There can be no assurance that the investment objective under the scheme will be realized. IDBI Equity Advantage Fund is a Equity - ELSS fund was launched on 10 Sep 13. It is a fund with Moderately High risk and has given a Below is the key information for IDBI Equity Advantage Fund Returns up to 1 year are on The primary objective for Franklin IndiaTaxshield is to provide medium to long term growth of capital along with income tax rebate Franklin India Taxshield is a Equity - ELSS fund was launched on 10 Apr 99. It is a fund with Moderately High risk and has given a Below is the key information for Franklin India Taxshield Returns up to 1 year are on The investment objective is to generate long-term capital growth from a diversified and actively managed portfolio of equity and equity related securities and to enable investors a deduction from total income, as permitted under the Income Tax Act, 1961 from time to time. However, there can be no assurance that the investment objectives of the Scheme will be realized. The Scheme does not guarantee/indicate any returns. JM Tax Gain Fund is a Equity - ELSS fund was launched on 31 Mar 08. It is a fund with Moderately High risk and has given a Below is the key information for JM Tax Gain Fund Returns up to 1 year are on To generate long-term capital growth from a diversified portfolio of predominantly equity and equity-related securities. L&T Tax Advantage Fund is a Equity - ELSS fund was launched on 27 Feb 06. It is a fund with Moderately High risk and has given a Below is the key information for L&T Tax Advantage Fund Returns up to 1 year are on 1. Motilal Oswal Long Term Equity Fund
CAGR/Annualized return of 16.3% since its launch. Return for 2024 was 47.7% , 2023 was 37% and 2022 was 1.8% . Motilal Oswal Long Term Equity Fund
Growth Launch Date 21 Jan 15 NAV (21 Apr 25) ₹47.0276 ↑ 1.20 (2.61 %) Net Assets (Cr) ₹3,817 on 31 Mar 25 Category Equity - ELSS AMC Motilal Oswal Asset Management Co. Ltd Rating Risk Moderately High Expense Ratio 0.74 Sharpe Ratio 0.26 Information Ratio 0.83 Alpha Ratio 5.9 Min Investment 500 Min SIP Investment 500 Exit Load NIL Growth of 10,000 investment over the years.
Date Value 31 Mar 20 ₹10,000 31 Mar 21 ₹16,396 31 Mar 22 ₹18,690 31 Mar 23 ₹19,798 31 Mar 24 ₹30,510 31 Mar 25 ₹33,744 Returns for Motilal Oswal Long Term Equity Fund
absolute basis & more than 1 year are on CAGR (Compound Annual Growth Rate) basis. as on 21 Apr 25 Duration Returns 1 Month 2.9% 3 Month -4.5% 6 Month -13.5% 1 Year 11.1% 3 Year 22.4% 5 Year 27.1% 10 Year 15 Year Since launch 16.3% Historical performance (Yearly) on absolute basis
Year Returns 2024 47.7% 2023 37% 2022 1.8% 2021 32.1% 2020 8.8% 2019 13.2% 2018 -8.7% 2017 44% 2016 12.5% 2015 Fund Manager information for Motilal Oswal Long Term Equity Fund
Name Since Tenure Ajay Khandelwal 11 Dec 23 1.22 Yr. Rakesh Shetty 22 Nov 22 2.27 Yr. Atul Mehra 1 Oct 24 0.41 Yr. Data below for Motilal Oswal Long Term Equity Fund as on 31 Mar 25
Equity Sector Allocation
Sector Value Industrials 30.18% Consumer Cyclical 22.76% Financial Services 17.97% Technology 12.09% Real Estate 6.8% Basic Materials 6.36% Health Care 2.01% Asset Allocation
Asset Class Value Cash 1.83% Equity 98.17% Top Securities Holdings / Portfolio
Name Holding Value Quantity Zomato Ltd (Consumer Cyclical)
Equity, Since 31 Oct 23 | 5433206% ₹220 Cr 9,923,692 Trent Ltd (Consumer Cyclical)
Equity, Since 31 Aug 22 | 5002516% ₹206 Cr 425,260 Gujarat Fluorochemicals Ltd Ordinary Shares (Basic Materials)
Equity, Since 28 Feb 23 | FLUOROCHEM4% ₹147 Cr 408,886 Kalyan Jewellers India Ltd (Consumer Cyclical)
Equity, Since 31 Oct 23 | KALYANKJIL4% ₹145 Cr 3,134,622 Amber Enterprises India Ltd Ordinary Shares (Consumer Cyclical)
Equity, Since 31 Mar 24 | AMBER4% ₹132 Cr 235,044 Coforge Ltd (Technology)
Equity, Since 31 Jul 24 | COFORGE4% ₹124 Cr 168,355 Kaynes Technology India Ltd (Industrials)
Equity, Since 30 Jun 23 | KAYNES4% ₹123 Cr 297,751 ICICI Bank Ltd (Financial Services)
Equity, Since 30 Nov 18 | ICICIBANK4% ₹120 Cr 995,689 Suzlon Energy Ltd (Industrials)
Equity, Since 31 Jan 24 | SUZLON4% ₹120 Cr 24,068,813 Inox Wind Ltd (Industrials)
Equity, Since 31 Dec 23 | INOXWIND4% ₹119 Cr 7,946,960 2. IDBI Equity Advantage Fund
CAGR/Annualized return of 16% since its launch. Ranked 21 in ELSS category. . IDBI Equity Advantage Fund
Growth Launch Date 10 Sep 13 NAV (28 Jul 23) ₹43.39 ↑ 0.04 (0.09 %) Net Assets (Cr) ₹485 on 30 Jun 23 Category Equity - ELSS AMC IDBI Asset Management Limited Rating ☆☆☆ Risk Moderately High Expense Ratio 2.39 Sharpe Ratio 1.21 Information Ratio -1.13 Alpha Ratio 1.78 Min Investment 500 Min SIP Investment 500 Exit Load NIL Growth of 10,000 investment over the years.
Date Value 31 Mar 20 ₹10,000 31 Mar 21 ₹14,407 31 Mar 22 ₹17,362 31 Mar 23 ₹17,326 Returns for IDBI Equity Advantage Fund
absolute basis & more than 1 year are on CAGR (Compound Annual Growth Rate) basis. as on 21 Apr 25 Duration Returns 1 Month 3.1% 3 Month 9.7% 6 Month 15.1% 1 Year 16.9% 3 Year 20.8% 5 Year 10% 10 Year 15 Year Since launch 16% Historical performance (Yearly) on absolute basis
Year Returns 2024 2023 2022 2021 2020 2019 2018 2017 2016 2015 Fund Manager information for IDBI Equity Advantage Fund
Name Since Tenure Data below for IDBI Equity Advantage Fund as on 30 Jun 23
Equity Sector Allocation
Sector Value Asset Allocation
Asset Class Value Top Securities Holdings / Portfolio
Name Holding Value Quantity 3. Franklin India Taxshield
CAGR/Annualized return of 21% since its launch. Ranked 28 in ELSS category. Return for 2024 was 22.4% , 2023 was 31.2% and 2022 was 5.4% . Franklin India Taxshield
Growth Launch Date 10 Apr 99 NAV (21 Apr 25) ₹1,419.98 ↑ 17.73 (1.26 %) Net Assets (Cr) ₹6,359 on 31 Mar 25 Category Equity - ELSS AMC Franklin Templeton Asst Mgmt(IND)Pvt Ltd Rating ☆☆ Risk Moderately High Expense Ratio 1.83 Sharpe Ratio 0.19 Information Ratio 1.32 Alpha Ratio 2.32 Min Investment 500 Min SIP Investment 500 Exit Load NIL Growth of 10,000 investment over the years.
Date Value 31 Mar 20 ₹10,000 31 Mar 21 ₹17,793 31 Mar 22 ₹21,613 31 Mar 23 ₹22,171 31 Mar 24 ₹32,145 31 Mar 25 ₹35,012 Returns for Franklin India Taxshield
absolute basis & more than 1 year are on CAGR (Compound Annual Growth Rate) basis. as on 21 Apr 25 Duration Returns 1 Month 3.4% 3 Month 2.9% 6 Month -4.9% 1 Year 12.1% 3 Year 18.2% 5 Year 27.7% 10 Year 15 Year Since launch 21% Historical performance (Yearly) on absolute basis
Year Returns 2024 22.4% 2023 31.2% 2022 5.4% 2021 36.7% 2020 9.8% 2019 5.1% 2018 -3% 2017 29.1% 2016 4.7% 2015 4% Fund Manager information for Franklin India Taxshield
Name Since Tenure R. Janakiraman 2 May 16 8.84 Yr. Rajasa Kakulavarapu 1 Dec 23 1.25 Yr. Data below for Franklin India Taxshield as on 31 Mar 25
Equity Sector Allocation
Sector Value Financial Services 30.86% Consumer Cyclical 13.13% Technology 10.95% Industrials 9.83% Health Care 6.41% Communication Services 5.59% Consumer Defensive 5.31% Basic Materials 4.65% Utility 4.03% Energy 3.03% Real Estate 1.63% Asset Allocation
Asset Class Value Cash 3.86% Equity 96.14% Top Securities Holdings / Portfolio
Name Holding Value Quantity HDFC Bank Ltd (Financial Services)
Equity, Since 31 Mar 07 | HDFCBANK9% ₹565 Cr 3,260,417 ICICI Bank Ltd (Financial Services)
Equity, Since 31 Oct 18 | ICICIBANK9% ₹547 Cr 4,546,914 Infosys Ltd (Technology)
Equity, Since 29 Feb 12 | INFY5% ₹325 Cr 1,922,741 Bharti Airtel Ltd (Communication Services)
Equity, Since 31 Jan 07 | BHARTIARTL5% ₹308 Cr 1,963,637
↓ -250,000 Larsen & Toubro Ltd (Industrials)
Equity, Since 31 Dec 19 | LT5% ₹280 Cr 883,853 HCL Technologies Ltd (Technology)
Equity, Since 31 Oct 21 | HCLTECH4% ₹230 Cr 1,462,587 Axis Bank Ltd (Financial Services)
Equity, Since 30 Jun 14 | 5322154% ₹229 Cr 2,252,948 Zomato Ltd (Consumer Cyclical)
Equity, Since 30 Nov 21 | 5433203% ₹167 Cr 7,500,000 United Spirits Ltd (Consumer Defensive)
Equity, Since 31 Oct 18 | UNITDSPR3% ₹164 Cr 1,276,457
↓ -298,543 Kotak Mahindra Bank Ltd (Financial Services)
Equity, Since 30 Nov 17 | KOTAKBANK3% ₹161 Cr 843,530 4. JM Tax Gain Fund
CAGR/Annualized return of 9.3% since its launch. Ranked 18 in ELSS category. Return for 2024 was 29% , 2023 was 30.9% and 2022 was 0.5% . JM Tax Gain Fund
Growth Launch Date 31 Mar 08 NAV (21 Apr 25) ₹45.6874 ↑ 0.60 (1.34 %) Net Assets (Cr) ₹184 on 31 Mar 25 Category Equity - ELSS AMC JM Financial Asset Management Limited Rating ☆☆☆ Risk Moderately High Expense Ratio 2.4 Sharpe Ratio 0.26 Information Ratio 0.48 Alpha Ratio 4.69 Min Investment 500 Min SIP Investment 500 Exit Load NIL Growth of 10,000 investment over the years.
Date Value 31 Mar 20 ₹10,000 31 Mar 21 ₹17,396 31 Mar 22 ₹21,099 31 Mar 23 ₹20,935 31 Mar 24 ₹30,269 31 Mar 25 ₹33,442 Returns for JM Tax Gain Fund
absolute basis & more than 1 year are on CAGR (Compound Annual Growth Rate) basis. as on 21 Apr 25 Duration Returns 1 Month 2% 3 Month -0.4% 6 Month -9.7% 1 Year 10.7% 3 Year 18.2% 5 Year 27.1% 10 Year 15 Year Since launch 9.3% Historical performance (Yearly) on absolute basis
Year Returns 2024 29% 2023 30.9% 2022 0.5% 2021 32.2% 2020 18.3% 2019 14.9% 2018 -4.6% 2017 42.6% 2016 5.2% 2015 -0.6% Fund Manager information for JM Tax Gain Fund
Name Since Tenure Satish Ramanathan 1 Oct 24 0.41 Yr. Asit Bhandarkar 31 Dec 21 3.17 Yr. Chaitanya Choksi 18 Jul 14 10.63 Yr. Ruchi Fozdar 4 Oct 24 0.41 Yr. Data below for JM Tax Gain Fund as on 31 Mar 25
Equity Sector Allocation
Sector Value Financial Services 24.93% Consumer Cyclical 16.94% Basic Materials 12.3% Technology 11.78% Industrials 9.75% Health Care 9.45% Consumer Defensive 4.67% Communication Services 2.88% Utility 1.21% Asset Allocation
Asset Class Value Cash 4.75% Equity 95.25% Top Securities Holdings / Portfolio
Name Holding Value Quantity ICICI Bank Ltd (Financial Services)
Equity, Since 31 Mar 22 | ICICIBANK6% ₹9 Cr 77,975
↑ 20,000 HDFC Bank Ltd (Financial Services)
Equity, Since 31 Dec 11 | HDFCBANK6% ₹9 Cr 54,131 Infosys Ltd (Technology)
Equity, Since 31 Aug 18 | INFY5% ₹8 Cr 45,965
↓ -2,500 Bajaj Finserv Ltd (Financial Services)
Equity, Since 31 Jan 25 | 5329784% ₹7 Cr 35,500
↑ 3,000 Maruti Suzuki India Ltd (Consumer Cyclical)
Equity, Since 30 Sep 24 | MARUTI3% ₹6 Cr 4,706 Bajaj Auto Ltd (Consumer Cyclical)
Equity, Since 30 Sep 24 | 5329773% ₹5 Cr 6,550 State Bank of India (Financial Services)
Equity, Since 31 Aug 20 | SBIN3% ₹5 Cr 72,900 Bharti Airtel Ltd (Communication Services)
Equity, Since 31 Mar 24 | BHARTIARTL3% ₹5 Cr 30,700 Larsen & Toubro Ltd (Industrials)
Equity, Since 30 Nov 10 | LT3% ₹5 Cr 14,447 CreditAccess Grameen Ltd Ordinary Shares (Financial Services)
Equity, Since 31 Oct 24 | CREDITACC2% ₹4 Cr 43,600 5. L&T Tax Advantage Fund
CAGR/Annualized return of 14.2% since its launch. Ranked 7 in ELSS category. Return for 2024 was 33% , 2023 was 28.4% and 2022 was -3% . L&T Tax Advantage Fund
Growth Launch Date 27 Feb 06 NAV (21 Apr 25) ₹126.191 ↑ 2.14 (1.73 %) Net Assets (Cr) ₹3,871 on 31 Mar 25 Category Equity - ELSS AMC L&T Investment Management Ltd Rating ☆☆☆☆ Risk Moderately High Expense Ratio 1.89 Sharpe Ratio 0.38 Information Ratio 0.34 Alpha Ratio 6.76 Min Investment 500 Min SIP Investment 500 Exit Load NIL Growth of 10,000 investment over the years.
Date Value 31 Mar 20 ₹10,000 31 Mar 21 ₹17,157 31 Mar 22 ₹20,223 31 Mar 23 ₹19,900 31 Mar 24 ₹27,682 31 Mar 25 ₹31,345 Returns for L&T Tax Advantage Fund
absolute basis & more than 1 year are on CAGR (Compound Annual Growth Rate) basis. as on 21 Apr 25 Duration Returns 1 Month 2.6% 3 Month 0.2% 6 Month -7% 1 Year 13.1% 3 Year 17.1% 5 Year 24.5% 10 Year 15 Year Since launch 14.2% Historical performance (Yearly) on absolute basis
Year Returns 2024 33% 2023 28.4% 2022 -3% 2021 30.3% 2020 13.5% 2019 4.6% 2018 -8.1% 2017 42.3% 2016 8.1% 2015 2.9% Fund Manager information for L&T Tax Advantage Fund
Name Since Tenure Gautam Bhupal 26 Nov 22 2.26 Yr. Sonal Gupta 21 Jul 21 3.61 Yr. Abhishek Gupta 1 Mar 24 1 Yr. Data below for L&T Tax Advantage Fund as on 31 Mar 25
Equity Sector Allocation
Sector Value Financial Services 24.8% Consumer Cyclical 19.28% Industrials 16.35% Technology 11.48% Basic Materials 6.73% Health Care 5.79% Energy 4.26% Consumer Defensive 3.25% Utility 3.16% Communication Services 2.03% Real Estate 1.44% Asset Allocation
Asset Class Value Cash 1.39% Equity 98.61% Top Securities Holdings / Portfolio
Name Holding Value Quantity HDFC Bank Ltd (Financial Services)
Equity, Since 31 Mar 06 | HDFCBANK6% ₹201 Cr 1,162,500 ICICI Bank Ltd (Financial Services)
Equity, Since 30 Jun 09 | ICICIBANK4% ₹139 Cr 1,155,500 Infosys Ltd (Technology)
Equity, Since 31 Mar 06 | INFY4% ₹131 Cr 774,900 Reliance Industries Ltd (Energy)
Equity, Since 30 Nov 21 | RELIANCE3% ₹114 Cr 951,812 Larsen & Toubro Ltd (Industrials)
Equity, Since 31 Jul 22 | LT3% ₹95 Cr 301,450 Shriram Finance Ltd (Financial Services)
Equity, Since 30 Jun 23 | SHRIRAMFIN2% ₹80 Cr 1,291,500 Bharti Airtel Ltd (Communication Services)
Equity, Since 31 Jan 24 | BHARTIARTL2% ₹73 Cr 467,000 Persistent Systems Ltd (Technology)
Equity, Since 31 Jul 21 | PERSISTENT2% ₹71 Cr 133,000
↓ -27,000 Zomato Ltd (Consumer Cyclical)
Equity, Since 31 Oct 23 | 5433202% ₹70 Cr 3,150,000 State Bank of India (Financial Services)
Equity, Since 31 Jan 19 | SBIN2% ₹68 Cr 984,432
আপনার কি ELSS বা ট্যাক্স সেভিং FD-এ বিনিয়োগ করা উচিত?
নতুন বিনিয়োগ উদ্যোগে নামার আগে, লোকেরা অনেক কিছু বিবেচনা করে। বয়স, বিনিয়োগ দিগন্ত এবংঝুকিপুন্ন ক্ষুধা গুরুত্বপূর্ণ কিছু কারণ। যারা সম্পদ বৃদ্ধি এবং কর সুবিধার দ্বৈত সুবিধা চান তারা ELSS পছন্দ করেন। উদাহরণস্বরূপ, দীর্ঘ বিনিয়োগের দিগন্ত এবং উচ্চ ঝুঁকির ক্ষুধা সহ নতুন বিনিয়োগকারীরা ইএলএসএসকে একটি বুদ্ধিমান বিকল্প খুঁজে পান। কাছের মানুষঅবসর ট্যাক্স সেভিং এফডি-তে বিনিয়োগ করতে পারেন কারণ তাদের ঝুঁকি কম থাকে এবং দীর্ঘ মেয়াদে (কমপক্ষে 5 বছর বা তার বেশি) রিটার্নের নিশ্চয়তা থাকে।
কিভাবে ELSS অনলাইনে বিনিয়োগ করবেন?
Fincash.com এ আজীবনের জন্য বিনামূল্যে বিনিয়োগ অ্যাকাউন্ট খুলুন।
আপনার রেজিস্ট্রেশন এবং KYC প্রক্রিয়া সম্পূর্ণ করুন
নথি আপলোড করুন (প্যান, আধার, ইত্যাদি)।এবং, আপনি বিনিয়োগ করতে প্রস্তুত!
এখানে প্রদত্ত তথ্য সঠিক কিনা তা নিশ্চিত করার জন্য সমস্ত প্রচেষ্টা করা হয়েছে। যাইহোক, তথ্যের সঠিকতা সম্পর্কে কোন গ্যারান্টি দেওয়া হয় না। কোনো বিনিয়োগ করার আগে স্কিমের তথ্য নথির সাথে যাচাই করুন।


AMFI Registration No. 112358 | CIN: U74999MH2016PTC282153
Shepard Technologies Pvt. Ltd. (with ARN code 112358) makes no warranties or representations, express or implied, on products offered through the platform. It accepts no liability for any damages or losses, however caused, in connection with the use of, or on the reliance of its product or related services. Terms and conditions of the website are applicable.
©2025 Shepard Technologies Private Limited. All Rights Reserved