
 +91-22-48913909
Fincash » SIP » SIP Calculator
Table of Contents
- SIP Calculator
- Top 10 Best Performing Funds to Invest 2025
- Understanding SIP Calculator
- SIP Calculator: How Does it Work?
- SIP Calculator: How to Calculator Goal-Wise Returns?
- Benefits of SIP Investment Over Other Investments
- How Invest in Systematic Investment Plan?
- Final Tips for Getting Started with SIP Investment
SIP Calculator
SIP calculator is a tool for investors to determine the expected returns of the SIP investment. With the help of a SIP Calculator, one can calculate the amount of investment and time period of Investing required to reach one's financial goal. The SIP calculator is more like a SIP planner which solves the question of "how much to invest in a SIP". While an investor may get bogged down by many aspects of Mutual Funds such as NAV, "How to Invest In a SIP", which are the Top SIP plans? or Best SIP Mutual Funds, the first question which needs to be answered is "how much to invest in a SIP?" and this is answered by the SIP calculator.
SIP Calculator
Calculate returns on your SIP investment as below-
#Illustration
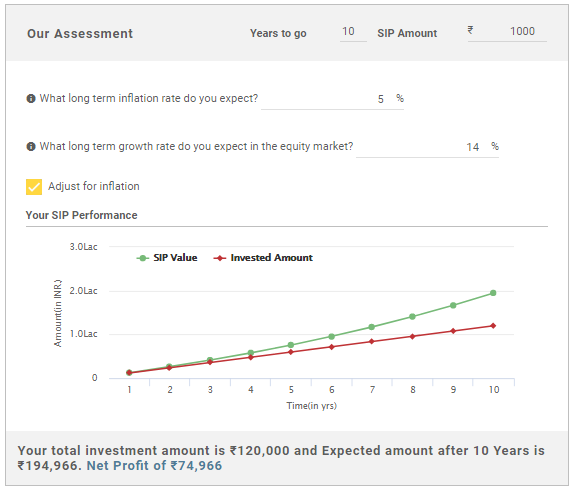
Monthly Investment: ₹ 1,000
Investment Period: 10 years
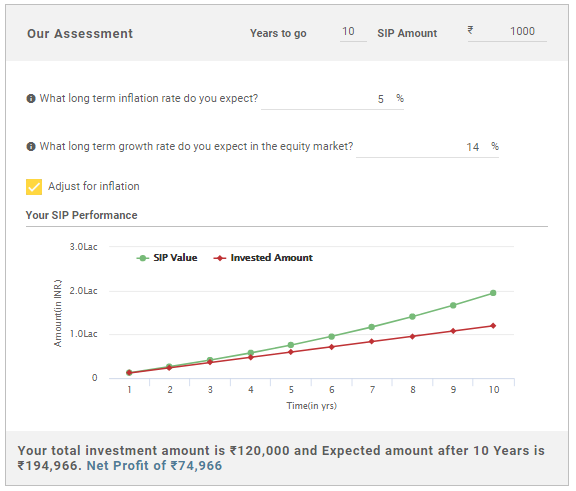
Total Amount Invested: ₹ 1,20,000
Long-term Inflation: 5% (approx)
Long-term Growth Rate: 14% (approx)
Expected Returns as per SIP calculator: ₹ 1,94,966
Net Profit: ₹ 74,966
Know Your SIP Returns
Top 10 Best Performing Funds to Invest 2025
Fund NAV Net Assets (Cr) Min SIP Investment 3 MO (%) 6 MO (%) 1 YR (%) 3 YR (%) 5 YR (%) 2023 (%) SBI PSU Fund Growth ₹30.5732
↓ -0.66 ₹4,789 500 5.3 -1.3 -1.1 30.8 31.4 23.5 Franklin India Opportunities Fund Growth ₹235.185
↓ -3.39 ₹6,047 500 0.5 -2.8 9.9 29.3 32.7 37.3 Invesco India PSU Equity Fund Growth ₹58.62
↓ -1.27 ₹1,217 500 4 -3.9 -0.5 28.8 29.1 25.6 HDFC Infrastructure Fund Growth ₹44.168
↓ -0.95 ₹2,329 300 2 -4.4 0.2 28.4 35.2 23 ICICI Prudential Infrastructure Fund Growth ₹179.59
↓ -3.25 ₹7,214 100 2 -3.6 3.6 28.1 39.1 27.4 Nippon India Power and Infra Fund Growth ₹322.026
↓ -6.66 ₹6,849 100 0.3 -6.3 -0.9 28.1 35.3 26.9 Franklin Build India Fund Growth ₹131.368
↓ -2.42 ₹2,642 500 1.7 -4.3 2 27.7 35.2 27.8 Motilal Oswal Midcap 30 Fund Growth ₹93.0542
↓ -0.72 ₹26,028 500 -4.2 -10.5 13 26.6 37.3 57.1 IDFC Infrastructure Fund Growth ₹46.926
↓ -1.10 ₹1,563 100 0.6 -6.2 0.5 25.8 36.1 39.3 DSP BlackRock India T.I.G.E.R Fund Growth ₹288.24
↓ -4.91 ₹4,880 500 -0.8 -9.4 -0.3 25.7 34.8 32.4 Note: Returns up to 1 year are on absolute basis & more than 1 year are on CAGR basis. as on 25 Apr 25 Assets >= 200 Crore & Sorted on 3 Year CAGR Returns.
Understanding SIP Calculator
Many people who are new to investing, find it difficult to understand SIP calculator and its working. Therefore, we have tried to solve their problem by giving detailed information. Read below to know!
When using a SIP calculator, you have to fill certain variables like-
- The desired investment duration
- The estimated monthly SIP amount
- Expected inflation rate (annual) for the years to come
- Long-term growth rate on investments
- Once you feed all the above-mentioned information, the calculator will end up giving you the amount you will receive (your SIP returns) after the number of years mentioned. Your net profit will be highlighted as well so that you can estimate your goal fulfilment accordingly.
SIP Calculator: How Does it Work?
SIP calculator is one of the best tools for effective financial planning. While one may select the best SIP mutual funds, monitor the NAVs and SIP returns, however, strategy and planning are very important and this is where the SIP return calculator plays a critical role. Whether one wants to plan to buy a house, car, any asset, plan for retirement, a child's higher education or any other financial goal, the SIP calculator can be used for the same.
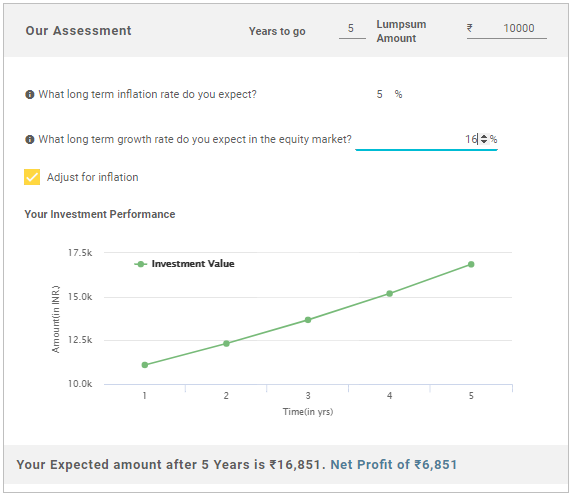
The SIP calculator requires some basic inputs like investment amount, the frequency of investing (weekly, monthly, quarterly) and period of investing (additional inputs like inflation and expected Market returns will give a more realistic picture). The output from this would be the final amount at maturity and gains made. A similar calculation with a goal in mind can also be made to determine the amount one should invest in a SIP to reach there. The entire calculation of SIP returns is mentioned below. Take a look!
The below calculation is based on the above-mentioned values. Those are-
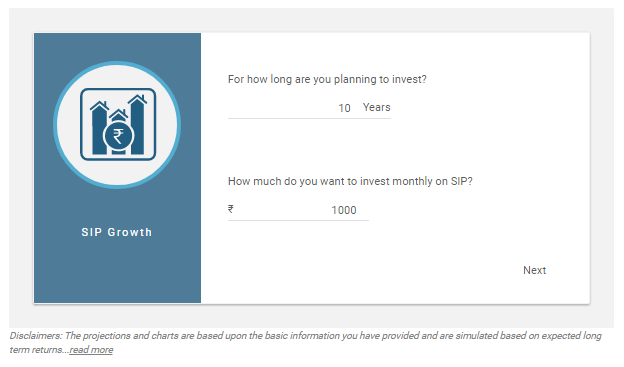
Monthly Investment: ₹ 1,000
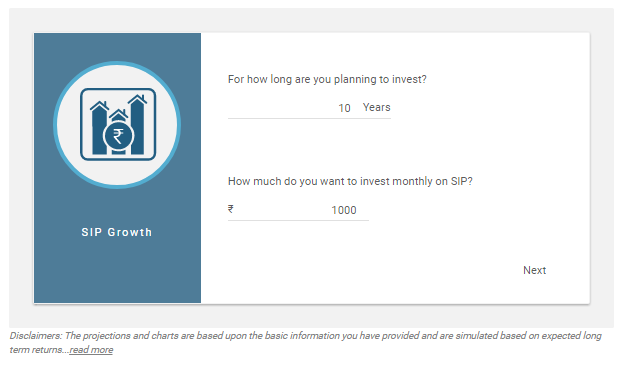
Investment Period: 10 years
Talk to our investment specialist
1. How much do you wish to invest in SIP?
The first thing that you need to do is to select an amount you wish to invest monthly. This amount should be chosen considering various factors like- your Financial goals, your current Earnings and your fixed savings. Once you are sure of the amount you can easily start to invest. Moreover, the minimum amount of invest in SIP is as less as INR 500. In the below example, the amount chosen is INR 1,000.
2. Tenure of SIP investment?
When making a SIP investment, you should know the number of years you can invest to achieve a certain financial goal. For example: if I started investing at the age of 24 with a goal of buying a new house, I would estimate the time of investment to be 5 years and calculate the SIP returns accordingly. In the below example, the time of investment is chosen as 10 years.
3. Long-term inflation & growth rate of market
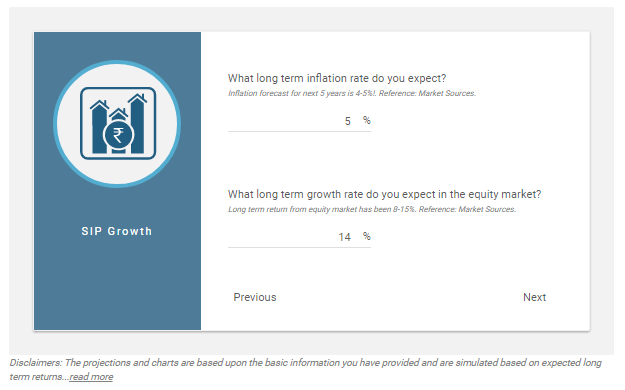
Then comes, the average inflation rate and the growth rate of the market in the years to come till you fulfil your goal. As per market resources, the average inflation rate can be taken around 4-5% p.a. and the growth rate can be taken upto 12-14% p.a. However, one can enter their own assumptions also. In this example, the inflation and growth rate are pre-filled as 5% and 14% respectively.
4. SIP investment evaluation
Now, you get the know most awaited result of SIP calculator. Taking the above values into consideration, you get to know the SIP returns you will make in the estimated time and what is the net profit you earn. Here, by investing a total of INR 1,20,000, the total earning is INR 1,94,966. Therefore, the net profit of a person investing INR 1000 monthly for 10 years is INR 74,966 (refer the image below).
SIP Calculator: How to Calculator Goal-Wise Returns?
Investors who wish to fulfil a certain goal, like buying a car or a vehicle, can also calculate the SIP investment returns using our SIP calculator. The process of calculating returns here is quite similar as above. In goal-wise SIP calculation-
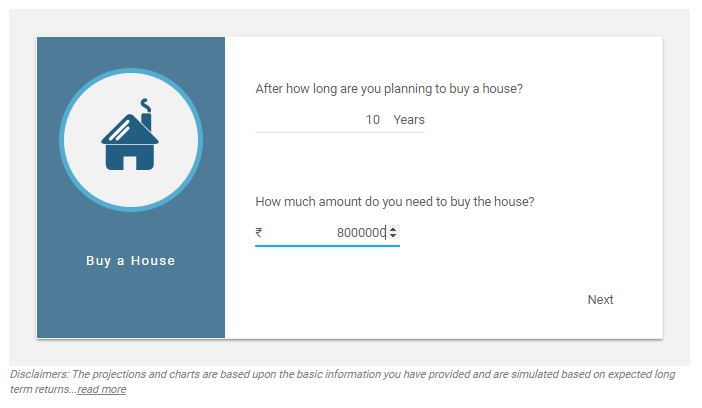
You have to choose a particular goal. In the example, the goal chosen is "buy a house".

Enter the expected duration of investment and the amount needs from the SIP investment. Here, the SIP duration is 10 years and the amount needed is INR 80,00,000.
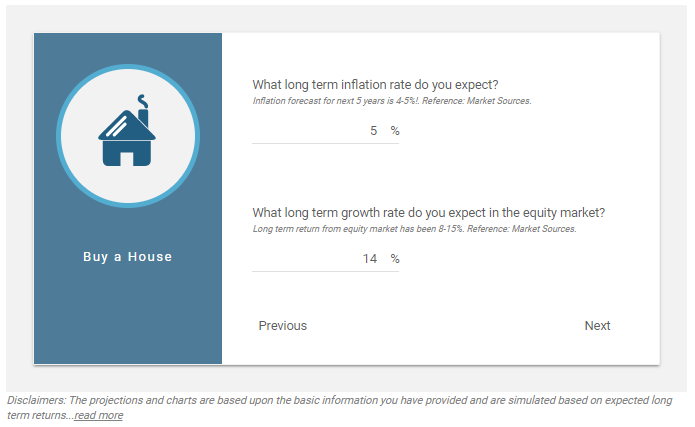
A pre-filled screen with estimated returns and growth rate percentage occurs. You can enter your own values as well. In this example, the estimated inflation is 5% and the growth rate is 14%.
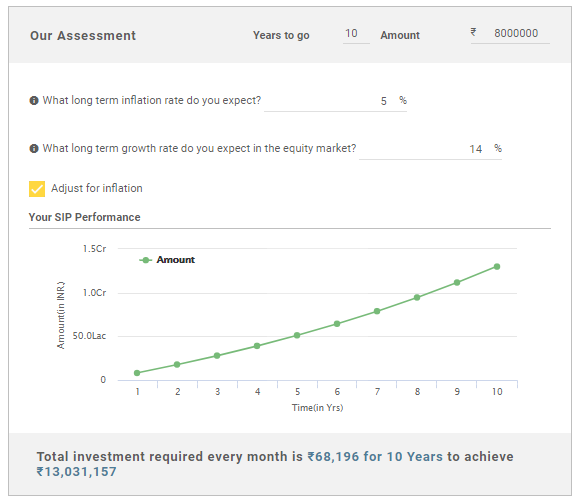
Final screen occurs with your result. As per the above-mentioned detail, the SIP investment required every month is INR 68,196 to earn INR 1,30,31,157 approximately.
Benefits of SIP Investment Over Other Investments
SIP or Systematic Investment plan is one of the Best ways to invest money as it offers various benefits. Read below to know-
Effect of compounding
One of the major Benefits of SIP (Systematic Investment Plan) is the Power of Compounding. What is it? With the effect of compounding, the interest earned becomes a part of the base Capital and the subsequent interest is evaluated on the new increased capital value. Unlike simple interest, compounding leads to an exponential growth of money. Also, the compounding effect increases as the investment tenure increases.
Illustration:
| Parameter | SIP Investment Amount | SIP Investment Tenure | Rate of Interest | Returns Received | Total Gains |
|---|---|---|---|---|---|
| Simple Interest | 100 | 5 years | 10% | 50 | 150 |
| Compound Interest | 100 | 5 years | 10% | 61 | 161 |
The above table shows that there was a total 7% increase in the output when calculated on the compounding Basis. This might seem a small number now, but as the tenure increases, the numbers seem to increase drastically.
Rupee cost averaging
Rupee cost averaging is a technique used to invest money in the stock market at regular intervals of time (mostly monthly). Since investors sign-up for a long-term investment plan, by virtue of the fact that investing continues during the bad cycles of the stock market, investors are able to "buy low". For lump sum investments, most investors when they see a falling market or a bad phase, they defer their decisions to invest. During these periods a SIP continues its investing and ensures that the investor gets the benefit of a falling market.
How Invest in Systematic Investment Plan?
Open Free Investment Account for Lifetime at Fincash.com
Complete your Registration and KYC Process
Upload Documents (PAN, Aadhaar, etc.). And, You are Ready to Invest!
Final Tips for Getting Started with SIP Investment
- Set your financial goals and invest accordingly. The goals should be well-thought and attainable.
- Decide a timeline. You much be sure of your investment tenure to assure effective financial planning.
- Determine the amount of investment. Know how much can you invest to achieve your desired financial goals. With a SIP, you need to invest regularly, so make sure you will be able to invest the same amount every month.
- Make a wise choice. Consult your financial advisor and make a wise investment plan accordingly.
All efforts have been made to ensure the information provided here is accurate. However, no guarantees are made regarding correctness of data. Please verify with scheme information document before making any investment.





This page was very helpful. Thank you fincash