Table of Contents
એસઆઈપી વિ આરડી
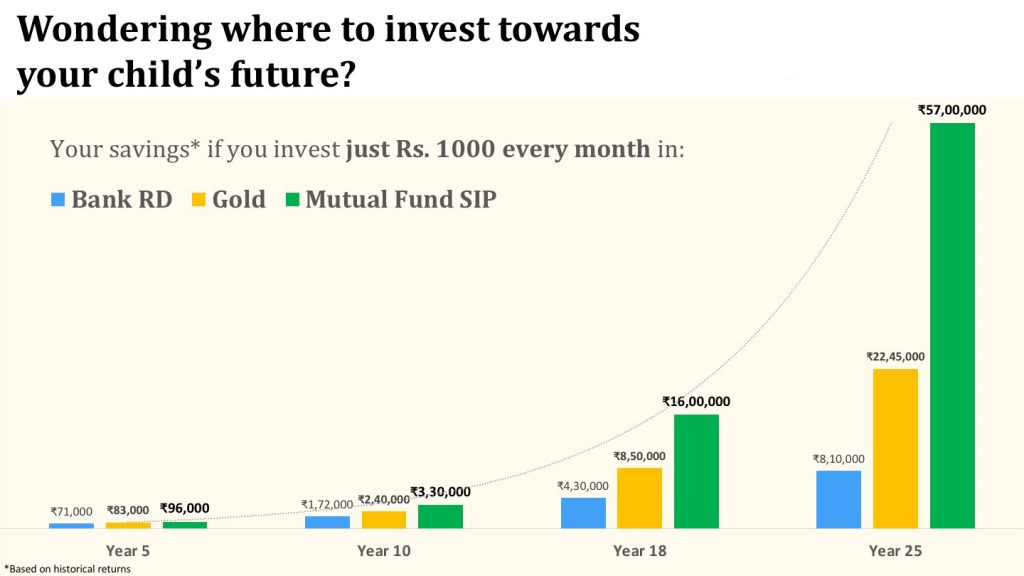
રોકાણનો સારો વિકલ્પ કયો છે?
SIP વિ આરડી?ક્યાં રોકાણ કરવું સારી સંપત્તિ સર્જન માટે? સંપત્તિ પેદા કરવા માટેનો અંતિમ અભિગમ દર મહિને નાણાં બચાવવા છે. લાક્ષણિક રીતે, એક વ્યવસ્થિતરોકાણ યોજના (SIP) અને એક RD (રિકરિંગ ડિપોઝિટ) ભારતમાં રોકાણના સૌથી કાર્યક્ષમ વિકલ્પો પૈકીના બે છેનાણાં બચાવવા દર મહિને. SIP અને RD બંને રોકાણકારોને સારું વળતર મેળવવા માટે નિયમિત અંતરાલમાં નાની રકમનું રોકાણ કરવા સક્ષમ બનાવે છે. સિસ્ટમેટિક ઇન્વેસ્ટમેન્ટ પ્લાન (SIP) સાથે, રોકાણકારોએ કમાણી કરવા માટે, માસિક અથવા ત્રિમાસિક, નાની રકમનું રોકાણ કરવું પડશે.બજાર- લિંક કરેલ વળતર. જ્યારે આરડી (રિકરિંગ ડિપોઝિટ) સાથે, ધરોકાણકાર નિશ્ચિત વળતર મેળવવા માટે પૂર્વ-નિર્ધારિત સમયગાળા માટે નિશ્ચિત રકમનું રોકાણ કરે છે. હવે, રોકાણકારો એનો ઉપયોગ કરીને સરળતાથી SIP વળતરની ગણતરી કરી શકે છેસિપ કેલ્ક્યુલેટર અને RD નો ઉપયોગ કરીને પરત કરે છેઆરડી કેલ્ક્યુલેટર તેમની રોકાણની જરૂરિયાતોનો અંદાજ કાઢવા.
ભારતમાં, કેટલાક સૌથી અનુકૂળ સામયિક રોકાણ વિકલ્પોમાં SIP, RD અને સમાવેશ થાય છેપીપીએફ (SIP સૌથી લોકપ્રિય છે).
SIP Vs RD - ઉત્પાદન માળખું
સિસ્ટમેટિક ઇન્વેસ્ટમેન્ટ પ્લાન (SIP)
SIP એ છેરોકાણ ચોક્કસ રકમનું રોકાણ કરવાની રીતમ્યુચ્યુઅલ ફંડ સમયાંતરે માટે ન્યૂનતમ રકમSIP માં રોકાણ કરો INR 500 જેટલો ઓછો છે. સામાન્ય રીતે, ઇક્વિટીમાં SIP ને સારું વળતર આપવાનું કહેવાય છે કારણ કે તે બજાર સાથે જોડાયેલ છે અને બજારને અનુરૂપ વળતર આપી શકે છે. વિવિધ સ્ત્રોતો મુજબ, લાંબા ગાળામાં SIP વળતર 12% થી 22% p.a. જેટલું ઊંચું હોઈ શકે છે, જે RD (રિકરિંગ ડિપોઝિટ) દ્વારા ઓફર કરવામાં આવતા વ્યાજ દરો કરતાં ઘણું વધારે છે. SIP (સિસ્ટમેટિક ઇન્વેસ્ટમેન્ટ પ્લાન) નો એકમાત્ર ગેરલાભ એ છે કે SIP વળતર અસ્થિર છે કારણ કે તે બજાર સાથે જોડાયેલ છે, તેથી જોખમપરિબળ ઘણી ઊંચી છે. જો કે, જ્યારે લાંબા ગાળા માટે રોકાણ કરવામાં આવે છે, ત્યારે SIP ને સારું વળતર આપવાનું માનવામાં આવે છે.
રિકરિંગ ડિપોઝિટ (RD)
રિકરિંગ ડિપોઝિટ અથવા આરડી એ એક રોકાણ યોજના છે જેમાં રોકાણકારે રોકાણ કરતા પહેલા રોકાણની રકમ અને રોકાણની મુદત પસંદ કરવાની હોય છે. આરડી હેઠળ, રોકાણકારે અમુક વ્યાજ અને રોકાણ કરેલી રકમ મેળવવા માટે પસંદ કરેલા સમયગાળામાં માસિક રોકાણ કરવું પડે છે. સામાન્ય રીતે, RD નો વ્યાજ દર 7% થી 9% p.a. સુધી બદલાય છે. અને પરિણામે વરિષ્ઠ નાગરિકો માટે વધુ છે. RD રિટર્ન રેટ ફિક્સ્ડ ડિપોઝિટ અને SIP કરતાં ઘણો ઓછો છે કારણ કે RD પ્રથમ ડિપોઝિટ પર જ આખા 12 મહિનાનું વ્યાજ મેળવે છે. આરડીમાં બીજી ડિપોઝિટ પર, 11 મહિના માટે વ્યાજ મળે છે, ત્રીજી ડિપોઝિટ પર 10 મહિના માટે અને તેથી વધુ. તેથી, આરડીમાં કોઈ સંયોજન લાભો નથી, તેનાથી વિપરીતFD અને SIP. આરડી રિટર્ન નિશ્ચિત છે અને આરડી કેલ્ક્યુલેટરનો ઉપયોગ કરીને સરળતાથી ગણતરી કરી શકાય છે. રિકરિંગ ડિપોઝિટનો મુખ્ય ગેરલાભ એ છે કે તે કર કાર્યક્ષમ નથી. વ્યાજ પર TDS (ટેક્સ ડિડક્ટેડ એટ સોર્સ) લાગુ થાય છેઆવક આરડી તરફથી
Talk to our investment specialist
ટોચના 7 પર્ફોર્મિંગ બેલેન્સ્ડ ફંડ SIP
તરીકેસંતુલિત ભંડોળ કરતાં ઓછા જોખમી હોય છેઇક્વિટી મ્યુચ્યુઅલ ફંડ્સ, સંતુલિત ફંડ લાંબા સમય સુધી સ્થિર વળતર આપી શકે છે. નીચેના ભંડોળની સૂચિ છેલ્લા 3 વર્ષના વાર્ષિક વળતર પર આધારિત છે (CAGR) અને વધુ નેટ અસ્કયામતો ધરાવતા ભંડોળ500 કરોડ અને ફંડ ઉંમર > 3 વર્ષ.
(Erstwhile JM Balanced Fund) To provide steady current income as well as long term growth of capital. JM Equity Hybrid Fund is a Hybrid - Hybrid Equity fund was launched on 1 Apr 95. It is a fund with Moderately High risk and has given a Below is the key information for JM Equity Hybrid Fund Returns up to 1 year are on (Erstwhile HDFC Growth Fund and HDFC Prudence Fund) Aims to generate long term capital appreciation from a portfolio that is invested predominantly in equity and equity related instruments. HDFC Balanced Advantage Fund is a Hybrid - Dynamic Allocation fund was launched on 11 Sep 00. It is a fund with Moderately High risk and has given a Below is the key information for HDFC Balanced Advantage Fund Returns up to 1 year are on (Erstwhile ICICI Prudential Balanced Fund) To generate long term capital appreciation and current income from a portfolio
that is invested in equity and equity related securities as well as in fixed income
securities. ICICI Prudential Equity and Debt Fund is a Hybrid - Hybrid Equity fund was launched on 3 Nov 99. It is a fund with Moderately High risk and has given a Below is the key information for ICICI Prudential Equity and Debt Fund Returns up to 1 year are on (Erstwhile UTI Wealth Builder Fund) The objective of the Scheme is to achieve long term capital appreciation by investing predominantly in a diversified portfolio of equity and equity related instruments along with investments in Gold ETFs and Debt and Money Market Instruments. However, there can be no assurance that the investment objective of the Scheme will be achieved. UTI Multi Asset Fund is a Hybrid - Multi Asset fund was launched on 21 Oct 08. It is a fund with Moderately High risk and has given a Below is the key information for UTI Multi Asset Fund Returns up to 1 year are on (Erstwhile ICICI Prudential Dynamic Plan) To generate capital appreciation by actively investing in equity and equity related securities. For defensive considerations, the Scheme may invest in debt, money market instruments and derivatives. The investment manager will have the discretion to take aggressive asset calls i.e. by staying 100% invested in equity market/equity related instruments at a given point of time and 0% at another, in which case, the fund may be invested in debt related instruments at its discretion. The AMC may choose to churn the portfolio of the Scheme in order to achieve the investment objective. The Scheme is suitable for investors seeking high returns and for those who are willing to take commensurate risks. ICICI Prudential Multi-Asset Fund is a Hybrid - Multi Asset fund was launched on 31 Oct 02. It is a fund with Moderately High risk and has given a Below is the key information for ICICI Prudential Multi-Asset Fund Returns up to 1 year are on (Erstwhile UTI Balanced Fund) The scheme aims to invest in a portfolio of equity/equity related securities and fixed income securities (debt and money market securities) with a view to generating regular income together with capital appreciation. UTI Hybrid Equity Fund is a Hybrid - Hybrid Equity fund was launched on 2 Jan 95. It is a fund with Moderately High risk and has given a Below is the key information for UTI Hybrid Equity Fund Returns up to 1 year are on (Erstwhile Edelweiss Prudent Advantage Fund) The objective of the Scheme is to generate returns through capital appreciation by investing in diversified portfolio of equity and equity-related securities, fixed income instruments and Gold Exchange Traded Funds.
However, there is no assurance that the investment objective of the Scheme will be realized. Edelweiss Multi Asset Allocation Fund is a Hybrid - Multi Asset fund was launched on 12 Aug 09. It is a fund with Moderately High risk and has given a Below is the key information for Edelweiss Multi Asset Allocation Fund Returns up to 1 year are on 1. JM Equity Hybrid Fund
CAGR/Annualized return of 12.6% since its launch. Ranked 35 in Hybrid Equity category. Return for 2024 was 27% , 2023 was 33.8% and 2022 was 8.1% . JM Equity Hybrid Fund
Growth Launch Date 1 Apr 95 NAV (24 Apr 25) ₹117.656 ↓ -0.02 (-0.02 %) Net Assets (Cr) ₹768 on 31 Mar 25 Category Hybrid - Hybrid Equity AMC JM Financial Asset Management Limited Rating ☆ Risk Moderately High Expense Ratio 2.36 Sharpe Ratio 0.07 Information Ratio 1.04 Alpha Ratio 0.05 Min Investment 5,000 Min SIP Investment 500 Exit Load 0-60 Days (1%),60 Days and above(NIL) Growth of 10,000 investment over the years.
Date Value 31 Mar 20 ₹10,000 31 Mar 21 ₹17,786 31 Mar 22 ₹20,451 31 Mar 23 ₹21,645 31 Mar 24 ₹32,246 31 Mar 25 ₹34,502 Returns for JM Equity Hybrid Fund
absolute basis & more than 1 year are on CAGR (Compound Annual Growth Rate) basis. as on 24 Apr 25 Duration Returns 1 Month 2.8% 3 Month 2.2% 6 Month -5.9% 1 Year 6% 3 Year 20.9% 5 Year 28.2% 10 Year 15 Year Since launch 12.6% Historical performance (Yearly) on absolute basis
Year Returns 2023 27% 2022 33.8% 2021 8.1% 2020 22.9% 2019 30.5% 2018 -8.1% 2017 1.7% 2016 18.5% 2015 3% 2014 -0.2% Fund Manager information for JM Equity Hybrid Fund
Name Since Tenure Satish Ramanathan 1 Oct 24 0.41 Yr. Asit Bhandarkar 31 Dec 21 3.17 Yr. Chaitanya Choksi 20 Aug 21 3.53 Yr. Ruchi Fozdar 4 Oct 24 0.41 Yr. Data below for JM Equity Hybrid Fund as on 31 Mar 25
Asset Allocation
Asset Class Value Cash 12.53% Equity 69.26% Debt 18.22% Equity Sector Allocation
Sector Value Financial Services 22.12% Consumer Cyclical 11.89% Technology 9.76% Health Care 8.86% Consumer Defensive 4.28% Basic Materials 4.23% Communication Services 3.55% Industrials 3.18% Debt Sector Allocation
Sector Value Cash Equivalent 11.24% Government 10.52% Corporate 8.99% Credit Quality
Rating Value AA 0.7% AAA 99.3% Top Securities Holdings / Portfolio
Name Holding Value Quantity Bajaj Finance Ltd (Financial Services)
Equity, Since 31 Jan 25 | 5000346% ₹43 Cr 50,004
↑ 7,000 Infosys Ltd (Technology)
Equity, Since 30 Nov 20 | INFY5% ₹34 Cr 200,000 HDFC Bank Ltd (Financial Services)
Equity, Since 30 Jun 24 | HDFCBANK4% ₹29 Cr 167,000 ICICI Bank Ltd (Financial Services)
Equity, Since 31 Oct 21 | ICICIBANK4% ₹29 Cr 240,114
↑ 40,000 Bharti Airtel Ltd (Communication Services)
Equity, Since 31 Oct 24 | BHARTIARTL4% ₹26 Cr 165,000 6.92% Govt Stock 2039
Sovereign Bonds | -4% ₹26 Cr 2,550,000
↑ 1,000,000 Bajaj Auto Ltd (Consumer Cyclical)
Equity, Since 31 Oct 23 | 5329773% ₹25 Cr 31,280 Kotak Mahindra Bank Ltd (Financial Services)
Equity, Since 31 Jan 25 | KOTAKBANK3% ₹23 Cr 120,000
↑ 60,000 Voltas Ltd (Consumer Cyclical)
Equity, Since 31 Oct 23 | VOLTAS3% ₹20 Cr 150,000
↑ 75,000 Jubilant Foodworks Ltd (Consumer Cyclical)
Equity, Since 30 Nov 24 | JUBLFOOD2% ₹18 Cr 285,000
↓ -15,000 2. HDFC Balanced Advantage Fund
CAGR/Annualized return of 18.2% since its launch. Ranked 23 in Dynamic Allocation category. Return for 2024 was 16.7% , 2023 was 31.3% and 2022 was 18.8% . HDFC Balanced Advantage Fund
Growth Launch Date 11 Sep 00 NAV (24 Apr 25) ₹503.309 ↓ -0.55 (-0.11 %) Net Assets (Cr) ₹90,375 on 28 Feb 25 Category Hybrid - Dynamic Allocation AMC HDFC Asset Management Company Limited Rating ☆☆☆☆ Risk Moderately High Expense Ratio 1.43 Sharpe Ratio -0.27 Information Ratio 0 Alpha Ratio 0 Min Investment 5,000 Min SIP Investment 300 Exit Load 0-1 Years (1%),1 Years and above(NIL) Growth of 10,000 investment over the years.
Date Value 31 Mar 20 ₹10,000 31 Mar 21 ₹15,696 31 Mar 22 ₹18,998 31 Mar 23 ₹21,519 31 Mar 24 ₹30,051 31 Mar 25 ₹32,636 Returns for HDFC Balanced Advantage Fund
absolute basis & more than 1 year are on CAGR (Compound Annual Growth Rate) basis. as on 24 Apr 25 Duration Returns 1 Month 2.1% 3 Month 3.8% 6 Month 0.2% 1 Year 9.3% 3 Year 19.5% 5 Year 26.2% 10 Year 15 Year Since launch 18.2% Historical performance (Yearly) on absolute basis
Year Returns 2023 16.7% 2022 31.3% 2021 18.8% 2020 26.4% 2019 7.6% 2018 6.9% 2017 -3.1% 2016 27.9% 2015 9.4% 2014 0.3% Fund Manager information for HDFC Balanced Advantage Fund
Name Since Tenure Anil Bamboli 29 Jul 22 2.59 Yr. Gopal Agrawal 29 Jul 22 2.59 Yr. Arun Agarwal 6 Oct 22 2.4 Yr. Srinivasan Ramamurthy 29 Jul 22 2.59 Yr. Nirman Morakhia 15 Feb 23 2.04 Yr. Dhruv Muchhal 22 Jun 23 1.69 Yr. Data below for HDFC Balanced Advantage Fund as on 28 Feb 25
Asset Allocation
Asset Class Value Cash 8.45% Equity 60.71% Debt 30.84% Equity Sector Allocation
Sector Value Financial Services 21.86% Industrials 7.75% Energy 7.1% Technology 6.26% Consumer Cyclical 5.72% Utility 4.22% Health Care 4.2% Communication Services 2.69% Consumer Defensive 2.59% Basic Materials 2.04% Real Estate 1.57% Debt Sector Allocation
Sector Value Government 15.74% Corporate 14.63% Cash Equivalent 8.92% Credit Quality
Rating Value AA 0.91% AAA 99.09% Top Securities Holdings / Portfolio
Name Holding Value Quantity HDFC Bank Ltd (Financial Services)
Equity, Since 31 Mar 22 | HDFCBANK6% ₹5,160 Cr 29,787,551
↓ -4,127,200 ICICI Bank Ltd (Financial Services)
Equity, Since 31 Oct 09 | ICICIBANK4% ₹3,373 Cr 28,010,724
↓ -830,900 Infosys Ltd (Technology)
Equity, Since 31 Oct 09 | INFY3% ₹3,104 Cr 18,390,088
↑ 2,000,000 Reliance Industries Ltd (Energy)
Equity, Since 31 Dec 21 | RELIANCE3% ₹2,960 Cr 24,664,288
↓ -459,500 State Bank of India (Financial Services)
Equity, Since 31 May 07 | SBIN3% ₹2,718 Cr 39,455,000 7.18% Govt Stock 2033
Sovereign Bonds | -3% ₹2,342 Cr 228,533,300 NTPC Ltd (Utilities)
Equity, Since 31 Aug 16 | 5325552% ₹2,191 Cr 70,337,915 Larsen & Toubro Ltd (Industrials)
Equity, Since 30 Jun 12 | LT2% ₹2,103 Cr 6,645,683
↓ -168,950 Bharti Airtel Ltd (Communication Services)
Equity, Since 31 Aug 20 | BHARTIARTL2% ₹2,069 Cr 13,179,354
↑ 300,000 Coal India Ltd (Energy)
Equity, Since 31 Jan 18 | COALINDIA2% ₹2,063 Cr 55,854,731 3. ICICI Prudential Equity and Debt Fund
CAGR/Annualized return of 15.4% since its launch. Ranked 7 in Hybrid Equity category. Return for 2024 was 17.2% , 2023 was 28.2% and 2022 was 11.7% . ICICI Prudential Equity and Debt Fund
Growth Launch Date 3 Nov 99 NAV (24 Apr 25) ₹380.97 ↓ -0.91 (-0.24 %) Net Assets (Cr) ₹40,962 on 31 Mar 25 Category Hybrid - Hybrid Equity AMC ICICI Prudential Asset Management Company Limited Rating ☆☆☆☆ Risk Moderately High Expense Ratio 1.78 Sharpe Ratio 0.26 Information Ratio 1.86 Alpha Ratio 1.98 Min Investment 5,000 Min SIP Investment 100 Exit Load 0-1 Years (1%),1 Years and above(NIL) Growth of 10,000 investment over the years.
Date Value 31 Mar 20 ₹10,000 31 Mar 21 ₹16,015 31 Mar 22 ₹21,325 31 Mar 23 ₹22,530 31 Mar 24 ₹31,792 31 Mar 25 ₹34,795 Returns for ICICI Prudential Equity and Debt Fund
absolute basis & more than 1 year are on CAGR (Compound Annual Growth Rate) basis. as on 24 Apr 25 Duration Returns 1 Month 2.8% 3 Month 6.8% 6 Month 1.9% 1 Year 11.6% 3 Year 18.6% 5 Year 27.6% 10 Year 15 Year Since launch 15.4% Historical performance (Yearly) on absolute basis
Year Returns 2023 17.2% 2022 28.2% 2021 11.7% 2020 41.7% 2019 9% 2018 9.3% 2017 -1.9% 2016 24.8% 2015 13.7% 2014 2.1% Fund Manager information for ICICI Prudential Equity and Debt Fund
Name Since Tenure Sankaran Naren 7 Dec 15 9.24 Yr. Manish Banthia 19 Sep 13 11.45 Yr. Mittul Kalawadia 29 Dec 20 4.17 Yr. Akhil Kakkar 22 Jan 24 1.11 Yr. Sri Sharma 30 Apr 21 3.84 Yr. Sharmila D’mello 31 Jul 22 2.59 Yr. Nitya Mishra 4 Nov 24 0.32 Yr. Data below for ICICI Prudential Equity and Debt Fund as on 31 Mar 25
Asset Allocation
Asset Class Value Cash 9.94% Equity 71.65% Debt 17.89% Equity Sector Allocation
Sector Value Financial Services 22.23% Consumer Cyclical 11.05% Energy 7.13% Health Care 5.89% Utility 5.74% Industrials 5.43% Communication Services 4.64% Consumer Defensive 4.21% Technology 3.23% Basic Materials 2.53% Real Estate 1.52% Debt Sector Allocation
Sector Value Corporate 12% Cash Equivalent 8.02% Government 7.55% Securitized 0.78% Credit Quality
Rating Value A 3.59% AA 30.61% AAA 65.81% Top Securities Holdings / Portfolio
Name Holding Value Quantity HDFC Bank Ltd (Financial Services)
Equity, Since 30 Apr 21 | HDFCBANK7% ₹2,643 Cr 15,255,052
↑ 500,000 ICICI Bank Ltd (Financial Services)
Equity, Since 31 Jul 12 | ICICIBANK6% ₹2,445 Cr 20,309,765 NTPC Ltd (Utilities)
Equity, Since 28 Feb 17 | 5325555% ₹2,115 Cr 67,916,745
↓ -1,933,121 Maruti Suzuki India Ltd (Consumer Cyclical)
Equity, Since 31 Jul 21 | MARUTI5% ₹1,967 Cr 1,646,589
↓ -40,000 Bharti Airtel Ltd (Communication Services)
Equity, Since 31 May 16 | BHARTIARTL4% ₹1,715 Cr 10,920,680 Sun Pharmaceuticals Industries Ltd (Healthcare)
Equity, Since 31 May 16 | SUNPHARMA4% ₹1,605 Cr 10,075,438
↑ 445,000 Oil & Natural Gas Corp Ltd (Energy)
Equity, Since 30 Apr 17 | 5003123% ₹1,226 Cr 54,447,874
↑ 2,500,000 Reliance Industries Ltd (Energy)
Equity, Since 30 Jun 22 | RELIANCE3% ₹1,128 Cr 9,398,686
↑ 900,000 Avenue Supermarts Ltd (Consumer Defensive)
Equity, Since 31 Jan 23 | 5403763% ₹1,088 Cr 3,196,567
↑ 10,000 Axis Bank Ltd (Financial Services)
Equity, Since 31 Mar 21 | 5322153% ₹1,028 Cr 10,125,460 4. UTI Multi Asset Fund
CAGR/Annualized return of 12.7% since its launch. Ranked 34 in Multi Asset category. Return for 2024 was 20.7% , 2023 was 29.1% and 2022 was 4.4% . UTI Multi Asset Fund
Growth Launch Date 21 Oct 08 NAV (24 Apr 25) ₹72.3016 ↓ -0.10 (-0.14 %) Net Assets (Cr) ₹5,285 on 31 Mar 25 Category Hybrid - Multi Asset AMC UTI Asset Management Company Ltd Rating ☆ Risk Moderately High Expense Ratio 1.62 Sharpe Ratio 0.2 Information Ratio 0 Alpha Ratio 0 Min Investment 5,000 Min SIP Investment 500 Exit Load 0-12 Months (1%),12 Months and above(NIL) Growth of 10,000 investment over the years.
Date Value 31 Mar 20 ₹10,000 31 Mar 21 ₹13,699 31 Mar 22 ₹15,067 31 Mar 23 ₹15,793 31 Mar 24 ₹22,067 31 Mar 25 ₹23,964 Returns for UTI Multi Asset Fund
absolute basis & more than 1 year are on CAGR (Compound Annual Growth Rate) basis. as on 24 Apr 25 Duration Returns 1 Month 3.1% 3 Month 3.4% 6 Month 0.4% 1 Year 10% 3 Year 18.4% 5 Year 18.5% 10 Year 15 Year Since launch 12.7% Historical performance (Yearly) on absolute basis
Year Returns 2023 20.7% 2022 29.1% 2021 4.4% 2020 11.8% 2019 13.1% 2018 3.9% 2017 -0.5% 2016 17.1% 2015 7.3% 2014 -3.7% Fund Manager information for UTI Multi Asset Fund
Name Since Tenure Sharwan Kumar Goyal 12 Nov 21 3.3 Yr. Jaydeep Bhowal 1 Oct 24 0.41 Yr. Data below for UTI Multi Asset Fund as on 31 Mar 25
Asset Allocation
Asset Class Value Cash 9.27% Equity 59.76% Debt 19.3% Other 11.67% Equity Sector Allocation
Sector Value Consumer Cyclical 12.26% Technology 11.08% Financial Services 8.79% Consumer Defensive 8.36% Health Care 5.52% Industrials 5.21% Basic Materials 4.4% Energy 4.11% Communication Services 4.03% Real Estate 0.8% Utility 0.56% Debt Sector Allocation
Sector Value Government 14.26% Cash Equivalent 9.27% Corporate 5.04% Credit Quality
Rating Value AAA 100% Top Securities Holdings / Portfolio
Name Holding Value Quantity UTI Gold ETF
- | -12% ₹587 Cr 81,477,316
↑ 103,293 7.1% Govt Stock 2034
Sovereign Bonds | -5% ₹255 Cr 2,500,000,000
↑ 500,000,000 ICICI Bank Ltd (Financial Services)
Equity, Since 29 Feb 24 | ICICIBANK4% ₹223 Cr 1,851,484
↑ 148,635 Reliance Industries Ltd (Energy)
Equity, Since 31 Jan 24 | RELIANCE3% ₹173 Cr 1,440,963
↑ 68,887 Infosys Ltd (Technology)
Equity, Since 31 Mar 24 | INFY3% ₹160 Cr 950,659
↑ 57,942 7.32% Govt Stock 2030
Sovereign Bonds | -3% ₹154 Cr 1,500,000,000 Bharti Airtel Ltd (Communication Services)
Equity, Since 30 Apr 24 | BHARTIARTL3% ₹150 Cr 956,567
↑ 2,545 Tata Consultancy Services Ltd (Technology)
Equity, Since 29 Feb 24 | TCS3% ₹133 Cr 382,441
↑ 23,413 ITC Ltd (Consumer Defensive)
Equity, Since 31 Oct 22 | ITC2% ₹121 Cr 3,073,184
↑ 229,055 Mahindra & Mahindra Ltd (Consumer Cyclical)
Equity, Since 31 Oct 22 | M&M2% ₹116 Cr 447,224
↑ 54,913 5. ICICI Prudential Multi-Asset Fund
CAGR/Annualized return of 21.1% since its launch. Ranked 53 in Multi Asset category. Return for 2024 was 16.1% , 2023 was 24.1% and 2022 was 16.8% . ICICI Prudential Multi-Asset Fund
Growth Launch Date 31 Oct 02 NAV (23 Apr 25) ₹737.218 ↑ 2.62 (0.36 %) Net Assets (Cr) ₹55,360 on 31 Mar 25 Category Hybrid - Multi Asset AMC ICICI Prudential Asset Management Company Limited Rating ☆☆ Risk Moderately High Expense Ratio 1.83 Sharpe Ratio 0.75 Information Ratio 0 Alpha Ratio 0 Min Investment 5,000 Min SIP Investment 100 Exit Load 0-1 Years (1%),1 Years and above(NIL) Growth of 10,000 investment over the years.
Date Value 31 Mar 20 ₹10,000 31 Mar 21 ₹15,693 31 Mar 22 ₹20,573 31 Mar 23 ₹22,710 31 Mar 24 ₹30,107 31 Mar 25 ₹34,112 Returns for ICICI Prudential Multi-Asset Fund
absolute basis & more than 1 year are on CAGR (Compound Annual Growth Rate) basis. as on 24 Apr 25 Duration Returns 1 Month 3.1% 3 Month 5.5% 6 Month 3.8% 1 Year 13.5% 3 Year 18.4% 5 Year 26.1% 10 Year 15 Year Since launch 21.1% Historical performance (Yearly) on absolute basis
Year Returns 2023 16.1% 2022 24.1% 2021 16.8% 2020 34.7% 2019 9.9% 2018 7.7% 2017 -2.2% 2016 28.2% 2015 12.5% 2014 -1.4% Fund Manager information for ICICI Prudential Multi-Asset Fund
Name Since Tenure Sankaran Naren 1 Feb 12 13.09 Yr. Manish Banthia 22 Jan 24 1.11 Yr. Ihab Dalwai 3 Jun 17 7.75 Yr. Akhil Kakkar 22 Jan 24 1.11 Yr. Sri Sharma 30 Apr 21 3.84 Yr. Gaurav Chikane 2 Aug 21 3.58 Yr. Sharmila D’mello 31 Jul 22 2.59 Yr. Masoomi Jhurmarvala 4 Nov 24 0.32 Yr. Data below for ICICI Prudential Multi-Asset Fund as on 31 Mar 25
Asset Allocation
Asset Class Value Cash 32.53% Equity 51.72% Debt 9.25% Other 6.28% Equity Sector Allocation
Sector Value Financial Services 20.94% Consumer Cyclical 8.88% Basic Materials 6.84% Energy 5.68% Industrials 5.27% Technology 4.67% Consumer Defensive 4.63% Health Care 4.33% Utility 2.72% Communication Services 2.34% Real Estate 0.68% Debt Sector Allocation
Sector Value Cash Equivalent 31.31% Corporate 7.25% Government 2.95% Securitized 0.5% Credit Quality
Rating Value A 3.36% AA 23.82% AAA 69.16% Top Securities Holdings / Portfolio
Name Holding Value Quantity ICICI Bank Ltd (Financial Services)
Equity, Since 31 May 06 | ICICIBANK4% ₹2,246 Cr 18,656,800 Maruti Suzuki India Ltd (Consumer Cyclical)
Equity, Since 31 Aug 21 | MARUTI4% ₹2,129 Cr 1,781,799 HDFC Bank Ltd (Financial Services)
Equity, Since 31 Jan 22 | HDFCBANK4% ₹1,838 Cr 10,607,299
↑ 200,000 ICICI Prudential Silver ETF
- | -3% ₹1,693 Cr 179,691,983 ICICI Pru Gold ETF
- | -3% ₹1,652 Cr 224,590,882 Reliance Industries Ltd (Energy)
Equity, Since 31 Dec 20 | RELIANCE3% ₹1,609 Cr 13,410,486
↑ 702,236 SBI Cards and Payment Services Ltd Ordinary Shares (Financial Services)
Equity, Since 30 Nov 22 | SBICARD3% ₹1,421 Cr 16,942,626
↓ -300,000 Larsen & Toubro Ltd (Industrials)
Equity, Since 30 Nov 19 | LT2% ₹1,241 Cr 3,921,259
↑ 998,500 NTPC Ltd (Utilities)
Equity, Since 31 Mar 17 | 5325552% ₹1,202 Cr 38,604,423
↓ -308,740 Nifty 50 Index
Derivatives | -2% -₹975 Cr 437,775
↑ 437,775 6. UTI Hybrid Equity Fund
CAGR/Annualized return of 15.1% since its launch. Ranked 12 in Hybrid Equity category. Return for 2024 was 19.7% , 2023 was 25.5% and 2022 was 5.6% . UTI Hybrid Equity Fund
Growth Launch Date 2 Jan 95 NAV (24 Apr 25) ₹393.676 ↓ -0.35 (-0.09 %) Net Assets (Cr) ₹5,910 on 31 Mar 25 Category Hybrid - Hybrid Equity AMC UTI Asset Management Company Ltd Rating ☆☆☆ Risk Moderately High Expense Ratio 1.91 Sharpe Ratio 0.35 Information Ratio 1.63 Alpha Ratio 3.16 Min Investment 1,000 Min SIP Investment 500 Exit Load 0-12 Months (1%),12 Months and above(NIL) Growth of 10,000 investment over the years.
Date Value 31 Mar 20 ₹10,000 31 Mar 21 ₹16,141 31 Mar 22 ₹19,352 31 Mar 23 ₹20,172 31 Mar 24 ₹26,919 31 Mar 25 ₹29,806 Returns for UTI Hybrid Equity Fund
absolute basis & more than 1 year are on CAGR (Compound Annual Growth Rate) basis. as on 24 Apr 25 Duration Returns 1 Month 2.7% 3 Month 3.1% 6 Month -0.6% 1 Year 12.6% 3 Year 17.1% 5 Year 23.6% 10 Year 15 Year Since launch 15.1% Historical performance (Yearly) on absolute basis
Year Returns 2023 19.7% 2022 25.5% 2021 5.6% 2020 30.5% 2019 13.2% 2018 2.5% 2017 -5.6% 2016 25.7% 2015 8.8% 2014 2.4% Fund Manager information for UTI Hybrid Equity Fund
Name Since Tenure V Srivatsa 24 Sep 09 15.44 Yr. Sunil Patil 5 Feb 18 7.07 Yr. Data below for UTI Hybrid Equity Fund as on 31 Mar 25
Asset Allocation
Asset Class Value Cash 3.45% Equity 67.42% Debt 29.14% Equity Sector Allocation
Sector Value Financial Services 22.79% Consumer Cyclical 8.28% Technology 6.73% Basic Materials 6.04% Consumer Defensive 4.69% Communication Services 4.5% Industrials 4.42% Health Care 4.02% Energy 3.43% Utility 1.57% Real Estate 0.94% Debt Sector Allocation
Sector Value Government 22.58% Corporate 6.56% Cash Equivalent 3.45% Credit Quality
Rating Value AA 1.11% AAA 98.89% Top Securities Holdings / Portfolio
Name Holding Value Quantity HDFC Bank Ltd (Financial Services)
Equity, Since 29 Feb 20 | HDFCBANK7% ₹403 Cr 2,328,702 ICICI Bank Ltd (Financial Services)
Equity, Since 31 Mar 10 | ICICIBANK5% ₹291 Cr 2,418,644 7.18% Govt Stock 2037
Sovereign Bonds | -5% ₹268 Cr 2,625,000,000 7.23% Govt Stock 2039
Sovereign Bonds | -5% ₹267 Cr 2,600,000,000 Infosys Ltd (Technology)
Equity, Since 31 Mar 06 | INFY4% ₹198 Cr 1,174,984
↓ -50,658 ITC Ltd (Consumer Defensive)
Equity, Since 31 Aug 06 | ITC3% ₹168 Cr 4,242,150 7.41% Govt Stock 2036
Sovereign Bonds | -2% ₹130 Cr 1,250,000,000 6.92% Govt Stock 2039
Sovereign Bonds | -2% ₹125 Cr 1,250,000,000 7.32% Govt Stock 2030
Sovereign Bonds | -2% ₹124 Cr 1,200,000,000 6.79% Govt Stock 2034
Sovereign Bonds | -2% ₹116 Cr 1,150,000,000
↑ 750,000,000 7. Edelweiss Multi Asset Allocation Fund
CAGR/Annualized return of since its launch. Ranked 71 in Multi Asset category. Return for 2024 was 20.2% , 2023 was 25.4% and 2022 was 5.3% . Edelweiss Multi Asset Allocation Fund
Growth Launch Date 12 Aug 09 NAV (24 Apr 25) ₹61.21 ↓ -0.16 (-0.26 %) Net Assets (Cr) ₹2,487 on 31 Mar 25 Category Hybrid - Multi Asset AMC Edelweiss Asset Management Limited Rating ☆ Risk Moderately High Expense Ratio 2.18 Sharpe Ratio 0.3 Information Ratio 1.64 Alpha Ratio 2.87 Min Investment 5,000 Min SIP Investment 500 Exit Load NIL Growth of 10,000 investment over the years.
Date Value 31 Mar 20 ₹10,000 31 Mar 21 ₹15,030 31 Mar 22 ₹17,998 31 Mar 23 ₹18,861 31 Mar 24 ₹25,354 31 Mar 25 ₹27,984 Returns for Edelweiss Multi Asset Allocation Fund
absolute basis & more than 1 year are on CAGR (Compound Annual Growth Rate) basis. as on 24 Apr 25 Duration Returns 1 Month 2.3% 3 Month 3.8% 6 Month -0.1% 1 Year 11.7% 3 Year 16.7% 5 Year 22.3% 10 Year 15 Year Since launch Historical performance (Yearly) on absolute basis
Year Returns 2023 20.2% 2022 25.4% 2021 5.3% 2020 27.1% 2019 12.7% 2018 10.4% 2017 -0.1% 2016 26.1% 2015 0.2% 2014 2.2% Fund Manager information for Edelweiss Multi Asset Allocation Fund
Name Since Tenure Bhavesh Jain 14 Oct 15 9.39 Yr. Bharat Lahoti 1 Oct 21 3.42 Yr. Rahul Dedhia 1 Jul 24 0.67 Yr. Pranavi Kulkarni 1 Aug 24 0.58 Yr. Data below for Edelweiss Multi Asset Allocation Fund as on 31 Mar 25
Asset Allocation
Asset Class Value Cash 11.4% Equity 72.92% Debt 15.68% Equity Sector Allocation
Sector Value Financial Services 23.16% Health Care 10.35% Technology 8.42% Consumer Cyclical 7.48% Industrials 6.21% Energy 3.61% Utility 3.51% Consumer Defensive 3.04% Basic Materials 2.94% Communication Services 2.91% Real Estate 0.7% Debt Sector Allocation
Sector Value Corporate 13.46% Government 8.73% Cash Equivalent 4.87% Securitized 0.01% Credit Quality
Rating Value AAA 100% Top Securities Holdings / Portfolio
Name Holding Value Quantity ICICI Bank Ltd (Financial Services)
Equity, Since 31 Mar 15 | ICICIBANK6% ₹141 Cr 1,167,577 HDFC Bank Ltd (Financial Services)
Equity, Since 31 Oct 15 | HDFCBANK5% ₹111 Cr 641,975
↑ 56,593 National Bank For Agriculture And Rural Development
Debentures | -4% ₹90 Cr 9,000,000 Hdb Financial Services Ltd.
Debentures | -3% ₹74 Cr 7,500,000 6.54% Govt Stock 2032
Sovereign Bonds | -3% ₹74 Cr 7,500,000 Bharti Airtel Ltd (Communication Services)
Equity, Since 31 Oct 19 | BHARTIARTL3% ₹67 Cr 423,781
↑ 29,775 Infosys Ltd (Technology)
Equity, Since 31 May 15 | INFY3% ₹58 Cr 340,862
↑ 114,430 Sun Pharmaceuticals Industries Ltd (Healthcare)
Equity, Since 31 Oct 19 | SUNPHARMA2% ₹55 Cr 343,006
↑ 20,348 NTPC Ltd (Utilities)
Equity, Since 30 Nov 21 | 5325552% ₹53 Cr 1,714,490 Tata Consultancy Services Ltd (Technology)
Equity, Since 31 May 15 | TCS2% ₹45 Cr 129,421
↑ 52,575
SIP Vs RD: કયું સારું છે RD અથવા SIP?
રિકરિંગ ડિપોઝિટ અને SIP વચ્ચેનો તફાવત
અહીં વપરાતા પરિબળો છે વળતરનો દર,પ્રવાહિતા, કરવેરા, અસ્થિરતા, જોખમ પરિબળો, વગેરે.
| પરિબળો | રિકરિંગ ડિપોઝિટ (RD) | સિસ્ટમેટિક ઇન્વેસ્ટમેન્ટ પ્લાન (SIP) |
|---|---|---|
| વળતરનો દર | SIP વળતર બજાર સાથે જોડાયેલું છે અને તે ફંડના પ્રકાર અને ફંડની કામગીરીના આધારે બદલાઈ શકે છે. જો કે, લાંબા સમય સુધી રોકાણ કરવામાં આવે ત્યારે SIPનું વળતર સામાન્ય રીતે સારું હોય છે. | RD નો વળતર દર તેના કારણે નિશ્ચિત છેસ્થિર વ્યાજ દર. તેથી, આ રોકાણ પર બજારની અસ્થિરતાની કોઈ અસર નથી. |
| રોકાણ યોજના | આરડી સ્કીમમાં, તમારે ડિપોઝિટ પ્લાનમાં રોકાણ કરવું પડશે જે તમને વળતરનો નિશ્ચિત દર આપશે. જો તમે વધુ લવચીકતા શોધી રહ્યા હોવ તો તમે ફ્લેક્સિબલ રિકરિંગ ડિપોઝિટ સ્કીમ પણ પસંદ કરી શકો છો. | મ્યુચ્યુઅલ ફંડ્સ માટે SIP માં, તમે તમારી જોખમ ક્ષમતાના આધારે ડેટ અથવા ઇક્વિટી પ્રકારના ફંડમાંથી એક પસંદ કરી શકો છો. |
| રોકાણનો પ્રકાર | રિકરિંગ ડિપોઝિટ સ્કીમમાં, રોકાણકારે દર મહિને એક નિશ્ચિત રકમ જમા કરાવવી પડે છે. | સિસ્ટમેટિક ઇન્વેસ્ટમેન્ટ પ્લાન એ તમારા પૈસા મ્યુચ્યુઅલ ફંડમાં મૂકવાનો એક માર્ગ છે. સમયાંતરે રોકાણ કરી શકાય છેઆધાર - દૈનિક, સાપ્તાહિક, માસિક અથવા ત્રિમાસિક. |
| તરલતા | પ્રતિSIP રદ કરો, રોકાણકારો ફક્ત તેમના રોકાણને બંધ કરી શકે છે અને કોઈપણ દંડ વિના તેમના નાણાં ઉપાડી શકે છે. | RDના કિસ્સામાં, રોકાણના સમય પહેલા ઉપાડ અથવા બંધ થવાથી પેનલ્ટી ચાર્જ લાગશે. |
| કરવેરા | રિકરિંગ ડિપોઝિટની રકમ અથવા તેના પર મેળવેલ વ્યાજને કરમાંથી મુક્તિ આપવામાં આવતી નથી. | જ્યારે ઇક્વિટી લિંક્ડ સેવિંગ્સ સ્કીમ (ELSS) ભંડોળ. |
| અસ્થિરતા | માર્કેટ-લિંક્ડ હોવાથી, SIP રિટર્ન અસ્થિર હોય છે અને ફંડથી અલગ અલગ હોઈ શકે છે. | આરડી વળતર નિશ્ચિત છે અને તેથી તે અસ્થિર રોકાણ નથી. |
| જોખમનું પરિબળ | RD રોકાણમાં જોખમ પરિબળ લગભગ શૂન્ય છે કારણ કે વળતર નિશ્ચિત છે. તે સૌથી સુરક્ષિત રોકાણોમાંનું એક છે. | એસઆઈપીમાં જોખમ આરડી કરતા વધારે છે, કારણ કે એસઆઈપી વળતર સ્ટોક માર્કેટ પર આધારિત છે અનેએસેટ ફાળવણી. |
| રોકાણ ધ્યેય | રિકરિંગ ડિપોઝિટ સામાન્ય રીતે ટૂંકા ગાળાના બચત ધ્યેય પૂરા કરે છે અને લાંબા ગાળાની સંપત્તિ વૃદ્ધિમાં મદદ કરતી નથી. | રોકાણની આવર્તન, પસંદ કરેલ ભંડોળ અને અન્ય પરિબળોને આધારે SIP તમામ પ્રકારના રોકાણના ધ્યેયોમાં મદદ કરી શકે છે, પછી ભલે તે ટૂંકા હોય કે લાંબા ગાળાના. |
| હપતાની આવર્તન | રિકરિંગ ડિપોઝિટ સામાન્ય રીતે માસિક હપ્તાઓ સાથે આવે છે | SIP દૈનિક, સાપ્તાહિક, માસિક, ત્રિમાસિક વગેરેની લવચીક હપ્તા યોજનાઓ ઓફર કરે છે. |
મૂલ્યાંકન: SIP Vs RD નું વળતર
રોકાણનો સારો વિકલ્પ કયો છે- SIP વિ આરડી? આ પ્રશ્નનો જવાબ વ્યક્તિ-વ્યક્તિની વ્યક્તિગત જરૂરિયાતોને આધારે બદલાઈ શકે છે. જેમ તમે જાણો છો, SIP વળતર ચલ હોય છે જ્યારે RD વળતર નિશ્ચિત હોય છે, ચાલો જોઈએ કે જો કોઈ INR 1 નું રોકાણ કરે તો રોકાણ કેટલું વધે છે,000 RD અને SIP બંનેમાં 1 વર્ષ (12 મહિના) માટે.
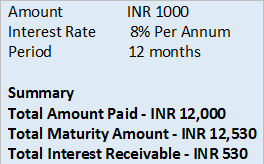
આરડી રીટર્ન કેલ્ક્યુલેટર
RD વ્યાજ દર દરેક સમયે બદલાઈ શકે છેબેંક, પરંતુ સામાન્ય રીતે, વ્યાજ દર 7% થી 9% p.a. વ્યાજ દર 8% હોવાનું ધારીને, ચાલો 12 મહિના માટે માસિક INR 1,000 ના RD રોકાણમાં વૃદ્ધિનું વિશ્લેષણ કરીએ.
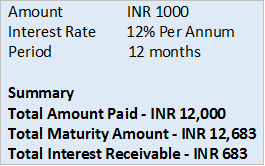
SIP રીટર્ન કેલ્ક્યુલેટર
SIP વ્યાજ દર 12% હોવાનું ધારીને, ચાલો મોનિટર કરીએ કે જો તમે 1 વર્ષ માટે માસિક 1000 રૂપિયાનું રોકાણ કરો તો તમારી SIP કેવી રીતે વધે છે.સંયોજન શક્તિ.
નિષ્કર્ષમાં, અહીં રોકાણકારો માટે કેટલીક અંતિમ ટીપ્સ છે.
- જો તમે જોખમ-વિરોધી રોકાણકાર છો, તો RD અથવા રિકરિંગ ડિપોઝિટ વધુ સારો વિકલ્પ છે. RD વ્યાજ દર અને વળતર અગાઉથી જ મર્યાદિત હોય છે અને તે સામાન્ય રીતે બહુ ઊંચા હોતા નથી, 7-9% p.a થી બદલાઈ શકે છે.
- જો તમે થોડું જોખમ લેવા ઈચ્છો છો, તો લાંબા ગાળાના રોકાણ માટે SIP એ શ્રેષ્ઠ રોકાણ વિકલ્પોમાંથી એક છે. વિશ્લેષણ મુજબ, SIP સારું વળતર આપે છે અને વ્યાજ દરો સામાન્ય રીતે ઊંચા હોય છે, જે 15% p.a.થી વધુ હોય છે. કેટલાક કિસ્સાઓમાં.
- 5 વર્ષ માટે રોકાણ કરતી વખતે, RD એ રોકાણકારો માટે એક સુરક્ષિત વિકલ્પ છે જેઓ નિશ્ચિત વળતરની શોધમાં છે.
- જો કે, જ્યારે કોઈ ચોક્કસ માટે લાંબા ગાળા માટે (5 વર્ષથી વધુ) રોકાણ કરોનાણાકીય ધ્યેય, SIP સારું વળતર આપે છે અને નાણાંની વૃદ્ધિ ઘણી વધારે છે.
"SIP દ્વારા ઇક્વિટીમાં રોકાણ કરવું એ એક વૃક્ષ વાવવા જેવું છે, ફળ મેળવવા માટે વ્યક્તિએ ધીરજ રાખવી પડશે."
અહીં આપેલી માહિતી સચોટ છે તેની ખાતરી કરવા માટેના તમામ પ્રયાસો કરવામાં આવ્યા છે. જો કે, ડેટાની શુદ્ધતા અંગે કોઈ ગેરંટી આપવામાં આવતી નથી. કોઈપણ રોકાણ કરતા પહેલા કૃપા કરીને સ્કીમ માહિતી દસ્તાવેજ સાથે ચકાસો.
You Might Also Like


AMFI Registration No. 112358 | CIN: U74999MH2016PTC282153
Shepard Technologies Pvt. Ltd. (with ARN code 112358) makes no warranties or representations, express or implied, on products offered through the platform. It accepts no liability for any damages or losses, however caused, in connection with the use of, or on the reliance of its product or related services. Terms and conditions of the website are applicable.
©2025 Shepard Technologies Private Limited. All Rights Reserved