Table of Contents
8 മികച്ച ബാലൻസ്ഡ് അഡ്വാന്റേജ് മ്യൂച്വൽ ഫണ്ടുകൾ 2022
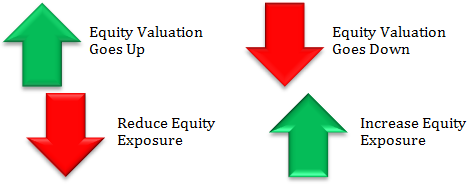
സമതുലിതമായ അഡ്വാന്റേജ് ഫണ്ടുകൾ അതിന്റെ നേരിട്ടുള്ള ഇക്വിറ്റി എക്സ്പോഷർ മൊത്തത്തിലുള്ളതാണോ എന്നതിനെ അടിസ്ഥാനമാക്കി ക്രമീകരിക്കുന്നുവിപണി മൂല്യനിർണ്ണയങ്ങൾ ചെലവേറിയതോ വിലകുറഞ്ഞതോ ആണ് (ഓൺഅടിസ്ഥാനം വിലയിൽ നിന്ന്-പുസ്തക മൂല്യം). അതിനാൽ, മാർക്കറ്റിന്റെ വില-ബുക്ക് മൂല്യ അനുപാതം കുറവാണെങ്കിൽ (ചരിത്രപരമായ മൂല്യങ്ങളെ അടിസ്ഥാനമാക്കി), ഫണ്ട് അതിന്റെ നേരിട്ടുള്ള സ്റ്റോക്ക് എക്സ്പോഷർ ഉയർത്തുകയും മദ്ധ്യസ്ഥതയിൽ കുറവ് ആശ്രയിക്കുകയും ചെയ്യുന്നു.

ടോപ്പ് ബാലൻസ്ഡ് അഡ്വാൻസ് ഫണ്ടുകൾമ്യൂച്വൽ ഫണ്ടുകൾ അത് അവരുടെ ആസ്തിയുടെ 65% ത്തിലധികം നിക്ഷേപിക്കുന്നുഓഹരികൾ മൊത്തത്തിൽ നല്ല വരുമാനം ലഭിക്കുന്നതിന് ഡെറ്റ് ഉപകരണങ്ങളിൽ ശേഷിക്കുന്ന ആസ്തികളും. ചില സ്ഥിരമായ റിട്ടേണുകൾക്കായി നോക്കുമ്പോൾ മാർക്കറ്റ് റിസ്ക് എടുക്കാൻ തയ്യാറുള്ള നിക്ഷേപകർക്ക് ബാലൻസ്ഡ് മ്യൂച്വൽ ഫണ്ടുകൾ പ്രയോജനകരമാണ്. ഇക്വിറ്റികളിലും സ്റ്റോക്കുകളിലും നിക്ഷേപിച്ച ആസ്തികൾ മാർക്കറ്റ്-ലിങ്ക്ഡ് റിട്ടേൺ വാഗ്ദാനം ചെയ്യുമ്പോൾ ഡെറ്റ് ഉപകരണങ്ങളിൽ നിക്ഷേപിച്ച ആസ്തികൾ സ്ഥിരമായ റിട്ടേൺ വാഗ്ദാനം ചെയ്യുന്നു. ഇക്വിറ്റി, ഡെറ്റ് എന്നിവയുടെ സംയോജനമായതിനാൽ, നിക്ഷേപകർ വളരെ ശ്രദ്ധാലുവായിരിക്കണംനിക്ഷേപിക്കുന്നു ഈ ഫണ്ടുകളിൽ. നിക്ഷേപകർക്ക് മുകളിൽ നോക്കാൻ നിർദ്ദേശിക്കുന്നുബാലൻസ്ഡ് ഫണ്ട് ബാലൻസ്ഡ് മ്യൂച്വൽ ഫണ്ടുകളിൽ നിക്ഷേപിക്കുന്നതിന് മുമ്പ്. മികച്ച ബാലൻസ്ഡ് മ്യൂച്വൽ ഫണ്ടുകൾ ഞങ്ങൾ താഴെ ലിസ്റ്റ് ചെയ്തിട്ടുണ്ട്.
എന്താണ് ബാലൻസ്ഡ് അഡ്വാന്റേജ് മ്യൂച്വൽ ഫണ്ടുകൾ?
അടുത്തിടെസെബി 2018 ഏപ്രിലിലെ മാനദണ്ഡങ്ങൾ പുതിയ വിഭാഗങ്ങൾ സൃഷ്ടിച്ചു, അതിലൊന്നിനെ ഡൈനാമിക് എന്ന് വിളിക്കുന്നുഅസറ്റ് അലോക്കേഷൻ അല്ലെങ്കിൽ ബാലൻസ്ഡ് അഡ്വാൻസ് ഫണ്ട് (BAF). ഈ വിഭാഗത്തിലെ ഫണ്ടുകൾക്ക് "ചലനാത്മകമായി കൈകാര്യം ചെയ്യപ്പെടുന്ന ഇക്വിറ്റി/കടത്തിൽ നിക്ഷേപം" ഉണ്ടായിരിക്കണമെന്ന് മാനദണ്ഡം പറയുന്നു. ഇത് "ഡൈനാമിക്" ആയതിനാൽ, നിർവചനം പ്രകാരംഎഎംസികൾ ഈ ഫണ്ടുകൾ കൈകാര്യം ചെയ്യുന്നതിൽ വഴക്കമുണ്ട്. ആശയക്കുഴപ്പത്തിന് കാരണം, ഈ വിഭാഗത്തിലെ ഫണ്ടുകളെ "സന്തുലിതമായ നേട്ടം" എന്ന് വിളിക്കുന്നതിനാൽ, അത്ര വിദഗ്ദ്ധരല്ലാത്ത നിക്ഷേപകർ ഇവയെ മുൻ ദിവസങ്ങളിലെ ബാലൻസ്ഡ് ഫണ്ടുകളുമായി തുലനം ചെയ്യുന്നു എന്നതാണ്.
മുൻകാല ബാലൻസ്ഡ് ഫണ്ടുകൾ ഇപ്പോൾ അഗ്രസീവ് ഹൈബ്രിഡ് ഫണ്ടുകളാണെന്നും സന്തുലിത ആനുകൂല്യ ഫണ്ടുകൾ ഹൈബേർഡിന് കീഴിലുള്ള മറ്റൊരു ഉപവിഭാഗത്തിൽ പെട്ടതാണെന്നും ശ്രദ്ധിക്കാവുന്നതാണ്.
എന്തുകൊണ്ട് ബാലൻസ്ഡ് അഡ്വാന്റേജ് മ്യൂച്വൽ ഫണ്ടുകൾ?
മാർക്കറ്റ് വാല്യൂവേഷനുകളുടെ വായന അനുസരിച്ച് നെറ്റ് ഇക്വിറ്റി എക്സ്പോഷറിലെ ഫണ്ട് മാനേജരുടെ കോളുകൾക്കൊപ്പം പോകുന്നതിന് ഡൈനാമിക് അസറ്റ് അലോക്കേഷൻ ഫണ്ടുകളിലോ BAF-കളിലോ ഒരാൾ പ്രവേശിക്കണം. ആശയക്കുഴപ്പം ഒഴിവാക്കാൻ, മുമ്പത്തെ ബാലൻസ്ഡ് ഫണ്ടുകളുമായി BAF തുല്യമാക്കരുത്. രണ്ട് വിഭാഗങ്ങൾക്കും അവരുടേതായ മെറിറ്റുകൾ ഉണ്ട്, രണ്ടും ഇക്വിറ്റി സംബന്ധിയായ നികുതിക്ക് യോഗ്യമാണ്, എന്നാൽ വ്യത്യാസം, ആക്രമണാത്മക ഹൈബ്രിഡ് ഫണ്ടുകൾക്ക് പരമ്പരാഗത ഇക്വിറ്റി എക്സ്പോഷർ ഉണ്ട്, അതേസമയം BAF കൾക്ക് ഇക്വിറ്റിയിൽ കുറഞ്ഞ നെറ്റ് എക്സ്പോഷർ ഉണ്ടായിരിക്കുകയും അപകടസാധ്യതയുമായി ബന്ധപ്പെട്ട് കൂടുതൽ സ്ഥിരമായ വരുമാനം നൽകുകയും ചെയ്തേക്കാം അവർ എടുക്കുന്നു.
Talk to our investment specialist
ഇന്ത്യയിലെ നിക്ഷേപങ്ങൾക്കായുള്ള 8 മികച്ച ബാലൻസ്ഡ് അഡ്വാന്റേജ് മ്യൂച്വൽ ഫണ്ടുകൾ 2022 - 2023
(Erstwhile HDFC Growth Fund and HDFC Prudence Fund) Aims to generate long term capital appreciation from a portfolio that is invested predominantly in equity and equity related instruments. HDFC Balanced Advantage Fund is a Hybrid - Dynamic Allocation fund was launched on 11 Sep 00. It is a fund with Moderately High risk and has given a Below is the key information for HDFC Balanced Advantage Fund Returns up to 1 year are on The primary objective of the Scheme is to generate long term growth of capital and income distribution with relatively lower volatility by investing in a dynamically balanced portfolio of Equity & Equity linked investments and fixed-income securities. Aditya Birla Sun Life Balanced Advantage Fund is a Hybrid - Dynamic Allocation fund was launched on 25 Apr 00. It is a fund with Moderately High risk and has given a Below is the key information for Aditya Birla Sun Life Balanced Advantage Fund Returns up to 1 year are on The fund objective is to seek low volatility returns by using arbitrage and other derivative strategies in equity markets and investments in short-term debt portfolio.The fund invests in equity with usage of derivatives. ICICI Prudential Balanced Advantage Fund is a Hybrid - Dynamic Allocation fund was launched on 30 Dec 06. It is a fund with Moderately High risk and has given a Below is the key information for ICICI Prudential Balanced Advantage Fund Returns up to 1 year are on (Erstwhile Reliance NRI Equity Fund) The investment objective of the Scheme is to generate optimal returns by investing in equity or equity related instruments primarily drawn from the Companies in the S&P BSE 200 Index. The Scheme may also invest in listed
companies that are in the top 200 by market capitalization on the BSE. The Scheme may also invest in large IPO’s where the market capitalization of the Company making the IPO based on the Issue price would make such company to be a part of the top 200 companies listed on the BSE based on market capitalization. The fund will have the flexibility to invest in a broad range of companies with an objective to maximize the returns, at the same time trying to minimize the risk by reasonable diversification. The selection of the companies will be done so as to capture the growth in the Indian economy. The fund will be focusing on companies with relatively higher market capitalization and having good liquidity in the stock market. Nippon India Balanced Advantage Fund is a Hybrid - Dynamic Allocation fund was launched on 15 Nov 04. It is a fund with Moderately High risk and has given a Below is the key information for Nippon India Balanced Advantage Fund Returns up to 1 year are on The primary objective of the scheme is to seek to generate long term capital appreciation with relatively lower volatility through systematic allocation of funds into equity; and in debt /money market instruments for defensive purposes. The Scheme will decide on allocation of funds into equity assets based on equity market Price Earning Ratio (PE Ratio) levels. When the markets become expensive in terms of ‘Price to Earnings’ Ratio; the Scheme will reduce its allocation to equities and move assets into debt and/or money market instruments and vice versa. Principal Balanced Advantage Fund is a Hybrid - Dynamic Allocation fund was launched on 16 Dec 10. It is a fund with Moderately High risk and has given a Below is the key information for Principal Balanced Advantage Fund Returns up to 1 year are on To seek to generate long-term capital appreciation from a diversified portfolio of equity and equity related securities and to generate reasonable returns by investing in a portfolio of debt and money market instruments and arbitrage opportunities in the cash and derivatives segments of the equity markets. L&T Dynamic Equity Fund is a Hybrid - Dynamic Allocation fund was launched on 7 Feb 11. It is a fund with Moderately High risk and has given a Below is the key information for L&T Dynamic Equity Fund Returns up to 1 year are on The investment objective of the Scheme is to generate long-term capital growth from a focused portfolio of predominantly equity and equity-related securities. Invesco India Dynamic Equity Fund is a Hybrid - Dynamic Allocation fund was launched on 4 Oct 07. It is a fund with Moderately High risk and has given a Below is the key information for Invesco India Dynamic Equity Fund Returns up to 1 year are on (Erstwhile Edelweiss Dynamic Equity Advantage Fund) The primary objective of the scheme will be to generate absolute returns with low volatility over a longer tenure of time. The scheme will invest in arbitrage opportunities, equity derivative strategies, pure equity investments and the balance in debt and money market instruments. The Scheme proposes to allocate assets to both equity and debt markets based upon the market view. However there is no assurance that the investment objective of the scheme will be realized. Edelweiss Balanced Advantage Fund is a Hybrid - Dynamic Allocation fund was launched on 20 Aug 09. It is a fund with Moderately High risk and has given a Below is the key information for Edelweiss Balanced Advantage Fund Returns up to 1 year are on Fund NAV Net Assets (Cr) 3 MO (%) 6 MO (%) 1 YR (%) 3 YR (%) 5 YR (%) 2023 (%) HDFC Balanced Advantage Fund Growth ₹496.229
↑ 4.38 ₹90,375 1.2 -2.4 8.8 19 25 16.7 Aditya Birla Sun Life Balanced Advantage Fund Growth ₹101.42
↑ 1.13 ₹7,321 2.1 -1.1 11 11.7 15.6 13 ICICI Prudential Balanced Advantage Fund Growth ₹70.71
↑ 0.60 ₹60,591 2.7 0.3 10.2 12.3 16.6 12.3 Nippon India Balanced Advantage Fund Growth ₹170.533
↑ 1.36 ₹8,808 1.9 -0.6 9.2 11.9 15.6 13 Principal Balanced Advantage Fund Growth ₹33.9408
↑ 0.32 ₹1,491 1.6 -2.4 8.5 10.3 11.5 12.6 L&T Dynamic Equity Fund Growth ₹41.9
↑ 0.20 ₹1,471 0.3 -1.7 8 10.7 12.1 15.4 Invesco India Dynamic Equity Fund Growth ₹51.18
↑ 0.51 ₹943 -1.1 -3.5 7 11.7 14.5 15.9 Edelweiss Balanced Advantage Fund Growth ₹48.53
↑ 0.43 ₹12,240 0.1 -3.9 6.3 10.6 15.6 13.1 Note: Returns up to 1 year are on absolute basis & more than 1 year are on CAGR basis. as on 17 Apr 25 1. HDFC Balanced Advantage Fund
CAGR/Annualized return of 18.2% since its launch. Ranked 23 in Dynamic Allocation category. Return for 2024 was 16.7% , 2023 was 31.3% and 2022 was 18.8% . HDFC Balanced Advantage Fund
Growth Launch Date 11 Sep 00 NAV (17 Apr 25) ₹496.229 ↑ 4.38 (0.89 %) Net Assets (Cr) ₹90,375 on 28 Feb 25 Category Hybrid - Dynamic Allocation AMC HDFC Asset Management Company Limited Rating ☆☆☆☆ Risk Moderately High Expense Ratio 1.43 Sharpe Ratio -0.27 Information Ratio 0 Alpha Ratio 0 Min Investment 5,000 Min SIP Investment 300 Exit Load 0-1 Years (1%),1 Years and above(NIL) Growth of 10,000 investment over the years.
Date Value 31 Mar 20 ₹10,000 31 Mar 21 ₹15,696 31 Mar 22 ₹18,998 31 Mar 23 ₹21,519 31 Mar 24 ₹30,051 31 Mar 25 ₹32,636 Returns for HDFC Balanced Advantage Fund
absolute basis & more than 1 year are on CAGR (Compound Annual Growth Rate) basis. as on 17 Apr 25 Duration Returns 1 Month 4.8% 3 Month 1.2% 6 Month -2.4% 1 Year 8.8% 3 Year 19% 5 Year 25% 10 Year 15 Year Since launch 18.2% Historical performance (Yearly) on absolute basis
Year Returns 2023 16.7% 2022 31.3% 2021 18.8% 2020 26.4% 2019 7.6% 2018 6.9% 2017 -3.1% 2016 27.9% 2015 9.4% 2014 0.3% Fund Manager information for HDFC Balanced Advantage Fund
Name Since Tenure Anil Bamboli 29 Jul 22 2.59 Yr. Gopal Agrawal 29 Jul 22 2.59 Yr. Arun Agarwal 6 Oct 22 2.4 Yr. Srinivasan Ramamurthy 29 Jul 22 2.59 Yr. Nirman Morakhia 15 Feb 23 2.04 Yr. Dhruv Muchhal 22 Jun 23 1.69 Yr. Data below for HDFC Balanced Advantage Fund as on 28 Feb 25
Asset Allocation
Asset Class Value Cash 8.45% Equity 60.71% Debt 30.84% Equity Sector Allocation
Sector Value Financial Services 21.86% Industrials 7.75% Energy 7.1% Technology 6.26% Consumer Cyclical 5.72% Utility 4.22% Health Care 4.2% Communication Services 2.69% Consumer Defensive 2.59% Basic Materials 2.04% Real Estate 1.57% Debt Sector Allocation
Sector Value Government 15.74% Corporate 14.63% Cash Equivalent 8.92% Credit Quality
Rating Value AA 0.91% AAA 99.09% Top Securities Holdings / Portfolio
Name Holding Value Quantity HDFC Bank Ltd (Financial Services)
Equity, Since 31 Mar 22 | HDFCBANK6% ₹5,160 Cr 29,787,551
↓ -4,127,200 ICICI Bank Ltd (Financial Services)
Equity, Since 31 Oct 09 | ICICIBANK4% ₹3,373 Cr 28,010,724
↓ -830,900 Infosys Ltd (Technology)
Equity, Since 31 Oct 09 | INFY3% ₹3,104 Cr 18,390,088
↑ 2,000,000 Reliance Industries Ltd (Energy)
Equity, Since 31 Dec 21 | RELIANCE3% ₹2,960 Cr 24,664,288
↓ -459,500 State Bank of India (Financial Services)
Equity, Since 31 May 07 | SBIN3% ₹2,718 Cr 39,455,000 7.18% Govt Stock 2033
Sovereign Bonds | -3% ₹2,342 Cr 228,533,300 NTPC Ltd (Utilities)
Equity, Since 31 Aug 16 | 5325552% ₹2,191 Cr 70,337,915 Larsen & Toubro Ltd (Industrials)
Equity, Since 30 Jun 12 | LT2% ₹2,103 Cr 6,645,683
↓ -168,950 Bharti Airtel Ltd (Communication Services)
Equity, Since 31 Aug 20 | BHARTIARTL2% ₹2,069 Cr 13,179,354
↑ 300,000 Coal India Ltd (Energy)
Equity, Since 31 Jan 18 | COALINDIA2% ₹2,063 Cr 55,854,731 2. Aditya Birla Sun Life Balanced Advantage Fund
CAGR/Annualized return of since its launch. Ranked 19 in Dynamic Allocation category. Return for 2024 was 13% , 2023 was 16.5% and 2022 was 4.2% . Aditya Birla Sun Life Balanced Advantage Fund
Growth Launch Date 25 Apr 00 NAV (17 Apr 25) ₹101.42 ↑ 1.13 (1.13 %) Net Assets (Cr) ₹7,321 on 31 Mar 25 Category Hybrid - Dynamic Allocation AMC Birla Sun Life Asset Management Co Ltd Rating ☆☆☆ Risk Moderately High Expense Ratio 1.77 Sharpe Ratio 0.36 Information Ratio 0 Alpha Ratio 0 Min Investment 1,000 Min SIP Investment 100 Exit Load 0-365 Days (1%),365 Days and above(NIL) Growth of 10,000 investment over the years.
Date Value 31 Mar 20 ₹10,000 31 Mar 21 ₹14,355 31 Mar 22 ₹15,854 31 Mar 23 ₹16,373 31 Mar 24 ₹19,928 31 Mar 25 ₹21,966 Returns for Aditya Birla Sun Life Balanced Advantage Fund
absolute basis & more than 1 year are on CAGR (Compound Annual Growth Rate) basis. as on 17 Apr 25 Duration Returns 1 Month 4.7% 3 Month 2.1% 6 Month -1.1% 1 Year 11% 3 Year 11.7% 5 Year 15.6% 10 Year 15 Year Since launch Historical performance (Yearly) on absolute basis
Year Returns 2023 13% 2022 16.5% 2021 4.2% 2020 13.4% 2019 15.4% 2018 8.1% 2017 0.7% 2016 15.2% 2015 16.3% 2014 3.6% Fund Manager information for Aditya Birla Sun Life Balanced Advantage Fund
Name Since Tenure Harish Krishnan 31 Oct 24 0.33 Yr. Lovelish Solanki 9 Oct 19 5.4 Yr. Mohit Sharma 1 Apr 17 7.92 Yr. Data below for Aditya Birla Sun Life Balanced Advantage Fund as on 31 Mar 25
Asset Allocation
Asset Class Value Cash 6.42% Equity 70.01% Debt 23.57% Equity Sector Allocation
Sector Value Financial Services 20.76% Industrials 8.39% Basic Materials 7.04% Consumer Cyclical 6.76% Technology 6.01% Energy 5.66% Consumer Defensive 5.18% Health Care 4.45% Utility 2.26% Real Estate 1.86% Communication Services 1.65% Debt Sector Allocation
Sector Value Corporate 14.41% Cash Equivalent 8.47% Government 6.31% Securitized 0.8% Credit Quality
Rating Value AA 16.29% AAA 83.71% Top Securities Holdings / Portfolio
Name Holding Value Quantity ICICI Bank Ltd (Financial Services)
Equity, Since 31 Oct 09 | ICICIBANK4% ₹286 Cr 2,376,565
↑ 120,665 HDFC Bank Ltd (Financial Services)
Equity, Since 31 Mar 17 | HDFCBANK4% ₹270 Cr 1,556,159
↑ 116,694 Reliance Industries Ltd (Energy)
Equity, Since 30 Sep 18 | RELIANCE4% ₹247 Cr 2,055,296
↓ -162,997 7.18% Govt Stock 2037
Sovereign Bonds | -3% ₹184 Cr 18,000,000 Infosys Ltd (Technology)
Equity, Since 31 Dec 07 | INFY3% ₹177 Cr 1,049,362 Kotak Mahindra Bank Ltd (Financial Services)
Equity, Since 30 Apr 18 | KOTAKBANK2% ₹150 Cr 785,801
↓ -211,745 Cholamandalam Investment And Fin. Co. Ltd
Debentures | -2% ₹143 Cr 12,660 Bajaj Finance Ltd (Financial Services)
Equity, Since 30 Sep 17 | 5000342% ₹124 Cr 145,709
↑ 19,863 7.26% Govt Stock 2033
Sovereign Bonds | -2% ₹123 Cr 12,000,000 Shriram Transport Finance Company Limited
Debentures | -2% ₹120 Cr 12,000 3. ICICI Prudential Balanced Advantage Fund
CAGR/Annualized return of 11.3% since its launch. Ranked 18 in Dynamic Allocation category. Return for 2024 was 12.3% , 2023 was 16.5% and 2022 was 7.9% . ICICI Prudential Balanced Advantage Fund
Growth Launch Date 30 Dec 06 NAV (17 Apr 25) ₹70.71 ↑ 0.60 (0.86 %) Net Assets (Cr) ₹60,591 on 31 Mar 25 Category Hybrid - Dynamic Allocation AMC ICICI Prudential Asset Management Company Limited Rating ☆☆☆ Risk Moderately High Expense Ratio 1.59 Sharpe Ratio 0.12 Information Ratio 0 Alpha Ratio 0 Min Investment 5,000 Min SIP Investment 100 Exit Load 0-18 Months (1%),18 Months and above(NIL) Growth of 10,000 investment over the years.
Date Value 31 Mar 20 ₹10,000 31 Mar 21 ₹14,472 31 Mar 22 ₹16,209 31 Mar 23 ₹17,180 31 Mar 24 ₹21,083 31 Mar 25 ₹22,689 Returns for ICICI Prudential Balanced Advantage Fund
absolute basis & more than 1 year are on CAGR (Compound Annual Growth Rate) basis. as on 17 Apr 25 Duration Returns 1 Month 4.4% 3 Month 2.7% 6 Month 0.3% 1 Year 10.2% 3 Year 12.3% 5 Year 16.6% 10 Year 15 Year Since launch 11.3% Historical performance (Yearly) on absolute basis
Year Returns 2023 12.3% 2022 16.5% 2021 7.9% 2020 15.1% 2019 11.7% 2018 10.8% 2017 2.4% 2016 19% 2015 7.3% 2014 6.7% Fund Manager information for ICICI Prudential Balanced Advantage Fund
Name Since Tenure Sankaran Naren 14 Jul 17 7.64 Yr. Rajat Chandak 7 Sep 15 9.49 Yr. Manish Banthia 18 Nov 09 15.29 Yr. Ihab Dalwai 29 Jan 18 7.09 Yr. Akhil Kakkar 22 Jan 24 1.11 Yr. Sri Sharma 30 Apr 21 3.84 Yr. Sharmila D’mello 31 Jul 22 2.59 Yr. Data below for ICICI Prudential Balanced Advantage Fund as on 31 Mar 25
Asset Allocation
Asset Class Value Cash 35.92% Equity 46.53% Debt 17.29% Equity Sector Allocation
Sector Value Financial Services 19.55% Consumer Cyclical 13.79% Technology 6.35% Industrials 5.43% Basic Materials 4.97% Consumer Defensive 4.85% Energy 3.73% Health Care 3.1% Communication Services 2.6% Utility 1.76% Real Estate 0.3% Debt Sector Allocation
Sector Value Cash Equivalent 34.94% Corporate 9.26% Government 6.09% Securitized 3.19% Credit Quality
Rating Value A 3.91% AA 27.23% AAA 65.04% Top Securities Holdings / Portfolio
Name Holding Value Quantity Nifty 50 Index
Derivatives | -8% -₹4,919 Cr 2,207,850
↑ 2,207,850 HDFC Bank Ltd (Financial Services)
Equity, Since 31 Mar 12 | HDFCBANK4% ₹2,575 Cr 14,866,473
↓ -63,000 TVS Motor Co Ltd (Consumer Cyclical)
Equity, Since 30 Sep 16 | 5323434% ₹2,504 Cr 11,250,400
↑ 100,000 ICICI Bank Ltd (Financial Services)
Equity, Since 31 May 12 | ICICIBANK4% ₹2,409 Cr 20,003,805 Maruti Suzuki India Ltd (Consumer Cyclical)
Equity, Since 30 Apr 16 | MARUTI4% ₹2,134 Cr 1,786,212
↑ 5,700 Infosys Ltd (Technology)
Equity, Since 31 Dec 08 | INFY3% ₹1,985 Cr 11,760,368
↑ 668,800 Reliance Industries Ltd (Energy)
Equity, Since 31 Dec 08 | RELIANCE3% ₹1,490 Cr 12,414,419 Larsen & Toubro Ltd (Industrials)
Equity, Since 29 Feb 12 | LT2% ₹1,467 Cr 4,636,318
↑ 276,900 Embassy Office Parks Reit
Unlisted bonds | -2% ₹1,342 Cr 36,839,670 Bharti Airtel Ltd (Communication Services)
Equity, Since 31 Jan 15 | BHARTIARTL2% ₹1,314 Cr 8,368,507
↑ 376,725 4. Nippon India Balanced Advantage Fund
CAGR/Annualized return of 14.9% since its launch. Ranked 46 in Dynamic Allocation category. Return for 2024 was 13% , 2023 was 17.5% and 2022 was 5.1% . Nippon India Balanced Advantage Fund
Growth Launch Date 15 Nov 04 NAV (17 Apr 25) ₹170.533 ↑ 1.36 (0.80 %) Net Assets (Cr) ₹8,808 on 31 Mar 25 Category Hybrid - Dynamic Allocation AMC Nippon Life Asset Management Ltd. Rating ☆☆☆ Risk Moderately High Expense Ratio 1.77 Sharpe Ratio 0.16 Information Ratio 0 Alpha Ratio 0 Min Investment 5,000 Min SIP Investment 100 Exit Load 0-1 Years (1%),1 Years and above(NIL) Growth of 10,000 investment over the years.
Date Value 31 Mar 20 ₹10,000 31 Mar 21 ₹13,914 31 Mar 22 ₹15,334 31 Mar 23 ₹15,924 31 Mar 24 ₹19,777 31 Mar 25 ₹21,375 Returns for Nippon India Balanced Advantage Fund
absolute basis & more than 1 year are on CAGR (Compound Annual Growth Rate) basis. as on 17 Apr 25 Duration Returns 1 Month 5% 3 Month 1.9% 6 Month -0.6% 1 Year 9.2% 3 Year 11.9% 5 Year 15.6% 10 Year 15 Year Since launch 14.9% Historical performance (Yearly) on absolute basis
Year Returns 2023 13% 2022 17.5% 2021 5.1% 2020 15.7% 2019 11.2% 2018 8.3% 2017 0.4% 2016 25.2% 2015 6.4% 2014 0.9% Fund Manager information for Nippon India Balanced Advantage Fund
Name Since Tenure Ashutosh Bhargava 7 May 18 6.82 Yr. Kinjal Desai 25 May 18 6.77 Yr. Amar Kalkundrikar 20 Oct 20 4.36 Yr. Sushil Budhia 31 Mar 21 3.92 Yr. Data below for Nippon India Balanced Advantage Fund as on 31 Mar 25
Asset Allocation
Asset Class Value Cash 14.75% Equity 57.39% Debt 27.86% Equity Sector Allocation
Sector Value Financial Services 21.4% Industrials 8.11% Consumer Cyclical 8.01% Consumer Defensive 7.21% Technology 6.98% Basic Materials 3.65% Communication Services 3.38% Health Care 3.03% Utility 2.91% Energy 2.36% Real Estate 1.3% Debt Sector Allocation
Sector Value Corporate 17.61% Cash Equivalent 14.18% Government 9.16% Securitized 1.66% Credit Quality
Rating Value AA 34.71% AAA 65.29% Top Securities Holdings / Portfolio
Name Holding Value Quantity HDFC Bank Ltd (Financial Services)
Equity, Since 31 Oct 11 | HDFCBANK6% ₹500 Cr 2,884,813 ICICI Bank Ltd (Financial Services)
Equity, Since 31 Aug 18 | ICICIBANK5% ₹441 Cr 3,665,426
↓ -125,000 Infosys Ltd (Technology)
Equity, Since 31 May 09 | INFY4% ₹350 Cr 2,072,950 Bharti Airtel Ltd (Communication Services)
Equity, Since 31 Aug 18 | BHARTIARTL3% ₹237 Cr 1,512,468
↓ -350,000 Axis Bank Ltd (Financial Services)
Equity, Since 31 Oct 18 | 5322152% ₹199 Cr 1,964,434
↑ 375,000 NTPC Ltd (Utilities)
Equity, Since 31 Mar 21 | 5325552% ₹180 Cr 5,769,300 Reliance Industries Ltd (Energy)
Equity, Since 31 May 18 | RELIANCE2% ₹170 Cr 1,413,490 Larsen & Toubro Ltd (Industrials)
Equity, Since 31 Jan 21 | LT2% ₹147 Cr 464,495
↑ 32,000 State Bank of India (Financial Services)
Equity, Since 31 Mar 09 | SBIN2% ₹140 Cr 2,027,992 7.18% Govt Stock 2037
Sovereign Bonds | -2% ₹139 Cr 13,600,000 5. Principal Balanced Advantage Fund
CAGR/Annualized return of 8.9% since its launch. Return for 2024 was 12.6% , 2023 was 14.1% and 2022 was 5.7% . Principal Balanced Advantage Fund
Growth Launch Date 16 Dec 10 NAV (17 Apr 25) ₹33.9408 ↑ 0.32 (0.96 %) Net Assets (Cr) ₹1,491 on 31 Mar 25 Category Hybrid - Dynamic Allocation AMC Principal Pnb Asset Mgmt. Co. Priv. Ltd. Rating ☆☆ Risk Moderately High Expense Ratio 2.07 Sharpe Ratio -0.01 Information Ratio 0 Alpha Ratio 0 Min Investment 5,000 Min SIP Investment 500 Exit Load 0-1 Years (2%),1-2 Years (1%),2 Years and above(NIL) Growth of 10,000 investment over the years.
Date Value 31 Mar 20 ₹10,000 31 Mar 21 ₹12,182 31 Mar 22 ₹13,328 31 Mar 23 ₹13,627 31 Mar 24 ₹16,577 31 Mar 25 ₹17,642 Returns for Principal Balanced Advantage Fund
absolute basis & more than 1 year are on CAGR (Compound Annual Growth Rate) basis. as on 17 Apr 25 Duration Returns 1 Month 4.5% 3 Month 1.6% 6 Month -2.4% 1 Year 8.5% 3 Year 10.3% 5 Year 11.5% 10 Year 15 Year Since launch 8.9% Historical performance (Yearly) on absolute basis
Year Returns 2023 12.6% 2022 14.1% 2021 5.7% 2020 10.9% 2019 10% 2018 1% 2017 3.2% 2016 13.1% 2015 4.5% 2014 3.4% Fund Manager information for Principal Balanced Advantage Fund
Name Since Tenure Dwijendra Srivastava 1 Jan 22 3.16 Yr. S. Bharath 1 Jan 22 3.16 Yr. Clyton Fernandes 4 Oct 24 0.41 Yr. Data below for Principal Balanced Advantage Fund as on 31 Mar 25
Asset Allocation
Asset Class Value Cash 18.19% Equity 56.4% Debt 25.41% Equity Sector Allocation
Sector Value Financial Services 25.94% Technology 8.22% Consumer Cyclical 7.69% Energy 6.97% Health Care 5.15% Communication Services 4.28% Industrials 4.01% Consumer Defensive 3.83% Basic Materials 2.79% Utility 1.63% Debt Sector Allocation
Sector Value Cash Equivalent 18.78% Government 17.78% Corporate 5.27% Securitized 1.78% Credit Quality
Rating Value AAA 97.5% Top Securities Holdings / Portfolio
Name Holding Value Quantity ICICI Bank Ltd (Financial Services)
Equity, Since 31 Dec 10 | ICICIBANK6% ₹88 Cr 727,830
↑ 158,900 7.1% Govt Stock 2034
Sovereign Bonds | -6% ₹87 Cr 8,500,000 Reliance Industries Ltd (Energy)
Equity, Since 31 Dec 10 | RELIANCE6% ₹85 Cr 711,000
↑ 13,500 HDFC Bank Ltd (Financial Services)
Equity, Since 30 Nov 18 | HDFCBANK6% ₹84 Cr 483,390
↑ 24,750 Infosys Ltd (Technology)
Equity, Since 31 Dec 17 | INFY4% ₹59 Cr 352,400
↑ 8,000 Bharti Airtel Ltd (Communication Services)
Equity, Since 30 Nov 18 | BHARTIARTL4% ₹55 Cr 351,350 Kotak Mahindra Bank Ltd (Financial Services)
Equity, Since 31 Dec 21 | KOTAKBANK3% ₹46 Cr 243,220
↑ 19,700 7.32% Govt Stock 2030
Sovereign Bonds | -2% ₹31 Cr 3,000,000 7.23% Govt Stock 2039
Sovereign Bonds | -2% ₹31 Cr 3,000,000 7.38% Govt Stock 2027
Sovereign Bonds | -2% ₹31 Cr 3,000,000 6. L&T Dynamic Equity Fund
CAGR/Annualized return of 10.6% since its launch. Ranked 28 in Dynamic Allocation category. Return for 2024 was 15.4% , 2023 was 18% and 2022 was 1.8% . L&T Dynamic Equity Fund
Growth Launch Date 7 Feb 11 NAV (17 Apr 25) ₹41.9 ↑ 0.20 (0.47 %) Net Assets (Cr) ₹1,471 on 31 Mar 25 Category Hybrid - Dynamic Allocation AMC L&T Investment Management Ltd Rating ☆☆ Risk Moderately High Expense Ratio 2.12 Sharpe Ratio 0.05 Information Ratio 0 Alpha Ratio 0 Min Investment 5,000 Min SIP Investment 500 Exit Load 0-1 Years (1%),1 Years and above(NIL) Growth of 10,000 investment over the years.
Date Value 31 Mar 20 ₹10,000 31 Mar 21 ₹12,881 31 Mar 22 ₹13,739 31 Mar 23 ₹14,053 31 Mar 24 ₹17,248 31 Mar 25 ₹18,467 Returns for L&T Dynamic Equity Fund
absolute basis & more than 1 year are on CAGR (Compound Annual Growth Rate) basis. as on 17 Apr 25 Duration Returns 1 Month 4.5% 3 Month 0.3% 6 Month -1.7% 1 Year 8% 3 Year 10.7% 5 Year 12.1% 10 Year 15 Year Since launch 10.6% Historical performance (Yearly) on absolute basis
Year Returns 2023 15.4% 2022 18% 2021 1.8% 2020 8.4% 2019 12.8% 2018 8.2% 2017 3.4% 2016 11.4% 2015 1.9% 2014 3.8% Fund Manager information for L&T Dynamic Equity Fund
Name Since Tenure Mahesh Chhabria 15 Jul 23 1.63 Yr. Neelotpal Sahai 26 Nov 22 2.26 Yr. Praveen Ayathan 1 Oct 23 1.42 Yr. Gautam Bhupal 1 Oct 23 1.42 Yr. Sonal Gupta 1 Oct 23 1.42 Yr. Hitesh Gondhia 1 Oct 23 1.42 Yr. Mohd Asif Rizwi 1 Feb 25 0.08 Yr. Data below for L&T Dynamic Equity Fund as on 31 Mar 25
Asset Allocation
Asset Class Value Cash 24.98% Equity 43.68% Debt 31.34% Equity Sector Allocation
Sector Value Financial Services 24.17% Technology 9.68% Health Care 6.75% Consumer Cyclical 5.79% Consumer Defensive 4.34% Industrials 4.03% Utility 3.63% Energy 2.93% Basic Materials 2.37% Real Estate 1.98% Debt Sector Allocation
Sector Value Cash Equivalent 24.98% Government 16.66% Corporate 14.68% Credit Quality
Rating Value AAA 100% Top Securities Holdings / Portfolio
Name Holding Value Quantity ICICI Bank Ltd (Financial Services)
Equity, Since 31 Jul 18 | ICICIBANK7% ₹100 Cr 829,700
↑ 147,000 HDFC Bank Ltd (Financial Services)
Equity, Since 30 Jun 17 | HDFCBANK4% ₹61 Cr 350,000
↑ 150,000 Axis Bank Ltd (Financial Services)
Equity, Since 30 Jun 24 | 5322154% ₹58 Cr 566,875
↑ 166,875 7.18% Govt Stock 2033
Sovereign Bonds | -4% ₹57 Cr 5,500,000 Infosys Ltd (Technology)
Equity, Since 30 Sep 18 | INFY4% ₹56 Cr 329,200
↑ 129,200 7.06% Govt Stock 2028
Sovereign Bonds | -3% ₹50 Cr 4,800,000 7.37% Govt Stock 2028
Sovereign Bonds | -3% ₹42 Cr 4,000,000 Reliance Industries Ltd (Energy)
Equity, Since 31 May 18 | RELIANCE3% ₹42 Cr 350,000 Future on ICICI Bank Ltd
Derivatives | -3% -₹40 Cr Aurobindo Pharma Ltd (Healthcare)
Equity, Since 30 Apr 21 | AUROPHARMA3% ₹38 Cr 354,750
↑ 9,350 7. Invesco India Dynamic Equity Fund
CAGR/Annualized return of 9.8% since its launch. Ranked 55 in Dynamic Allocation category. Return for 2024 was 15.9% , 2023 was 20.1% and 2022 was 4.1% . Invesco India Dynamic Equity Fund
Growth Launch Date 4 Oct 07 NAV (17 Apr 25) ₹51.18 ↑ 0.51 (1.01 %) Net Assets (Cr) ₹943 on 31 Mar 25 Category Hybrid - Dynamic Allocation AMC Invesco Asset Management (India) Private Ltd Rating ☆☆ Risk Moderately High Expense Ratio 2.29 Sharpe Ratio 0.07 Information Ratio 0 Alpha Ratio 0 Min Investment 5,000 Min SIP Investment 500 Exit Load NIL Growth of 10,000 investment over the years.
Date Value 31 Mar 20 ₹10,000 31 Mar 21 ₹13,319 31 Mar 22 ₹14,708 31 Mar 23 ₹15,087 31 Mar 24 ₹19,150 31 Mar 25 ₹20,532 Returns for Invesco India Dynamic Equity Fund
absolute basis & more than 1 year are on CAGR (Compound Annual Growth Rate) basis. as on 17 Apr 25 Duration Returns 1 Month 3.3% 3 Month -1.1% 6 Month -3.5% 1 Year 7% 3 Year 11.7% 5 Year 14.5% 10 Year 15 Year Since launch 9.8% Historical performance (Yearly) on absolute basis
Year Returns 2023 15.9% 2022 20.1% 2021 4.1% 2020 13.1% 2019 7.8% 2018 9.1% 2017 -4.6% 2016 30.5% 2015 2.7% 2014 5.5% Fund Manager information for Invesco India Dynamic Equity Fund
Name Since Tenure Amit Ganatra 1 Sep 22 2.5 Yr. Krishna Cheemalapati 1 Mar 25 0 Yr. Dhimant Kothari 1 Sep 22 2.5 Yr. Data below for Invesco India Dynamic Equity Fund as on 31 Mar 25
Asset Allocation
Asset Class Value Cash 29.46% Equity 56.85% Debt 13.65% Other 0.04% Equity Sector Allocation
Sector Value Financial Services 15.2% Technology 10.19% Industrials 8.83% Health Care 8.82% Consumer Cyclical 8.67% Energy 4.41% Communication Services 2.29% Consumer Defensive 1.99% Basic Materials 1.67% Utility 1.31% Real Estate 0.84% Debt Sector Allocation
Sector Value Cash Equivalent 28.36% Government 9.16% Corporate 5.59% Credit Quality
Rating Value AAA 100% Top Securities Holdings / Portfolio
Name Holding Value Quantity HDFC Bank Ltd (Financial Services)
Equity, Since 30 Sep 24 | HDFCBANK6% ₹58 Cr 335,806
↑ 41,089 Invesco India Shrt DurDir Gr
Investment Fund | -6% ₹55 Cr 145,449 Larsen & Toubro Ltd (Industrials)
Equity, Since 31 Jul 21 | LT6% ₹53 Cr 167,843
↑ 9,482 Invesco India Money Market Dir Gr
Investment Fund | -5% ₹50 Cr 164,551 Infosys Ltd (Technology)
Equity, Since 31 Oct 24 | INFY5% ₹43 Cr 257,366
↑ 39,128 ICICI Bank Ltd (Financial Services)
Equity, Since 31 Oct 18 | ICICIBANK4% ₹41 Cr 343,187
↑ 34,706 Reliance Industries Ltd (Energy)
Equity, Since 30 Apr 21 | RELIANCE4% ₹41 Cr 337,732 Future on Larsen & Toubro Ltd
Derivatives | -4% -₹33 Cr 105,000 Sun Pharmaceuticals Industries Ltd (Healthcare)
Equity, Since 30 Sep 21 | SUNPHARMA2% ₹23 Cr 143,127
↑ 8,727 Bharti Airtel Ltd (Partly Paid Rs.1.25) (Communication Services)
Equity, Since 31 Oct 21 | 8901572% ₹21 Cr 188,654
↑ 29,153 8. Edelweiss Balanced Advantage Fund
CAGR/Annualized return of 10.6% since its launch. Ranked 26 in Dynamic Allocation category. Return for 2024 was 13.1% , 2023 was 18.8% and 2022 was 2.1% . Edelweiss Balanced Advantage Fund
Growth Launch Date 20 Aug 09 NAV (17 Apr 25) ₹48.53 ↑ 0.43 (0.89 %) Net Assets (Cr) ₹12,240 on 31 Mar 25 Category Hybrid - Dynamic Allocation AMC Edelweiss Asset Management Limited Rating ☆☆ Risk Moderately High Expense Ratio 1.72 Sharpe Ratio -0.01 Information Ratio 0 Alpha Ratio 0 Min Investment 1,000 Min SIP Investment 500 Exit Load 0-365 Days (1%),365 Days and above(NIL) Growth of 10,000 investment over the years.
Date Value 31 Mar 20 ₹10,000 31 Mar 21 ₹14,191 31 Mar 22 ₹16,025 31 Mar 23 ₹16,305 31 Mar 24 ₹20,487 31 Mar 25 ₹21,789 Returns for Edelweiss Balanced Advantage Fund
absolute basis & more than 1 year are on CAGR (Compound Annual Growth Rate) basis. as on 17 Apr 25 Duration Returns 1 Month 3.8% 3 Month 0.1% 6 Month -3.9% 1 Year 6.3% 3 Year 10.6% 5 Year 15.6% 10 Year 15 Year Since launch 10.6% Historical performance (Yearly) on absolute basis
Year Returns 2023 13.1% 2022 18.8% 2021 2.1% 2020 18.8% 2019 22.6% 2018 7.8% 2017 1.9% 2016 23.9% 2015 -1.5% 2014 3.7% Fund Manager information for Edelweiss Balanced Advantage Fund
Name Since Tenure Bhavesh Jain 7 Aug 13 11.57 Yr. Bharat Lahoti 18 Sep 17 7.45 Yr. Rahul Dedhia 23 Nov 21 3.27 Yr. Pranavi Kulkarni 1 Aug 24 0.58 Yr. Data below for Edelweiss Balanced Advantage Fund as on 31 Mar 25
Asset Allocation
Asset Class Value Cash 24.43% Equity 63.98% Debt 11.31% Other 0% Equity Sector Allocation
Sector Value Financial Services 22.7% Technology 9.4% Consumer Cyclical 8.77% Health Care 6.89% Consumer Defensive 5.59% Utility 4.26% Energy 4.02% Industrials 3.37% Basic Materials 3.34% Communication Services 2.71% Real Estate 1.19% Debt Sector Allocation
Sector Value Cash Equivalent 25.09% Corporate 7.42% Government 3.26% Securitized 0.25% Credit Quality
Rating Value AAA 100% Top Securities Holdings / Portfolio
Name Holding Value Quantity Nifty 27-Mar-2025
- | -10% -₹1,222 Cr 548,250
↑ 548,250 HDFC Bank Ltd (Financial Services)
Equity, Since 30 Jun 20 | HDFCBANK6% ₹659 Cr 3,806,821 ICICI Bank Ltd (Financial Services)
Equity, Since 30 Nov 14 | ICICIBANK4% ₹512 Cr 4,255,625 Reliance Industries Ltd (Energy)
Equity, Since 30 Nov 21 | RELIANCE3% ₹328 Cr 2,735,497 Infosys Ltd (Technology)
Equity, Since 30 Jun 20 | INFY3% ₹304 Cr 1,802,056 Bajaj Finance Ltd (Financial Services)
Equity, Since 30 Sep 21 | 5000342% ₹282 Cr 330,572
↑ 40,000 Bharti Airtel Ltd (Communication Services)
Equity, Since 31 Dec 19 | BHARTIARTL2% ₹267 Cr 1,701,286 NTPC Ltd (Utilities)
Equity, Since 31 Mar 21 | 5325552% ₹243 Cr 7,796,261 Maruti Suzuki India Ltd (Consumer Cyclical)
Equity, Since 31 Mar 15 | MARUTI2% ₹215 Cr 180,050 Sun Pharmaceuticals Industries Ltd (Healthcare)
Equity, Since 31 Dec 20 | SUNPHARMA2% ₹215 Cr 1,349,372
ഇവിടെ നൽകിയിരിക്കുന്ന വിവരങ്ങൾ കൃത്യമാണെന്ന് ഉറപ്പാക്കാൻ എല്ലാ ശ്രമങ്ങളും നടത്തിയിട്ടുണ്ട്. എന്നിരുന്നാലും, ഡാറ്റയുടെ കൃത്യത സംബന്ധിച്ച് യാതൊരു ഉറപ്പും നൽകുന്നില്ല. എന്തെങ്കിലും നിക്ഷേപം നടത്തുന്നതിന് മുമ്പ് സ്കീം വിവര രേഖ ഉപയോഗിച്ച് പരിശോധിക്കുക.


AMFI Registration No. 112358 | CIN: U74999MH2016PTC282153
Shepard Technologies Pvt. Ltd. (with ARN code 112358) makes no warranties or representations, express or implied, on products offered through the platform. It accepts no liability for any damages or losses, however caused, in connection with the use of, or on the reliance of its product or related services. Terms and conditions of the website are applicable.
©2025 Shepard Technologies Private Limited. All Rights Reserved
Informative . Comparison has been shown nicely in small space.