ELSS കാൽക്കുലേറ്റർ
ആമുഖം
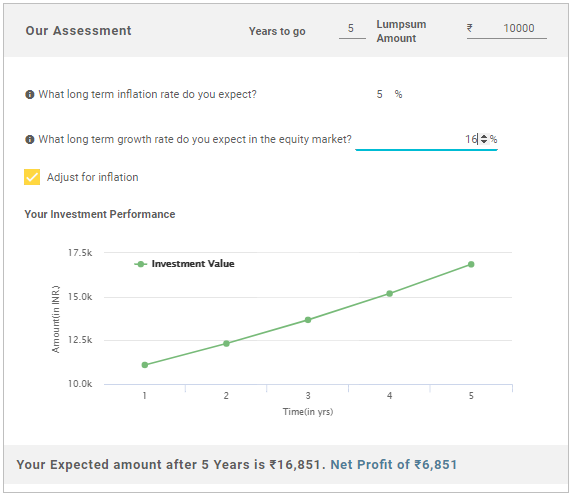
ELSS ഒരു ഓപ്പൺ-എൻഡ് ഇക്വിറ്റി ആണ്മ്യൂച്വൽ ഫണ്ട് ഇത് നികുതി ലാഭിക്കുന്നതിന് മാത്രമല്ല, നിങ്ങളുടെ നിക്ഷേപത്തിന് വളർച്ചാ അവസരവും സൃഷ്ടിക്കുന്നു. ജനങ്ങൾക്കിടയിൽ ദീർഘകാല നിക്ഷേപം എന്ന ശീലം വളർത്തിയെടുക്കുന്നതിനാണ് ഈ പദ്ധതികൾ ഇന്ത്യാ ഗവൺമെന്റ് പ്രോത്സാഹിപ്പിക്കുന്നത്. പേരിൽ നിന്ന് വ്യക്തമാകുന്നത് പോലെ, ഇക്വിറ്റി ലിങ്ക്ഡ് സേവിംഗ്സ് സ്കീമിലെ ഫണ്ടിന്റെ പ്രധാന ഭാഗം നിക്ഷേപിച്ചിരിക്കുന്നത്ഓഹരികൾ അല്ലെങ്കിൽ ഇക്വിറ്റിയുമായി ബന്ധപ്പെട്ട ഉൽപ്പന്നങ്ങൾ. നിങ്ങൾ ഇക്വിറ്റി നിക്ഷേപം നടത്താൻ പദ്ധതിയിടുമ്പോൾ, അതിനുമുമ്പ് നിക്ഷേപത്തിന്റെ പ്രകടനം നിർണ്ണയിക്കുന്നത് ബുദ്ധിപരമായ തീരുമാനമാണ്.നിക്ഷേപിക്കുന്നു. ഒരു ELSS കാൽക്കുലേറ്റർ എന്നറിയപ്പെടുന്ന ഒരു ഉപകരണം ഉപയോഗിച്ച് ഇത് ചെയ്യാൻ കഴിയും.
എന്താണ് ഒരു ELSS കാൽക്കുലേറ്റർ?
ഒരു ELSS സ്കീമിലെ മികച്ച നിക്ഷേപം തിരഞ്ഞെടുക്കുന്നതുമായി ബന്ധപ്പെട്ട് ശരിയായ തീരുമാനങ്ങൾ എടുക്കാൻ നിങ്ങളെ സഹായിക്കുന്നതിൽ ഒരു പ്രധാന പങ്ക് വഹിക്കുന്ന വളരെ സഹായകരമായ ഉപകരണമാണ് ELSS കാൽക്കുലേറ്റർ. T=നിക്ഷേപം എത്രത്തോളം ഫലപ്രദമാണോ അല്ലയോ എന്ന് നിങ്ങൾക്ക് വിലയിരുത്താൻ കഴിയും. നിങ്ങൾ തിരഞ്ഞെടുക്കുന്ന സ്കീമിന്റെ തരത്തെ ആശ്രയിച്ച്, നിങ്ങൾക്ക് ഉപയോഗിക്കാൻ കഴിയുന്ന നിരവധി ELSS കാൽക്കുലേറ്ററുകൾ ഉണ്ട്.
ELSS കാൽക്കുലേറ്റർ: SIP വർക്കിന്റെ മുൻകാല പ്രകടനം?
കഴിഞ്ഞ പ്രകടനംസിപ്പ് കാൽക്കുലേറ്റർ നിങ്ങളുടെ ചരിത്രപരമായ പ്രകടനത്തെക്കുറിച്ചുള്ള സ്ഥിതിവിവരക്കണക്കുകൾ നൽകുന്നതിനുള്ള ഒരു പ്രധാന ഉപകരണമാണ്എസ്.ഐ.പി. കാൽക്കുലേറ്റർ ഇനിപ്പറയുന്നതുപോലുള്ള ചില വിശദാംശങ്ങൾ കണക്കിലെടുക്കുന്നു:
- SIP നിക്ഷേപം തുക
- SIP-യുടെ ആരംഭ മാസവും വർഷവും
- SIP-യുടെ മെച്യൂരിറ്റി മാസവും വർഷവും
- മൂല്യനിർണയ തീയതി
- യുടെ പേര്അസറ്റ് മാനേജ്മെന്റ് കമ്പനി
മേൽപ്പറഞ്ഞ വിശദാംശങ്ങൾക്കൊപ്പം, കാലാവധി പൂർത്തിയാകുമ്പോൾ നിങ്ങളുടെ SIP നിക്ഷേപത്തിന്റെ മൂല്യം എത്രയായിരിക്കുമെന്ന് ഒരു ELSS SIP കഴിഞ്ഞ പ്രകടന കാൽക്കുലേറ്റർ ഒരു എസ്റ്റിമേറ്റ് സൃഷ്ടിക്കും. വ്യത്യസ്ത സമയങ്ങളിൽ ഒരു ഫണ്ട് എങ്ങനെ പ്രവർത്തിക്കുന്നുവെന്ന് നിർണ്ണയിക്കുന്നതിനുള്ള നല്ലൊരു മാർഗമാണ് അത്തരമൊരു വിലയിരുത്തൽവിപണി ചക്രങ്ങൾ. ഭാവിയിലെ സാധ്യതകളുടെ അടിസ്ഥാനത്തിൽ ഫണ്ട് എവിടേക്കാണ് പോകുന്നതെന്ന് അളക്കുന്നതിനുള്ള നല്ല ഉൾക്കാഴ്ച കൂടിയാണ് ദീർഘകാല പ്രകടനം. മുൻകാല പ്രകടനങ്ങൾ ഭാവിയിലെ ആദായത്തിന് ഒരു ഗ്യാരണ്ടിയും നൽകുന്നില്ലെന്ന് വ്യക്തമാക്കേണ്ടതുണ്ടെങ്കിലും, പ്രതികൂലമായ വിപണി സാഹചര്യങ്ങളിൽ ഫണ്ട് എങ്ങനെ പിടിച്ചുനിന്നുവെന്ന് കാണിക്കുന്നതിലൂടെ അവ സഹായിക്കുന്നു.
Know Your SIP Returns
Talk to our investment specialist
മുൻനിര ELSS ഫണ്ടുകൾ
To provide medium to long term capital gains along with income tax relief to its Unitholders, while at all times emphasising the importance of capital appreciation.. Below is the key information for Tata India Tax Savings Fund Returns up to 1 year are on To generate long term capital appreciation from a portfolio that is predominantly in equity and equity related instruments Research Highlights for HDFC Long Term Advantage Fund Below is the key information for HDFC Long Term Advantage Fund Returns up to 1 year are on The Scheme will seek to invest predominantly in a diversified portfolio of equity and equity related instruments with the objective to provide investors with opportunities for capital appreciation and income along with the benefit of income-tax deduction(under section 80C of the Income-tax Act, 1961) on their investments. Investments in this scheme would be subject to a statutory lock-in of 3 years from the date of allotment to be eligible for income-tax benefits under Section 80C. There can be no assurance that the investment objective under the scheme will be realized. Research Highlights for IDBI Equity Advantage Fund Below is the key information for IDBI Equity Advantage Fund Returns up to 1 year are on To achieve capital appreciation by investing
predominantly in equities and equity-related
instruments. A three-year lock-in period shall
apply in line with the regulation for ELSS
schemes. Research Highlights for Sundaram Diversified Equity Fund Below is the key information for Sundaram Diversified Equity Fund Returns up to 1 year are on 1. Tata India Tax Savings Fund
Tata India Tax Savings Fund
Growth Launch Date 13 Oct 14 NAV (10 Dec 25) ₹45.4133 ↓ -0.18 (-0.40 %) Net Assets (Cr) ₹4,717 on 31 Oct 25 Category Equity - ELSS AMC Tata Asset Management Limited Rating ☆☆☆☆☆ Risk Moderately High Expense Ratio 1.83 Sharpe Ratio -0.18 Information Ratio -0.35 Alpha Ratio -2.94 Min Investment 500 Min SIP Investment 500 Exit Load NIL Growth of 10,000 investment over the years.
Date Value 30 Nov 20 ₹10,000 30 Nov 21 ₹13,526 30 Nov 22 ₹15,196 30 Nov 23 ₹17,077 30 Nov 24 ₹21,970 30 Nov 25 ₹23,035 Returns for Tata India Tax Savings Fund
absolute basis & more than 1 year are on CAGR (Compound Annual Growth Rate) basis. as on 10 Dec 25 Duration Returns 1 Month 0.1% 3 Month 3.3% 6 Month 2.1% 1 Year -0.5% 3 Year 14.2% 5 Year 16.9% 10 Year 15 Year Since launch 14.5% Historical performance (Yearly) on absolute basis
Year Returns 2024 19.5% 2023 24% 2022 5.9% 2021 30.4% 2020 11.9% 2019 13.6% 2018 -8.4% 2017 46% 2016 2.1% 2015 13.3% Fund Manager information for Tata India Tax Savings Fund
Name Since Tenure Sailesh Jain 16 Dec 21 3.88 Yr. Data below for Tata India Tax Savings Fund as on 31 Oct 25
Equity Sector Allocation
Sector Value Financial Services 34.31% Industrials 15.33% Consumer Cyclical 13.04% Basic Materials 7.32% Technology 6.25% Energy 5.45% Communication Services 4.41% Health Care 3.39% Real Estate 2.54% Utility 2.47% Consumer Defensive 1.85% Asset Allocation
Asset Class Value Cash 3.22% Equity 96.78% Top Securities Holdings / Portfolio
Name Holding Value Quantity HDFC Bank Ltd (Financial Services)
Equity, Since 28 Feb 10 | HDFCBANK7% ₹341 Cr 3,450,000 ICICI Bank Ltd (Financial Services)
Equity, Since 30 Nov 16 | ICICIBANK6% ₹286 Cr 2,125,000 Reliance Industries Ltd (Energy)
Equity, Since 31 Jan 18 | RELIANCE4% ₹201 Cr 1,350,000 Bharti Airtel Ltd (Communication Services)
Equity, Since 30 Sep 19 | BHARTIARTL4% ₹193 Cr 940,000 State Bank of India (Financial Services)
Equity, Since 30 Nov 18 | SBIN4% ₹191 Cr 2,040,000 Infosys Ltd (Technology)
Equity, Since 30 Sep 18 | INFY4% ₹172 Cr 1,160,000 Axis Bank Ltd (Financial Services)
Equity, Since 31 Aug 18 | 5322153% ₹160 Cr 1,300,000 Larsen & Toubro Ltd (Industrials)
Equity, Since 30 Nov 16 | LT3% ₹142 Cr 352,147 NTPC Ltd (Utilities)
Equity, Since 30 Jun 21 | 5325552% ₹116 Cr 3,451,000 Bajaj Finance Ltd (Financial Services)
Equity, Since 31 Mar 22 | 5000342% ₹112 Cr 1,070,000 2. HDFC Long Term Advantage Fund
HDFC Long Term Advantage Fund
Growth Launch Date 2 Jan 01 NAV (14 Jan 22) ₹595.168 ↑ 0.28 (0.05 %) Net Assets (Cr) ₹1,318 on 30 Nov 21 Category Equity - ELSS AMC HDFC Asset Management Company Limited Rating ☆☆☆ Risk Moderately High Expense Ratio 2.25 Sharpe Ratio 2.27 Information Ratio -0.15 Alpha Ratio 1.75 Min Investment 500 Min SIP Investment 500 Exit Load NIL Growth of 10,000 investment over the years.
Date Value 30 Nov 20 ₹10,000 30 Nov 21 ₹14,347
Purchase not allowed Returns for HDFC Long Term Advantage Fund
absolute basis & more than 1 year are on CAGR (Compound Annual Growth Rate) basis. as on 10 Dec 25 Duration Returns 1 Month 4.4% 3 Month 1.2% 6 Month 15.4% 1 Year 35.5% 3 Year 20.6% 5 Year 17.4% 10 Year 15 Year Since launch 21.4% Historical performance (Yearly) on absolute basis
Year Returns 2024 2023 2022 2021 2020 2019 2018 2017 2016 2015 Fund Manager information for HDFC Long Term Advantage Fund
Name Since Tenure Data below for HDFC Long Term Advantage Fund as on 30 Nov 21
Equity Sector Allocation
Sector Value Asset Allocation
Asset Class Value Top Securities Holdings / Portfolio
Name Holding Value Quantity 3. IDBI Equity Advantage Fund
IDBI Equity Advantage Fund
Growth Launch Date 10 Sep 13 NAV (28 Jul 23) ₹43.39 ↑ 0.04 (0.09 %) Net Assets (Cr) ₹485 on 30 Jun 23 Category Equity - ELSS AMC IDBI Asset Management Limited Rating ☆☆☆ Risk Moderately High Expense Ratio 2.39 Sharpe Ratio 1.21 Information Ratio -1.13 Alpha Ratio 1.78 Min Investment 500 Min SIP Investment 500 Exit Load NIL Growth of 10,000 investment over the years.
Date Value 30 Nov 20 ₹10,000 30 Nov 21 ₹12,885 30 Nov 22 ₹14,125 Returns for IDBI Equity Advantage Fund
absolute basis & more than 1 year are on CAGR (Compound Annual Growth Rate) basis. as on 10 Dec 25 Duration Returns 1 Month 3.1% 3 Month 9.7% 6 Month 15.1% 1 Year 16.9% 3 Year 20.8% 5 Year 10% 10 Year 15 Year Since launch 16% Historical performance (Yearly) on absolute basis
Year Returns 2024 2023 2022 2021 2020 2019 2018 2017 2016 2015 Fund Manager information for IDBI Equity Advantage Fund
Name Since Tenure Data below for IDBI Equity Advantage Fund as on 30 Jun 23
Equity Sector Allocation
Sector Value Asset Allocation
Asset Class Value Top Securities Holdings / Portfolio
Name Holding Value Quantity 4. Sundaram Diversified Equity Fund
Sundaram Diversified Equity Fund
Growth Launch Date 22 Nov 99 NAV (10 Dec 25) ₹223.849 ↓ -0.66 (-0.29 %) Net Assets (Cr) ₹1,481 on 31 Oct 25 Category Equity - ELSS AMC Sundaram Asset Management Company Ltd Rating ☆☆☆ Risk Moderately High Expense Ratio 2.18 Sharpe Ratio 0.02 Information Ratio -1.01 Alpha Ratio -0.02 Min Investment 500 Min SIP Investment 250 Exit Load NIL Growth of 10,000 investment over the years.
Date Value 30 Nov 20 ₹10,000 30 Nov 21 ₹13,652 30 Nov 22 ₹15,093 30 Nov 23 ₹16,938 30 Nov 24 ₹20,351 30 Nov 25 ₹21,582 Returns for Sundaram Diversified Equity Fund
absolute basis & more than 1 year are on CAGR (Compound Annual Growth Rate) basis. as on 10 Dec 25 Duration Returns 1 Month 0.3% 3 Month 1.2% 6 Month 1.9% 1 Year 1.5% 3 Year 12.2% 5 Year 15.5% 10 Year 15 Year Since launch 15.7% Historical performance (Yearly) on absolute basis
Year Returns 2024 12% 2023 23.3% 2022 4% 2021 31.5% 2020 9.9% 2019 6.2% 2018 -10.6% 2017 38.4% 2016 6.8% 2015 3.1% Fund Manager information for Sundaram Diversified Equity Fund
Name Since Tenure Rohit Seksaria 24 Feb 21 4.69 Yr. Bharath Subramanian 2 Jun 25 0.42 Yr. Data below for Sundaram Diversified Equity Fund as on 31 Oct 25
Equity Sector Allocation
Sector Value Financial Services 24.53% Industrials 9.63% Consumer Cyclical 9.62% Consumer Defensive 8.9% Basic Materials 8.69% Energy 7.96% Utility 7.34% Technology 7.33% Health Care 5.89% Communication Services 4.3% Asset Allocation
Asset Class Value Cash 4.4% Equity 95.6% Top Securities Holdings / Portfolio
Name Holding Value Quantity HDFC Bank Ltd (Financial Services)
Equity, Since 31 Mar 13 | HDFCBANK9% ₹128 Cr 1,294,318 Reliance Industries Ltd (Energy)
Equity, Since 30 Apr 12 | RELIANCE6% ₹88 Cr 592,000 ICICI Bank Ltd (Financial Services)
Equity, Since 30 Nov 11 | ICICIBANK5% ₹78 Cr 583,000 Axis Bank Ltd (Financial Services)
Equity, Since 31 May 18 | 5322154% ₹64 Cr 520,000
↑ 15,000 Bharti Airtel Ltd (Communication Services)
Equity, Since 31 Oct 19 | BHARTIARTL4% ₹64 Cr 310,165 State Bank of India (Financial Services)
Equity, Since 31 Aug 20 | SBIN4% ₹56 Cr 595,000 Larsen & Toubro Ltd (Industrials)
Equity, Since 31 May 18 | LT4% ₹56 Cr 138,000 Infosys Ltd (Technology)
Equity, Since 30 Nov 16 | INFY4% ₹52 Cr 352,000 ITC Ltd (Consumer Defensive)
Equity, Since 28 Feb 23 | ITC3% ₹51 Cr 1,210,000 NTPC Ltd (Utilities)
Equity, Since 31 Oct 24 | 5325553% ₹41 Cr 1,215,766
↑ 433,766
ഇവിടെ നൽകിയിരിക്കുന്ന വിവരങ്ങൾ കൃത്യമാണെന്ന് ഉറപ്പാക്കാൻ എല്ലാ ശ്രമങ്ങളും നടത്തിയിട്ടുണ്ട്. എന്നിരുന്നാലും, ഡാറ്റയുടെ കൃത്യത സംബന്ധിച്ച് യാതൊരു ഉറപ്പും നൽകുന്നില്ല. എന്തെങ്കിലും നിക്ഷേപം നടത്തുന്നതിന് മുമ്പ് സ്കീം വിവര രേഖ ഉപയോഗിച്ച് പരിശോധിക്കുക.


Research Highlights for Tata India Tax Savings Fund