 +91-22-48913909
ఫిన్క్యాష్ »మ్యూచువల్ ఫండ్స్ »ఉత్తమ SIP ప్రణాళికలు భారతదేశం
Table of Contents
- సిస్టమాటిక్ ఇన్వెస్ట్మెంట్ ప్లాన్లో ఎందుకు పెట్టుబడి పెట్టాలి?
- సిస్టమాటిక్ ఇన్వెస్ట్మెంట్ ప్లాన్లో ఎలా పెట్టుబడి పెట్టాలి?
- FY 22 - 23లో పెట్టుబడి పెట్టడానికి ఉత్తమ SIP ప్లాన్లు
- ఉత్తమ SIP పెట్టుబడిని ఎలా ఎంచుకోవాలి?
- SIP కాలిక్యులేటర్ (SIP రిటర్న్ కాలిక్యులేటర్)
- తరచుగా అడిగే ప్రశ్నలు
- 1. SIP అంటే ఏమిటి?
- 2. SIP యొక్క ప్రయోజనాలు ఏమిటి?
- 3. SIPలో ఎవరు పెట్టుబడి పెట్టవచ్చు?
- 4. ఆఫ్లైన్ మోడ్లో SIPలో పెట్టుబడి పెట్టడానికి దశలు ఏమిటి?
- 5. నేను ICICI ప్రుడెన్షియల్ టెక్నాలజీ ఫండ్లో ఎందుకు పెట్టుబడి పెట్టాలి?
- 6. నేను SBI బ్లూచిప్ ఫండ్ రెగ్యులర్ గ్రోత్లో ఎందుకు పెట్టుబడి పెట్టాలి?
- 7. SIPలో పెట్టుబడి పెట్టేటప్పుడు మీరు ఏమి పరిగణించాలి?
- 8. SIP కోసం KYC ముఖ్యమా?
- 9. SIP లకు కనీస పెట్టుబడి అవసరం ఉందా?
Top 10 Funds
- Nippon India Small Cap Fund
- ICICI Prudential Infrastructure Fund
- SBI Contra Fund
- ICICI Prudential Technology Fund
- Motilal Oswal Midcap 30 Fund
- ICICI Prudential Dividend Yield Equity Fund
- SBI Healthcare Opportunities Fund
- TATA Digital India Fund
- L&T Emerging Businesses Fund
- ICICI Prudential Value Discovery Fund
భారతదేశంలో ఉత్తమ పనితీరు SIP ప్లాన్లు 2022
ఉత్తమమైనదిSIP ప్రణాళికలు? వాటిని ఎలా ఎంచుకోవాలి? ఇలా ఆలోచిస్తున్నప్పుడు పెట్టుబడిదారుల మదిలో వచ్చే కొన్ని సాధారణ ప్రశ్నలుపెట్టుబడి పెడుతున్నారు లోమ్యూచువల్ ఫండ్స్ SIP లేదా సిస్టమాటిక్ ద్వారాపెట్టుబడి ప్రణాళిక.
SIP పెట్టుబడి మ్యూచువల్ ఫండ్స్లో పెట్టుబడి పెట్టేటప్పుడు అత్యంత క్రమశిక్షణతో కూడిన పెట్టుబడి ఎంపికలలో ఒకటి. అంతేకాకుండా, SIP మ్యూచువల్ ఫండ్లో పెట్టుబడి పెట్టే కనీస మొత్తం INR 500 కంటే తక్కువగా ఉంటుంది. ఇది పెట్టుబడి పెట్టేలా చేస్తుందిటాప్ SIP చాలా సౌకర్యవంతంగా ప్లాన్ చేస్తుంది.
సాధారణంగా, భారతదేశంలోని కొన్ని ఉత్తమ SIP ప్లాన్లు ఎక్కువ కాలం పెట్టుబడి పెట్టినప్పుడు మంచి రాబడిని అందిస్తాయి. SIP లేదా సిస్టమాటిక్ ఇన్వెస్ట్మెంట్ ప్లాన్ని ఇన్వెస్ట్ చేయడం ద్వారా ఒకరు ఎంత సంపాదించవచ్చో తెలుసుకోవడానికి, తనిఖీ చేయండిసిప్ కాలిక్యులేటర్ (SIP రిటర్న్ కాలిక్యులేటర్ అని కూడా పిలుస్తారు) క్రింద విభాగం.
సిస్టమాటిక్ ఇన్వెస్ట్మెంట్ ప్లాన్లో ఎందుకు పెట్టుబడి పెట్టాలి?
క్రమబద్ధమైన పెట్టుబడి ప్రణాళిక బహుళ ప్రయోజనాలతో వస్తుంది. దీని కనీస పెట్టుబడి మొత్తంINR 500 మ్యూచువల్ ఫండ్స్లో తమ పెట్టుబడి ప్రయాణాన్ని ప్రారంభించడానికి చాలా మంది జనాభా మాత్రమే కాకుండా, చాలా మంది యువకుల దృష్టిని ఆకర్షించింది. ఒకపెట్టుబడిదారుడు ఎవరు కోరుకుంటున్నారుSIPలో పెట్టుబడి పెట్టండి వారి ప్రధాన ప్రణాళిక చేయవచ్చుఆర్థిక లక్ష్యాలు వంటి- పిల్లల చదువు, వివాహ ఖర్చులు, ఇల్లు/కారు కొనుగోలు మొదలైనవి, క్రమశిక్షణతో. ఒకరు తమ లక్ష్యాల ప్రకారం (స్వల్పకాలిక, మధ్య-కాలిక మరియు దీర్ఘకాలిక) పెట్టుబడిని ప్రారంభించవచ్చు మరియు నిర్దిష్ట వ్యవధిలో సంపదలో పెరుగుదలను పొందవచ్చు.
SIPలు రూపాయి ధర సగటు మరియు వంటి ప్రధాన ప్రయోజనాలను అందిస్తాయిసమ్మేళనం యొక్క శక్తి. రూపాయి ధర సగటు అనేది ఒక వ్యక్తికి ఆస్తి కొనుగోలు ఖర్చును సరాసరి చేయడంలో సహాయపడుతుంది. SIPలో, యూనిట్ల కొనుగోలు చాలా కాలం పాటు జరుగుతుంది మరియు ఇవి నెలవారీ వ్యవధిలో (సాధారణంగా) సమానంగా విస్తరించబడతాయి. కాలక్రమేణా పెట్టుబడి విస్తరించడం వల్ల, పెట్టుబడి స్టాక్లోకి చేయబడుతుందిసంత వివిధ ధరల పాయింట్ల వద్ద పెట్టుబడిదారునికి సగటు వ్యయం యొక్క ప్రయోజనాన్ని అందజేస్తుంది, అందుకే రూపాయి ఖర్చు సగటు అనే పదం.
చక్రవడ్డీ విషయంలో, మీరు అసలుపై మాత్రమే వడ్డీని పొందే సాధారణ వడ్డీ వలె కాకుండా, ఇక్కడ వడ్డీ మొత్తం ప్రధానానికి జోడించబడుతుంది మరియు వడ్డీ కొత్త ప్రిన్సిపాల్ (పాత ప్రిన్సిపల్ ప్లస్ లాభాలు)పై లెక్కించబడుతుంది. ఈ ప్రక్రియ ప్రతిసారీ కొనసాగుతుంది. SIPలోని మ్యూచువల్ ఫండ్లు వాయిదాలలో ఉన్నందున, అవి సమ్మేళనం చేయబడతాయి, ఇది ప్రారంభంలో పెట్టుబడి పెట్టిన మొత్తానికి మరింత జోడిస్తుంది.
సిస్టమాటిక్ ఇన్వెస్ట్మెంట్ ప్లాన్లో ఎలా పెట్టుబడి పెట్టాలి?
Fincash.comలో జీవితకాలం కోసం ఉచిత పెట్టుబడి ఖాతాను తెరవండి
మీ రిజిస్ట్రేషన్ మరియు KYC ప్రక్రియను పూర్తి చేయండి
పత్రాలను అప్లోడ్ చేయండి (పాన్, ఆధార్, మొదలైనవి).మరియు, మీరు పెట్టుబడి పెట్టడానికి సిద్ధంగా ఉన్నారు!
కాబట్టి, మీరు దేని కోసం ఎదురు చూస్తున్నారు? మీ SIP లేదా సిస్టమాటిక్ ఇన్వెస్ట్మెంట్ ప్లాన్తో ప్రారంభించండి మరియు ఇప్పుడు మెరుగ్గా ఆదా చేసుకోండి!
Talk to our investment specialist
FY 22 - 23లో పెట్టుబడి పెట్టడానికి ఉత్తమ SIP ప్లాన్లు
The primary investment objective of the scheme is to generate long term capital appreciation by investing predominantly in equity and equity related instruments of small cap companies and the secondary objective is to generate consistent returns by investing in debt and money market securities. Nippon India Small Cap Fund is a Equity - Small Cap fund was launched on 16 Sep 10. It is a fund with Moderately High risk and has given a Below is the key information for Nippon India Small Cap Fund Returns up to 1 year are on To generate capital appreciation and income distribution to unit holders by investing predominantly in equity/equity related securities of the companies belonging to the infrastructure development and balance in debt securities and money market instruments. ICICI Prudential Infrastructure Fund is a Equity - Sectoral fund was launched on 31 Aug 05. It is a fund with High risk and has given a Below is the key information for ICICI Prudential Infrastructure Fund Returns up to 1 year are on To provide the investors maximum growth opportunity through equity
investments in stocks of growth oriented sectors of the economy. SBI Contra Fund is a Equity - Contra fund was launched on 6 May 05. It is a fund with Moderately High risk and has given a Below is the key information for SBI Contra Fund Returns up to 1 year are on To generate long-term capital appreciation for you from a portfolio made up predominantly of equity and equity-related securities of technology intensive companies. ICICI Prudential Technology Fund is a Equity - Sectoral fund was launched on 3 Mar 00. It is a fund with High risk and has given a Below is the key information for ICICI Prudential Technology Fund Returns up to 1 year are on (Erstwhile Motilal Oswal MOSt Focused Midcap 30 Fund) The investment objective of the Scheme is to achieve long term capital appreciation by investing in a maximum of 30 quality mid-cap companies having long-term competitive advantages and potential for growth. However, there can be no assurance or guarantee that the investment objective of the Scheme would be achieved. Motilal Oswal Midcap 30 Fund is a Equity - Mid Cap fund was launched on 24 Feb 14. It is a fund with Moderately High risk and has given a Below is the key information for Motilal Oswal Midcap 30 Fund Returns up to 1 year are on The investment objective of ICICI Prudential Dividend Yield Equity Fund is to provide medium to long term capital gains and/or dividend distribution by investing in a well diversified portfolio of predominantly equity and equity related instruments, which offer attractive dividend yield ICICI Prudential Dividend Yield Equity Fund is a Equity - Dividend Yield fund was launched on 16 May 14. It is a fund with Moderately High risk and has given a Below is the key information for ICICI Prudential Dividend Yield Equity Fund Returns up to 1 year are on (Erstwhile SBI Pharma Fund) To provide the investors maximum growth opportunity through equity
investments in stocks of growth oriented sectors of the economy. SBI Healthcare Opportunities Fund is a Equity - Sectoral fund was launched on 31 Dec 04. It is a fund with High risk and has given a Below is the key information for SBI Healthcare Opportunities Fund Returns up to 1 year are on The investment objective of the scheme is to seek long term capital appreciation by investing atleast 80% of its net assets in equity/equity related instruments of the companies in Information Technology Sector in India.However, there is no assurance or guarantee that the investment objective of the Scheme will be achieved.The Scheme does not assure or guarantee any returns. TATA Digital India Fund is a Equity - Sectoral fund was launched on 28 Dec 15. It is a fund with High risk and has given a Below is the key information for TATA Digital India Fund Returns up to 1 year are on To generate long-term capital appreciation from a diversified portfolio of predominantly equity and equity related securities, including equity derivatives, in the Indian markets with key theme focus being emerging companies (small cap stocks). The Scheme could also additionally invest in Foreign Securities. L&T Emerging Businesses Fund is a Equity - Small Cap fund was launched on 12 May 14. It is a fund with High risk and has given a Below is the key information for L&T Emerging Businesses Fund Returns up to 1 year are on To generate returns through a combination of dividend income and capital appreciation by investing primarily in a well-diversified portfolio of value stocks. Value stocks are those, which have attractive valuations in relation to earnings or book value or current and/or future dividends. ICICI Prudential Value Discovery Fund is a Equity - Value fund was launched on 16 Aug 04. It is a fund with Moderately High risk and has given a Below is the key information for ICICI Prudential Value Discovery Fund Returns up to 1 year are on Fund NAV Net Assets (Cr) Min SIP Investment 3 MO (%) 6 MO (%) 1 YR (%) 3 YR (%) 5 YR (%) 2024 (%) Nippon India Small Cap Fund Growth ₹145.932
↑ 2.00 ₹57,010 100 -13.7 -16.7 1.5 20.9 28.4 26.1 ICICI Prudential Infrastructure Fund Growth ₹169.45
↑ 1.79 ₹7,435 100 -7.4 -10.6 4.9 27.5 28.1 27.4 SBI Contra Fund Growth ₹352.11
↓ -0.95 ₹41,634 500 -4.9 -9.5 4.5 21.3 27.7 18.8 ICICI Prudential Technology Fund Growth ₹203.46
↑ 0.78 ₹14,101 100 -0.3 -0.2 11.7 9.9 26.8 25.4 Motilal Oswal Midcap 30 Fund Growth ₹92.5028
↑ 0.71 ₹24,488 500 -11.2 -7.1 21.6 27.7 26.1 57.1 ICICI Prudential Dividend Yield Equity Fund Growth ₹47.56
↑ 0.10 ₹4,835 100 -3.1 -7.8 7.1 20.8 25.2 21 SBI Healthcare Opportunities Fund Growth ₹395.721
↓ -2.20 ₹3,522 500 -3.2 1.1 14.5 22.4 25.1 42.2 TATA Digital India Fund Growth ₹49.5338
↓ -0.13 ₹12,465 150 -4 -2.6 11.6 11.1 25.1 30.6 L&T Emerging Businesses Fund Growth ₹71
↑ 1.44 ₹17,386 500 -15.2 -17 -2.1 17.5 25 28.5 ICICI Prudential Value Discovery Fund Growth ₹426.61
↓ -0.20 ₹48,400 100 -2.5 -5.6 9.3 19.1 25 20 Note: Returns up to 1 year are on absolute basis & more than 1 year are on CAGR basis. as on 19 Feb 25 ఆస్తులు >= 200 కోట్లు & క్రమబద్ధీకరించబడింది5 సంవత్సరాల రిటర్న్.1. Nippon India Small Cap Fund
CAGR/Annualized return of 20.4% since its launch. Ranked 6 in Small Cap category. Return for 2024 was 26.1% , 2023 was 48.9% and 2022 was 6.5% . Nippon India Small Cap Fund
Growth Launch Date 16 Sep 10 NAV (19 Feb 25) ₹145.932 ↑ 2.00 (1.39 %) Net Assets (Cr) ₹57,010 on 31 Jan 25 Category Equity - Small Cap AMC Nippon Life Asset Management Ltd. Rating ☆☆☆☆ Risk Moderately High Expense Ratio 1.55 Sharpe Ratio 0.26 Information Ratio 0.78 Alpha Ratio 3.88 Min Investment 5,000 Min SIP Investment 100 Exit Load 0-1 Years (1%),1 Years and above(NIL) Growth of 10,000 investment over the years.
Date Value 31 Jan 20 ₹10,000 31 Jan 21 ₹12,137 31 Jan 22 ₹20,946 31 Jan 23 ₹22,218 31 Jan 24 ₹34,818 31 Jan 25 ₹38,435 Returns for Nippon India Small Cap Fund
absolute basis & more than 1 year are on CAGR (Compound Annual Growth Rate) basis. as on 19 Feb 25 Duration Returns 1 Month -11.9% 3 Month -13.7% 6 Month -16.7% 1 Year 1.5% 3 Year 20.9% 5 Year 28.4% 10 Year 15 Year Since launch 20.4% Historical performance (Yearly) on absolute basis
Year Returns 2024 26.1% 2023 48.9% 2022 6.5% 2021 74.3% 2020 29.2% 2019 -2.5% 2018 -16.7% 2017 63% 2016 5.6% 2015 15.1% Fund Manager information for Nippon India Small Cap Fund
Name Since Tenure Samir Rachh 2 Jan 17 8.09 Yr. Kinjal Desai 25 May 18 6.7 Yr. Data below for Nippon India Small Cap Fund as on 31 Jan 25
Equity Sector Allocation
Sector Value Industrials 25.71% Financial Services 12.92% Consumer Cyclical 12.68% Basic Materials 11.58% Technology 10.44% Health Care 7.75% Consumer Defensive 7.4% Utility 1.95% Communication Services 1.87% Energy 1.59% Real Estate 0.6% Asset Allocation
Asset Class Value Cash 5.02% Equity 94.98% Top Securities Holdings / Portfolio
Name Holding Value Quantity HDFC Bank Ltd (Financial Services)
Equity, Since 30 Apr 22 | HDFCBANK2% ₹1,179 Cr 6,650,000 Multi Commodity Exchange of India Ltd (Financial Services)
Equity, Since 28 Feb 21 | MCX2% ₹1,154 Cr 1,851,010 Apar Industries Ltd (Industrials)
Equity, Since 31 Mar 17 | APARINDS1% ₹928 Cr 899,271 Kirloskar Brothers Ltd (Industrials)
Equity, Since 31 Oct 12 | KIRLOSBROS1% ₹923 Cr 4,472,130 Dixon Technologies (India) Ltd (Technology)
Equity, Since 30 Nov 18 | DIXON1% ₹919 Cr 512,355 Tube Investments of India Ltd Ordinary Shares (Industrials)
Equity, Since 30 Apr 18 | TIINDIA1% ₹894 Cr 2,499,222 ELANTAS Beck India Ltd (Basic Materials)
Equity, Since 28 Feb 13 | 5001231% ₹785 Cr 614,625 State Bank of India (Financial Services)
Equity, Since 31 Oct 19 | SBIN1% ₹723 Cr 9,100,000 Central Depository Services (India) Ltd (Financial Services)
Equity, Since 31 Dec 18 | CDSL1% ₹709 Cr 4,029,718 Karur Vysya Bank Ltd (Financial Services)
Equity, Since 28 Feb 17 | 5900031% ₹690 Cr 31,784,062 2. ICICI Prudential Infrastructure Fund
CAGR/Annualized return of 15.6% since its launch. Ranked 27 in Sectoral category. Return for 2024 was 27.4% , 2023 was 44.6% and 2022 was 28.8% . ICICI Prudential Infrastructure Fund
Growth Launch Date 31 Aug 05 NAV (19 Feb 25) ₹169.45 ↑ 1.79 (1.07 %) Net Assets (Cr) ₹7,435 on 31 Jan 25 Category Equity - Sectoral AMC ICICI Prudential Asset Management Company Limited Rating ☆☆☆ Risk High Expense Ratio 2.22 Sharpe Ratio 0.64 Information Ratio 0 Alpha Ratio 0 Min Investment 5,000 Min SIP Investment 100 Exit Load 0-1 Years (1%),1 Years and above(NIL) Growth of 10,000 investment over the years.
Date Value 31 Jan 20 ₹10,000 31 Jan 21 ₹10,385 31 Jan 22 ₹16,659 31 Jan 23 ₹19,888 31 Jan 24 ₹30,973 31 Jan 25 ₹35,717 Returns for ICICI Prudential Infrastructure Fund
absolute basis & more than 1 year are on CAGR (Compound Annual Growth Rate) basis. as on 19 Feb 25 Duration Returns 1 Month -5.9% 3 Month -7.4% 6 Month -10.6% 1 Year 4.9% 3 Year 27.5% 5 Year 28.1% 10 Year 15 Year Since launch 15.6% Historical performance (Yearly) on absolute basis
Year Returns 2024 27.4% 2023 44.6% 2022 28.8% 2021 50.1% 2020 3.6% 2019 2.6% 2018 -14% 2017 40.8% 2016 2% 2015 -3.4% Fund Manager information for ICICI Prudential Infrastructure Fund
Name Since Tenure Ihab Dalwai 3 Jun 17 7.67 Yr. Sharmila D’mello 30 Jun 22 2.59 Yr. Data below for ICICI Prudential Infrastructure Fund as on 31 Jan 25
Equity Sector Allocation
Sector Value Industrials 36.99% Basic Materials 18.93% Financial Services 16.99% Utility 10.73% Energy 7.04% Communication Services 1.26% Consumer Cyclical 1.11% Real Estate 0.75% Asset Allocation
Asset Class Value Cash 5.59% Equity 93.78% Debt 0.63% Top Securities Holdings / Portfolio
Name Holding Value Quantity Larsen & Toubro Ltd (Industrials)
Equity, Since 30 Nov 09 | LT9% ₹615 Cr 1,704,683 NTPC Ltd (Utilities)
Equity, Since 29 Feb 16 | 5325554% ₹257 Cr 7,710,775 ICICI Bank Ltd (Financial Services)
Equity, Since 31 Dec 16 | ICICIBANK4% ₹255 Cr 1,990,000 Shree Cement Ltd (Basic Materials)
Equity, Since 30 Apr 24 | 5003874% ₹246 Cr 95,657 JM Financial Ltd (Financial Services)
Equity, Since 31 Oct 21 | JMFINANCIL3% ₹231 Cr 17,763,241
↑ 400,000 Adani Ports & Special Economic Zone Ltd (Industrials)
Equity, Since 31 May 24 | ADANIPORTS3% ₹214 Cr 1,740,091 InterGlobe Aviation Ltd (Industrials)
Equity, Since 28 Feb 23 | INDIGO3% ₹208 Cr 457,106
↓ -30,684 NCC Ltd (Industrials)
Equity, Since 31 Aug 21 | NCC3% ₹207 Cr 7,547,700 Kalpataru Projects International Ltd (Industrials)
Equity, Since 30 Sep 06 | KPIL3% ₹202 Cr 1,558,301 Reliance Industries Ltd (Energy)
Equity, Since 31 Jul 23 | RELIANCE3% ₹196 Cr 1,609,486 3. SBI Contra Fund
CAGR/Annualized return of 14.9% since its launch. Ranked 48 in Contra category. Return for 2024 was 18.8% , 2023 was 38.2% and 2022 was 12.8% . SBI Contra Fund
Growth Launch Date 6 May 05 NAV (18 Feb 25) ₹352.11 ↓ -0.95 (-0.27 %) Net Assets (Cr) ₹41,634 on 31 Jan 25 Category Equity - Contra AMC SBI Funds Management Private Limited Rating ☆☆☆ Risk Moderately High Expense Ratio 1.7 Sharpe Ratio 0.39 Information Ratio 1.66 Alpha Ratio 0.8 Min Investment 5,000 Min SIP Investment 500 Exit Load 0-1 Years (1%),1 Years and above(NIL) Growth of 10,000 investment over the years.
Date Value 31 Jan 20 ₹10,000 31 Jan 21 ₹13,142 31 Jan 22 ₹19,202 31 Jan 23 ₹21,302 31 Jan 24 ₹30,908 31 Jan 25 ₹34,481 Returns for SBI Contra Fund
absolute basis & more than 1 year are on CAGR (Compound Annual Growth Rate) basis. as on 19 Feb 25 Duration Returns 1 Month -4.1% 3 Month -4.9% 6 Month -9.5% 1 Year 4.5% 3 Year 21.3% 5 Year 27.7% 10 Year 15 Year Since launch 14.9% Historical performance (Yearly) on absolute basis
Year Returns 2024 18.8% 2023 38.2% 2022 12.8% 2021 49.9% 2020 30.6% 2019 -1% 2018 -14.3% 2017 40.2% 2016 2.4% 2015 -0.1% Fund Manager information for SBI Contra Fund
Name Since Tenure Dinesh Balachandran 7 May 18 6.75 Yr. Pradeep Kesavan 1 Dec 23 1.17 Yr. Data below for SBI Contra Fund as on 31 Jan 25
Equity Sector Allocation
Sector Value Financial Services 19.47% Technology 9.03% Basic Materials 8.12% Energy 7.33% Health Care 7.33% Industrials 6.55% Consumer Cyclical 6.42% Utility 5.94% Consumer Defensive 4.71% Communication Services 3.97% Real Estate 0.57% Asset Allocation
Asset Class Value Cash 19.44% Equity 79.44% Debt 1.12% Top Securities Holdings / Portfolio
Name Holding Value Quantity HDFC Bank Ltd (Financial Services)
Equity, Since 31 Aug 16 | HDFCBANK5% ₹2,256 Cr 12,723,129 Reliance Industries Ltd (Energy)
Equity, Since 31 Mar 23 | RELIANCE4% ₹1,498 Cr 12,328,250 GAIL (India) Ltd (Utilities)
Equity, Since 28 Feb 21 | 5321552% ₹993 Cr 51,993,788 Tech Mahindra Ltd (Technology)
Equity, Since 31 Mar 22 | 5327552% ₹987 Cr 5,786,409 Kotak Mahindra Bank Ltd (Financial Services)
Equity, Since 31 Mar 24 | KOTAKBANK2% ₹916 Cr 5,128,168 Torrent Power Ltd (Utilities)
Equity, Since 31 Oct 21 | 5327792% ₹916 Cr 6,163,300
↑ 2,322,023 State Bank of India (Financial Services)
Equity, Since 31 Dec 10 | SBIN2% ₹815 Cr 10,254,269 ITC Ltd (Consumer Defensive)
Equity, Since 31 Jul 20 | ITC2% ₹811 Cr 16,766,741 Oil & Natural Gas Corp Ltd (Energy)
Equity, Since 31 Dec 22 | 5003122% ₹763 Cr 31,885,412 Whirlpool of India Ltd (Consumer Cyclical)
Equity, Since 29 Feb 24 | 5002382% ₹743 Cr 4,040,000 4. ICICI Prudential Technology Fund
CAGR/Annualized return of 12.8% since its launch. Ranked 37 in Sectoral category. Return for 2024 was 25.4% , 2023 was 27.5% and 2022 was -23.2% . ICICI Prudential Technology Fund
Growth Launch Date 3 Mar 00 NAV (18 Feb 25) ₹203.46 ↑ 0.78 (0.38 %) Net Assets (Cr) ₹14,101 on 31 Jan 25 Category Equity - Sectoral AMC ICICI Prudential Asset Management Company Limited Rating ☆☆ Risk High Expense Ratio 1.96 Sharpe Ratio 0.63 Information Ratio 0.21 Alpha Ratio 0.86 Min Investment 5,000 Min SIP Investment 100 Exit Load 0-1 Years (1%),1 Years and above(NIL) Growth of 10,000 investment over the years.
Date Value 31 Jan 20 ₹10,000 31 Jan 21 ₹16,325 31 Jan 22 ₹25,971 31 Jan 23 ₹22,408 31 Jan 24 ₹29,166 31 Jan 25 ₹34,454 Returns for ICICI Prudential Technology Fund
absolute basis & more than 1 year are on CAGR (Compound Annual Growth Rate) basis. as on 19 Feb 25 Duration Returns 1 Month -2.8% 3 Month -0.3% 6 Month -0.2% 1 Year 11.7% 3 Year 9.9% 5 Year 26.8% 10 Year 15 Year Since launch 12.8% Historical performance (Yearly) on absolute basis
Year Returns 2024 25.4% 2023 27.5% 2022 -23.2% 2021 75.7% 2020 70.6% 2019 2.3% 2018 19.1% 2017 19.8% 2016 -4% 2015 3.9% Fund Manager information for ICICI Prudential Technology Fund
Name Since Tenure Vaibhav Dusad 2 May 20 4.76 Yr. Sharmila D’mello 30 Jun 22 2.59 Yr. Data below for ICICI Prudential Technology Fund as on 31 Jan 25
Equity Sector Allocation
Sector Value Technology 71.4% Communication Services 16.22% Consumer Cyclical 4.97% Industrials 2.81% Health Care 0.69% Financial Services 0.5% Consumer Defensive 0.2% Asset Allocation
Asset Class Value Cash 2.98% Equity 97.02% Top Securities Holdings / Portfolio
Name Holding Value Quantity Infosys Ltd (Technology)
Equity, Since 30 Apr 08 | INFY22% ₹3,152 Cr 16,768,086 Tata Consultancy Services Ltd (Technology)
Equity, Since 30 Sep 19 | TCS12% ₹1,742 Cr 4,254,724
↑ 270,000 Bharti Airtel Ltd (Communication Services)
Equity, Since 31 May 20 | BHARTIARTL8% ₹1,167 Cr 7,348,806
↑ 200,000 LTIMindtree Ltd (Technology)
Equity, Since 31 Jul 16 | LTIM6% ₹847 Cr 1,515,919
↑ 207,126 HCL Technologies Ltd (Technology)
Equity, Since 30 Sep 20 | HCLTECH5% ₹721 Cr 3,758,139
↑ 108,689 Tech Mahindra Ltd (Technology)
Equity, Since 31 Oct 16 | 5327555% ₹713 Cr 4,176,250
↑ 391,032 Bharti Airtel Ltd (Partly Paid Rs.1.25) (Communication Services)
Equity, Since 31 Oct 21 | 8901574% ₹547 Cr 4,645,340 Wipro Ltd (Technology)
Equity, Since 30 Sep 19 | 5076853% ₹452 Cr 14,965,117
↑ 242,399 Zomato Ltd (Consumer Cyclical)
Equity, Since 31 Aug 22 | 5433203% ₹402 Cr 14,473,026
↓ -1,085,383 Persistent Systems Ltd (Technology)
Equity, Since 31 May 20 | PERSISTENT2% ₹344 Cr 532,687
↓ -17,707 5. Motilal Oswal Midcap 30 Fund
CAGR/Annualized return of 22.4% since its launch. Ranked 27 in Mid Cap category. Return for 2024 was 57.1% , 2023 was 41.7% and 2022 was 10.7% . Motilal Oswal Midcap 30 Fund
Growth Launch Date 24 Feb 14 NAV (19 Feb 25) ₹92.5028 ↑ 0.71 (0.77 %) Net Assets (Cr) ₹24,488 on 31 Jan 25 Category Equity - Mid Cap AMC Motilal Oswal Asset Management Co. Ltd Rating ☆☆☆ Risk Moderately High Expense Ratio 0.66 Sharpe Ratio 0.93 Information Ratio 0.68 Alpha Ratio 15.2 Min Investment 5,000 Min SIP Investment 500 Exit Load 0-1 Years (1%),1 Years and above(NIL) Growth of 10,000 investment over the years.
Date Value 31 Jan 20 ₹10,000 31 Jan 21 ₹10,284 31 Jan 22 ₹16,054 31 Jan 23 ₹17,654 31 Jan 24 ₹26,102 31 Jan 25 ₹33,874 Returns for Motilal Oswal Midcap 30 Fund
absolute basis & more than 1 year are on CAGR (Compound Annual Growth Rate) basis. as on 19 Feb 25 Duration Returns 1 Month -8.2% 3 Month -11.2% 6 Month -7.1% 1 Year 21.6% 3 Year 27.7% 5 Year 26.1% 10 Year 15 Year Since launch 22.4% Historical performance (Yearly) on absolute basis
Year Returns 2024 57.1% 2023 41.7% 2022 10.7% 2021 55.8% 2020 9.3% 2019 9.7% 2018 -12.7% 2017 30.8% 2016 5.2% 2015 16.5% Fund Manager information for Motilal Oswal Midcap 30 Fund
Name Since Tenure Ajay Khandelwal 1 Oct 24 0.34 Yr. Niket Shah 1 Jul 20 4.59 Yr. Rakesh Shetty 22 Nov 22 2.2 Yr. Sunil Sawant 1 Jul 24 0.59 Yr. Data below for Motilal Oswal Midcap 30 Fund as on 31 Jan 25
Equity Sector Allocation
Sector Value Technology 29.21% Consumer Cyclical 25.34% Industrials 19.64% Financial Services 5.14% Health Care 4.07% Communication Services 2.9% Utility 2.05% Real Estate 1.98% Basic Materials 0.47% Asset Allocation
Asset Class Value Cash 9.2% Equity 90.8% Top Securities Holdings / Portfolio
Name Holding Value Quantity Coforge Ltd (Technology)
Equity, Since 31 Mar 23 | COFORGE10% ₹2,604 Cr 2,695,000
↑ 95,000 Kalyan Jewellers India Ltd (Consumer Cyclical)
Equity, Since 29 Feb 24 | KALYANKJIL10% ₹2,548 Cr 33,250,000
↑ 2,750,000 Polycab India Ltd (Industrials)
Equity, Since 30 Sep 23 | POLYCAB9% ₹2,364 Cr 3,250,000
↑ 124,982 Trent Ltd (Consumer Cyclical)
Equity, Since 30 Nov 24 | 5002518% ₹2,137 Cr 3,000,000
↑ 1,250,400 Persistent Systems Ltd (Technology)
Equity, Since 31 Jan 23 | PERSISTENT8% ₹2,099 Cr 3,250,000
↑ 250,000 Jio Financial Services Ltd (Financial Services)
Equity, Since 31 Aug 23 | JIOFIN5% ₹1,359 Cr 45,500,000
↑ 3,000,000 Mahindra & Mahindra Ltd (Consumer Cyclical)
Equity, Since 31 Oct 24 | M&M4% ₹1,052 Cr 3,500,000
↓ -1,250,000 Oracle Financial Services Software Ltd (Technology)
Equity, Since 31 Dec 24 | OFSS4% ₹1,019 Cr 796,967
↑ 796,967 One97 Communications Ltd (Technology)
Equity, Since 30 Sep 24 | 5433964% ₹1,018 Cr 10,000,000
↑ 2,500,000 Voltas Ltd (Industrials)
Equity, Since 31 Oct 17 | VOLTAS3% ₹895 Cr 4,999,745 6. ICICI Prudential Dividend Yield Equity Fund
CAGR/Annualized return of 15.6% since its launch. Ranked 38 in Dividend Yield category. Return for 2024 was 21% , 2023 was 38.8% and 2022 was 9.2% . ICICI Prudential Dividend Yield Equity Fund
Growth Launch Date 16 May 14 NAV (19 Feb 25) ₹47.56 ↑ 0.10 (0.21 %) Net Assets (Cr) ₹4,835 on 31 Jan 25 Category Equity - Dividend Yield AMC ICICI Prudential Asset Management Company Limited Rating ☆☆☆ Risk Moderately High Expense Ratio 2.41 Sharpe Ratio 0.65 Information Ratio 1.45 Alpha Ratio 4.75 Min Investment 5,000 Min SIP Investment 100 Exit Load 0-1 Years (1%),1 Years and above(NIL) Growth of 10,000 investment over the years.
Date Value 31 Jan 20 ₹10,000 31 Jan 21 ₹11,169 31 Jan 22 ₹17,140 31 Jan 23 ₹18,385 31 Jan 24 ₹26,656 31 Jan 25 ₹30,654 Returns for ICICI Prudential Dividend Yield Equity Fund
absolute basis & more than 1 year are on CAGR (Compound Annual Growth Rate) basis. as on 19 Feb 25 Duration Returns 1 Month -2% 3 Month -3.1% 6 Month -7.8% 1 Year 7.1% 3 Year 20.8% 5 Year 25.2% 10 Year 15 Year Since launch 15.6% Historical performance (Yearly) on absolute basis
Year Returns 2024 21% 2023 38.8% 2022 9.2% 2021 47.1% 2020 14.1% 2019 -2.9% 2018 -11.9% 2017 40.7% 2016 9.7% 2015 -5.2% Fund Manager information for ICICI Prudential Dividend Yield Equity Fund
Name Since Tenure Mittul Kalawadia 29 Jan 18 7.01 Yr. Sharmila D’mello 31 Jul 22 2.51 Yr. Data below for ICICI Prudential Dividend Yield Equity Fund as on 31 Jan 25
Equity Sector Allocation
Sector Value Financial Services 29.96% Consumer Cyclical 10.06% Energy 9.03% Consumer Defensive 8% Utility 7.35% Health Care 7.02% Industrials 6.57% Basic Materials 5.59% Technology 5% Communication Services 4.73% Real Estate 1.54% Asset Allocation
Asset Class Value Cash 3.06% Equity 94.85% Debt 1.77% Top Securities Holdings / Portfolio
Name Holding Value Quantity HDFC Bank Ltd (Financial Services)
Equity, Since 31 Jan 22 | HDFCBANK8% ₹394 Cr 2,222,624 ICICI Bank Ltd (Financial Services)
Equity, Since 30 Apr 21 | ICICIBANK8% ₹372 Cr 2,905,184 Sun Pharmaceuticals Industries Ltd (Healthcare)
Equity, Since 30 Apr 21 | SUNPHARMA7% ₹335 Cr 1,774,051 Maruti Suzuki India Ltd (Consumer Cyclical)
Equity, Since 31 Jan 22 | MARUTI7% ₹311 Cr 286,610 NTPC Ltd (Utilities)
Equity, Since 31 Oct 16 | 5325556% ₹273 Cr 8,201,022 Bharti Airtel Ltd (Communication Services)
Equity, Since 31 Jan 20 | BHARTIARTL4% ₹208 Cr 1,312,548
↑ 250,000 Oil & Natural Gas Corp Ltd (Energy)
Equity, Since 31 Dec 21 | 5003124% ₹194 Cr 8,094,802 Axis Bank Ltd (Financial Services)
Equity, Since 30 Apr 21 | 5322154% ₹173 Cr 1,621,099 Larsen & Toubro Ltd (Industrials)
Equity, Since 31 Aug 21 | LT3% ₹154 Cr 428,013 Britannia Industries Ltd (Consumer Defensive)
Equity, Since 31 Jul 23 | 5008252% ₹105 Cr 219,613 7. SBI Healthcare Opportunities Fund
CAGR/Annualized return of 15.4% since its launch. Ranked 34 in Sectoral category. Return for 2024 was 42.2% , 2023 was 38.2% and 2022 was -6% . SBI Healthcare Opportunities Fund
Growth Launch Date 31 Dec 04 NAV (18 Feb 25) ₹395.721 ↓ -2.20 (-0.55 %) Net Assets (Cr) ₹3,522 on 31 Jan 25 Category Equity - Sectoral AMC SBI Funds Management Private Limited Rating ☆☆ Risk High Expense Ratio 2.09 Sharpe Ratio 1.36 Information Ratio 0.67 Alpha Ratio 4.66 Min Investment 5,000 Min SIP Investment 500 Exit Load 0-15 Days (0.5%),15 Days and above(NIL) Growth of 10,000 investment over the years.
Date Value 31 Jan 20 ₹10,000 31 Jan 21 ₹15,535 31 Jan 22 ₹17,594 31 Jan 23 ₹17,709 31 Jan 24 ₹26,160 31 Jan 25 ₹33,176 Returns for SBI Healthcare Opportunities Fund
absolute basis & more than 1 year are on CAGR (Compound Annual Growth Rate) basis. as on 19 Feb 25 Duration Returns 1 Month -4.9% 3 Month -3.2% 6 Month 1.1% 1 Year 14.5% 3 Year 22.4% 5 Year 25.1% 10 Year 15 Year Since launch 15.4% Historical performance (Yearly) on absolute basis
Year Returns 2024 42.2% 2023 38.2% 2022 -6% 2021 20.1% 2020 65.8% 2019 -0.5% 2018 -9.9% 2017 2.1% 2016 -14% 2015 27.1% Fund Manager information for SBI Healthcare Opportunities Fund
Name Since Tenure Tanmaya Desai 1 Jun 11 13.68 Yr. Pradeep Kesavan 31 Dec 23 1.09 Yr. Data below for SBI Healthcare Opportunities Fund as on 31 Jan 25
Equity Sector Allocation
Sector Value Health Care 90.04% Basic Materials 6.53% Asset Allocation
Asset Class Value Cash 3.35% Equity 96.57% Debt 0.08% Top Securities Holdings / Portfolio
Name Holding Value Quantity Sun Pharmaceuticals Industries Ltd (Healthcare)
Equity, Since 31 Dec 17 | SUNPHARMA13% ₹472 Cr 2,500,000 Max Healthcare Institute Ltd Ordinary Shares (Healthcare)
Equity, Since 31 Mar 21 | MAXHEALTH6% ₹226 Cr 2,000,000 Divi's Laboratories Ltd (Healthcare)
Equity, Since 31 Mar 12 | DIVISLAB6% ₹220 Cr 360,000 Cipla Ltd (Healthcare)
Equity, Since 31 Aug 16 | 5000876% ₹214 Cr 1,400,000
↑ 120,000 Lupin Ltd (Healthcare)
Equity, Since 31 Aug 23 | 5002575% ₹188 Cr 800,000 Lonza Group Ltd ADR (Healthcare)
Equity, Since 31 Jan 24 | LZAGY4% ₹151 Cr 300,000 Mankind Pharma Ltd (Healthcare)
Equity, Since 30 Apr 23 | MANKIND4% ₹151 Cr 523,016
↑ 123,016 Poly Medicure Ltd (Healthcare)
Equity, Since 31 Aug 24 | POLYMED4% ₹131 Cr 500,000 Krishna Institute of Medical Sciences Ltd (Healthcare)
Equity, Since 30 Nov 22 | 5433083% ₹126 Cr 2,100,000
↓ -100,000 Jupiter Life Line Hospitals Ltd (Healthcare)
Equity, Since 31 Aug 23 | JLHL3% ₹125 Cr 800,000
↓ -32,871 8. TATA Digital India Fund
CAGR/Annualized return of 19.1% since its launch. Return for 2024 was 30.6% , 2023 was 31.9% and 2022 was -23.3% . TATA Digital India Fund
Growth Launch Date 28 Dec 15 NAV (19 Feb 25) ₹49.5338 ↓ -0.13 (-0.26 %) Net Assets (Cr) ₹12,465 on 31 Jan 25 Category Equity - Sectoral AMC Tata Asset Management Limited Rating Risk High Expense Ratio 0 Sharpe Ratio 0.68 Information Ratio 0.44 Alpha Ratio 2.22 Min Investment 5,000 Min SIP Investment 150 Exit Load 0-3 Months (0.25%),3 Months and above(NIL) Growth of 10,000 investment over the years.
Date Value 31 Jan 20 ₹10,000 31 Jan 21 ₹15,254 31 Jan 22 ₹23,775 31 Jan 23 ₹20,584 31 Jan 24 ₹27,482 31 Jan 25 ₹32,904 Returns for TATA Digital India Fund
absolute basis & more than 1 year are on CAGR (Compound Annual Growth Rate) basis. as on 19 Feb 25 Duration Returns 1 Month -4.9% 3 Month -4% 6 Month -2.6% 1 Year 11.6% 3 Year 11.1% 5 Year 25.1% 10 Year 15 Year Since launch 19.1% Historical performance (Yearly) on absolute basis
Year Returns 2024 30.6% 2023 31.9% 2022 -23.3% 2021 74.4% 2020 54.8% 2019 7.5% 2018 24.9% 2017 19.6% 2016 -6% 2015 Fund Manager information for TATA Digital India Fund
Name Since Tenure Meeta Shetty 9 Mar 21 3.9 Yr. Kapil Malhotra 19 Dec 23 1.12 Yr. Data below for TATA Digital India Fund as on 31 Jan 25
Equity Sector Allocation
Sector Value Technology 74.43% Consumer Cyclical 7.89% Industrials 4.94% Communication Services 4.21% Financial Services 3.86% Asset Allocation
Asset Class Value Cash 4.67% Equity 95.33% Top Securities Holdings / Portfolio
Name Holding Value Quantity Infosys Ltd (Technology)
Equity, Since 31 Jan 16 | INFY17% ₹2,168 Cr 11,530,857 Tata Consultancy Services Ltd (Technology)
Equity, Since 31 Jan 16 | TCS11% ₹1,485 Cr 3,626,873 Tech Mahindra Ltd (Technology)
Equity, Since 30 Apr 16 | 5327559% ₹1,219 Cr 7,145,933 Wipro Ltd (Technology)
Equity, Since 31 Jul 18 | 5076858% ₹990 Cr 32,787,324 HCL Technologies Ltd (Technology)
Equity, Since 31 Jan 16 | HCLTECH7% ₹956 Cr 4,983,886 Zomato Ltd (Consumer Cyclical)
Equity, Since 31 Oct 22 | 5433206% ₹808 Cr 29,067,000 LTIMindtree Ltd (Technology)
Equity, Since 28 Feb 21 | LTIM4% ₹552 Cr 988,062 Persistent Systems Ltd (Technology)
Equity, Since 31 Jan 16 | PERSISTENT4% ₹490 Cr 759,192 Firstsource Solutions Ltd (Technology)
Equity, Since 30 Nov 21 | FSL3% ₹381 Cr 10,123,112 Sonata Software Ltd (Technology)
Equity, Since 30 Jun 23 | SONATSOFTW2% ₹307 Cr 5,125,514 9. L&T Emerging Businesses Fund
CAGR/Annualized return of 19.9% since its launch. Ranked 2 in Small Cap category. Return for 2024 was 28.5% , 2023 was 46.1% and 2022 was 1% . L&T Emerging Businesses Fund
Growth Launch Date 12 May 14 NAV (19 Feb 25) ₹71 ↑ 1.44 (2.08 %) Net Assets (Cr) ₹17,386 on 31 Dec 24 Category Equity - Small Cap AMC L&T Investment Management Ltd Rating ☆☆☆☆☆ Risk High Expense Ratio 1.73 Sharpe Ratio 1.32 Information Ratio 0.19 Alpha Ratio 3.87 Min Investment 5,000 Min SIP Investment 500 Exit Load 0-1 Years (1%),1 Years and above(NIL) Growth of 10,000 investment over the years.
Date Value 31 Jan 20 ₹10,000 31 Jan 21 ₹11,113 31 Jan 22 ₹19,683 31 Jan 23 ₹19,960 31 Jan 24 ₹30,763 31 Jan 25 ₹33,089 Returns for L&T Emerging Businesses Fund
absolute basis & more than 1 year are on CAGR (Compound Annual Growth Rate) basis. as on 19 Feb 25 Duration Returns 1 Month -14.3% 3 Month -15.2% 6 Month -17% 1 Year -2.1% 3 Year 17.5% 5 Year 25% 10 Year 15 Year Since launch 19.9% Historical performance (Yearly) on absolute basis
Year Returns 2024 28.5% 2023 46.1% 2022 1% 2021 77.4% 2020 15.5% 2019 -8.1% 2018 -13.7% 2017 66.5% 2016 10.2% 2015 12.3% Fund Manager information for L&T Emerging Businesses Fund
Name Since Tenure Venugopal Manghat 17 Dec 19 5.13 Yr. Cheenu Gupta 1 Oct 23 1.34 Yr. Sonal Gupta 1 Oct 23 1.34 Yr. Data below for L&T Emerging Businesses Fund as on 31 Dec 24
Equity Sector Allocation
Sector Value Industrials 30.48% Consumer Cyclical 16.51% Financial Services 14.26% Technology 10.64% Basic Materials 10.36% Real Estate 5.3% Health Care 4.2% Consumer Defensive 3.21% Energy 1.5% Asset Allocation
Asset Class Value Cash 1.16% Equity 98.84% Top Securities Holdings / Portfolio
Name Holding Value Quantity Apar Industries Ltd (Industrials)
Equity, Since 31 Mar 17 | APARINDS3% ₹470 Cr 455,400 BSE Ltd (Financial Services)
Equity, Since 29 Feb 24 | BSE3% ₹454 Cr 852,600
↓ -31,900 Dixon Technologies (India) Ltd (Technology)
Equity, Since 31 Jul 20 | DIXON2% ₹427 Cr 238,273 Neuland Laboratories Limited
Equity, Since 31 Jan 24 | -2% ₹410 Cr 299,000
↑ 17,978 Aditya Birla Real Estate Ltd (Basic Materials)
Equity, Since 30 Sep 22 | 5000402% ₹403 Cr 1,607,279 Techno Electric & Engineering Co Ltd (Industrials)
Equity, Since 31 Jan 19 | TECHNOE2% ₹388 Cr 2,473,042 Kirloskar Pneumatic Co Ltd (Industrials)
Equity, Since 31 Aug 22 | 5052832% ₹376 Cr 2,444,924 KFin Technologies Ltd (Technology)
Equity, Since 31 Aug 24 | KFINTECH2% ₹374 Cr 2,429,736
↑ 139,336 Trent Ltd (Consumer Cyclical)
Equity, Since 31 Jan 17 | 5002512% ₹338 Cr 474,400
↓ -63,150 Time Technoplast Ltd (Consumer Cyclical)
Equity, Since 31 Jan 24 | TIMETECHNO2% ₹336 Cr 6,810,500
↑ 656,671 10. ICICI Prudential Value Discovery Fund
CAGR/Annualized return of 20.1% since its launch. Ranked 62 in Value category. Return for 2024 was 20% , 2023 was 31.4% and 2022 was 15% . ICICI Prudential Value Discovery Fund
Growth Launch Date 16 Aug 04 NAV (18 Feb 25) ₹426.61 ↓ -0.20 (-0.05 %) Net Assets (Cr) ₹48,400 on 31 Jan 25 Category Equity - Value AMC ICICI Prudential Asset Management Company Limited Rating ☆☆ Risk Moderately High Expense Ratio 1.76 Sharpe Ratio 0.67 Information Ratio 1.05 Alpha Ratio 4.56 Min Investment 1,000 Min SIP Investment 100 Exit Load 0-12 Months (1%),12 Months and above(NIL) Growth of 10,000 investment over the years.
Date Value 31 Jan 20 ₹10,000 31 Jan 21 ₹12,328 31 Jan 22 ₹17,769 31 Jan 23 ₹19,482 31 Jan 24 ₹26,634 31 Jan 25 ₹30,521 Returns for ICICI Prudential Value Discovery Fund
absolute basis & more than 1 year are on CAGR (Compound Annual Growth Rate) basis. as on 19 Feb 25 Duration Returns 1 Month -1.9% 3 Month -2.5% 6 Month -5.6% 1 Year 9.3% 3 Year 19.1% 5 Year 25% 10 Year 15 Year Since launch 20.1% Historical performance (Yearly) on absolute basis
Year Returns 2024 20% 2023 31.4% 2022 15% 2021 38.5% 2020 22.9% 2019 0.6% 2018 -4.2% 2017 23.8% 2016 4.6% 2015 5.4% Fund Manager information for ICICI Prudential Value Discovery Fund
Name Since Tenure Sankaran Naren 18 Jan 21 4.04 Yr. Dharmesh Kakkad 18 Jan 21 4.04 Yr. Sharmila D’mello 30 Jun 22 2.59 Yr. Masoomi Jhurmarvala 4 Nov 24 0.24 Yr. Data below for ICICI Prudential Value Discovery Fund as on 31 Jan 25
Equity Sector Allocation
Sector Value Financial Services 30.36% Health Care 11.55% Energy 9.96% Consumer Cyclical 8.38% Consumer Defensive 8.1% Technology 6.42% Communication Services 4.95% Basic Materials 4.51% Utility 3.37% Industrials 2.52% Asset Allocation
Asset Class Value Cash 9.89% Equity 90.11% Top Securities Holdings / Portfolio
Name Holding Value Quantity HDFC Bank Ltd (Financial Services)
Equity, Since 30 Jun 21 | HDFCBANK8% ₹3,945 Cr 22,254,621 ICICI Bank Ltd (Financial Services)
Equity, Since 28 Feb 21 | ICICIBANK7% ₹3,264 Cr 25,469,866 Reliance Industries Ltd (Energy)
Equity, Since 31 Jan 23 | RELIANCE6% ₹3,030 Cr 24,927,019
↑ 500,000 Infosys Ltd (Technology)
Equity, Since 30 Sep 14 | INFY6% ₹2,662 Cr 14,161,378 Sun Pharmaceuticals Industries Ltd (Healthcare)
Equity, Since 31 May 16 | SUNPHARMA5% ₹2,376 Cr 12,594,544
↓ -821,800 Axis Bank Ltd (Financial Services)
Equity, Since 31 Aug 20 | 5322154% ₹1,812 Cr 17,021,712
↑ 1,557,000 Maruti Suzuki India Ltd (Consumer Cyclical)
Equity, Since 31 Dec 22 | MARUTI4% ₹1,757 Cr 1,618,016 State Bank of India (Financial Services)
Equity, Since 31 Jan 21 | SBIN3% ₹1,540 Cr 19,369,000 Hindustan Unilever Ltd (Consumer Defensive)
Equity, Since 31 Aug 23 | HINDUNILVR3% ₹1,502 Cr 6,455,777
↑ 946,147 Bharti Airtel Ltd (Communication Services)
Equity, Since 30 Nov 17 | BHARTIARTL3% ₹1,493 Cr 9,406,063
↑ 156,298
ఉత్తమ SIP పెట్టుబడిని ఎలా ఎంచుకోవాలి?
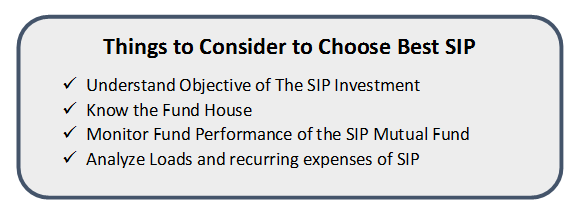
SIP ద్వారా పెట్టుబడి పెట్టడానికి మిమ్మల్ని అనుమతించే వివిధ మ్యూచువల్ ఫండ్లు ఉన్నాయి. కానీ ప్రధాన సమస్య ఎంపికఉత్తమ మ్యూచువల్ ఫండ్స్ SIP కోసం. ఉత్తమ మ్యూచువల్ ఫండ్లు వ్యక్తి నుండి వ్యక్తికి మారవచ్చు, అయితే, ఉత్తమ SIP మ్యూచువల్ ఫండ్ను ఎంచుకునే ముందు పెట్టుబడిదారులు పరిగణించే కొన్ని పాయింట్ల జాబితా క్రింద ఉంది.
SIP పెట్టుబడి యొక్క లక్ష్యాన్ని అర్థం చేసుకోండి
పెట్టుబడి విషయానికి వస్తే, మనలో ప్రతి ఒక్కరికి ఒక్కో లక్ష్యం ఉంటుంది. కాబట్టి SIP ద్వారా మ్యూచువల్ ఫండ్స్లో పెట్టుబడి పెట్టడానికి ముందు, మీ పెట్టుబడి లక్ష్యాల గురించి స్పష్టమైన చిత్రాన్ని పొందడం మంచిది మరియుప్రమాద ప్రొఫైల్. సాధారణంగా,ఈక్విటీ మ్యూచువల్ ఫండ్స్ అయితే దీర్ఘకాలిక లక్ష్యాల కోసం ప్రయోజనకరంగా పరిగణించబడతాయిడబ్బు బజారు మరియురుణ నిధి స్వల్పకాలిక లక్ష్యాలకు అనుకూలంగా ఉంటాయి.
ఫండ్ హౌస్ తెలుసు
SIP రిటర్న్లలో ఎక్కువ భాగం మీ తరపున మీ డబ్బును నిర్వహించే ఫండ్ హౌస్పై ఆధారపడి ఉంటుంది. ఫండ్ హౌస్ దాని లక్ష్యం విఫలమైతే, మీరు మీ డబ్బును కోల్పోతారు. మీరు ఉత్తమమైన SIP ప్లాన్ని కలిగి ఉన్నారని నిర్ధారించుకోవడానికి బాగా పేరున్న ఫండ్ హౌస్ని ఎంచుకోండి.
SIP మ్యూచువల్ ఫండ్ యొక్క ఫండ్ పనితీరును పర్యవేక్షించండి
ప్రజలు దీనికి ప్రధాన కారణాలలో ఒకటిమ్యూచువల్ ఫండ్స్లో పెట్టుబడి పెట్టండి SIP ద్వారా డబ్బు సంపాదించడం. అందువల్ల, ఉత్తమ ఫండ్ను ఎంచుకుని, ఆపై ఉత్తమ SIP ప్లాన్లలో పెట్టుబడి పెట్టడానికి కొంత కాల వ్యవధిలో ఫండ్ల పనితీరును విశ్లేషించడం చాలా ముఖ్యం. సాధారణంగా, ఈక్విటీ కోసం మ్యూచువల్ ఫండ్స్ దీర్ఘకాలిక పనితీరును పరిశీలిస్తారు, అయితే డెట్ కోసం మ్యూచువల్ ఫండ్లు చిన్న నుండి మధ్య-కాల రాబడులు పరిగణించబడతాయి.
SIP యొక్క లోడ్లు మరియు పునరావృత ఖర్చులను విశ్లేషించండి
చివరిది కానీ, నిర్ణీత వ్యవధిలో (సాధారణంగా లాక్-ఇన్ పీరియడ్ అంటారు) ముందు పెట్టుబడిని రీడీమ్ చేసినట్లయితే, నిష్క్రమణ లోడ్ మరియు ఖర్చు నిష్పత్తి.
కాబట్టి, ఈ పారామితులను దృష్టిలో ఉంచుకుని ఉత్తమమైన SIP ప్లాన్లను ఎంచుకోవాలని సూచించబడింది. పెట్టుబడి పెట్టే ముందు ఆలోచించండి!
SIP కాలిక్యులేటర్ (SIP రిటర్న్ కాలిక్యులేటర్)
కోసంఆర్థిక ప్రణాళిక, SIP కాలిక్యులేటర్ లేదా SIP రిటర్న్ కాలిక్యులేటర్ ఉత్తమ సాధనాల్లో ఒకటి.
సమ్మేళనం యొక్క శక్తి ద్వారా మీ SIP ఎలా పెరుగుతుందో పర్యవేక్షించడానికి క్రింది ఉదాహరణను పరిగణించండి.
| నెలవారీ పెట్టుబడి | పెట్టుబడి కాల వ్యవధి | పెట్టుబడి పెట్టబడిన మొత్తం | తుది విలువ @ 14% p.a. |
|---|---|---|---|
| 1,000 | 5 సంవత్సరాలు | 60,000 | 87,200 |
| 1,000 | 10 సంవత్సరాల | 1,20,000 | 2,62,091 |
| 1,000 | 15 సంవత్సరాలు | 1,80,000 | 6,12,853 |
మీరు SIP మ్యూచువల్ ఫండ్లో నెలకు INR 1,000 పెట్టుబడి పెడితే, 5 సంవత్సరాలలో మీ మొత్తం పెట్టుబడి INR 60,000 అవుతుంది మరియు మీ SIP రాబడి 14% p.a. ఉంటుందిINR 87,2001, వరుసగా. అదేవిధంగా, 10 సంవత్సరాలలో మొత్తం పెట్టుబడి ఉంటుందిINR 1,20,000 మరియు SIP రాబడి 14% p.a. ఉంటుందిINR 2,62,091.
అదే విధంగా, 15 సంవత్సరాలలో పెట్టుబడి ఉంటుందిINR 1,80,000 మరియు 14% p.a రిటర్న్ శాతం వద్ద తుది విలువ ఉంటుందిINR 6,12,853, వరుసగా.
కాబట్టి, కేవలం ఒక నెలలో INR 1,000 పెట్టుబడి పెట్టడం ద్వారా, రాబోయే సంవత్సరాల్లో మీ డబ్బు ఎలా పెరుగుతుందో చూడండి. పెట్టుబడి పెట్టడానికి ఉత్తమమైన SIP మ్యూచువల్ ఫండ్ను ఎంచుకున్నప్పుడు పై లెక్కలను పరిగణించండి.
తరచుగా అడిగే ప్రశ్నలు
1. SIP అంటే ఏమిటి?
జ: SIP లేదా సిస్టమాటిక్ ఇన్వెస్ట్మెంట్ ప్లాన్ అనేది మ్యూచువల్ ఫండ్ స్కీమ్ కింద అందించే పెట్టుబడి మార్గం, ఇక్కడ క్రమ వ్యవధిలో పథకం కింద కొంత మొత్తం పెట్టుబడి పెట్టబడుతుంది. ఈ వాయిదా రూ.500 వరకు ఉంటుంది.
2. SIP యొక్క ప్రయోజనాలు ఏమిటి?
జ: SIP యొక్క ప్రాథమిక ప్రయోజనం ఏమిటంటే ఇది పెట్టుబడులను మరింత క్రమశిక్షణతో చేస్తుంది. ఇది పెట్టుబడిదారుని చేయడానికి అనుమతిస్తుందిఆర్థిక ప్రణాళిక ఉపయోగకరమైనది మరియు పెట్టుబడిదారుడిలో పెట్టుబడి పెట్టే అలవాటును అభివృద్ధి చేయడంలో సహాయపడుతుంది.
3. SIPలో ఎవరు పెట్టుబడి పెట్టవచ్చు?
జ: SIPలో ఎవరైనా పెట్టుబడి పెట్టవచ్చు. కానీ, మీరు మీ రిస్క్ అనాలిసిస్ చేయాలి, అంటే మీరు ఎంత రిస్క్ తీసుకోవాలనుకుంటున్నారు. అలాగే, ప్రారంభించడానికి, మీకు పాన్ వివరాలు, చిరునామా రుజువు మరియు అవసరంబ్యాంక్ వివరాలు.
4. ఆఫ్లైన్ మోడ్లో SIPలో పెట్టుబడి పెట్టడానికి దశలు ఏమిటి?
జ: ఆఫ్లైన్ మోడ్లో పెట్టుబడి పెట్టడానికి, మీరు దరఖాస్తు ఫారమ్ను పూరించాలి, నెలవారీ లేదా త్రైమాసిక SIP మొత్తానికి చెక్ను సమర్పించాలి, దాని కాపీని అందించాలిపాన్ కార్డ్, చిరునామా రుజువు మరియు మీ బ్యాంక్ వివరాలకు రుజువుగా రద్దు చేయబడిన చెక్కు.
5. నేను ICICI ప్రుడెన్షియల్ టెక్నాలజీ ఫండ్లో ఎందుకు పెట్టుబడి పెట్టాలి?
జ: ICICI ప్రుడెన్షియల్ టెక్నాలజీ ఫండ్ 3 మార్చి 2000న ప్రారంభించినప్పటి నుండి 11.9% రాబడిని చూపింది. ఇతర ఫండ్ల మాదిరిగా కాకుండా, 2020 సంవత్సరంలో ఇది 70.6% రాబడిని ఏర్పాటు చేసింది. అందువల్ల, ICICI ప్రుడెన్షియల్ టెక్నాలజీ ఫండ్లో పెట్టుబడి పెట్టడం విలువైనదని నిరూపించబడింది మరియు ఐదేళ్లపాటు SIPలో పెట్టుబడి పెట్టింది.
6. నేను SBI బ్లూచిప్ ఫండ్ రెగ్యులర్ గ్రోత్లో ఎందుకు పెట్టుబడి పెట్టాలి?
జ: SBI బ్లూచిప్ ఫండ్ రెగ్యులర్ గ్రోత్ ఐదు సంవత్సరాల వృద్ధి రేటును చూపింది5.29%, ఇది సాపేక్షంగా ఎక్కువ.
7. SIPలో పెట్టుబడి పెట్టేటప్పుడు మీరు ఏమి పరిగణించాలి?
జ: మీరు SIPలో పెట్టుబడి పెట్టినప్పుడు, మీరు నికర ఆస్తి విలువ లేదా దికాదు. ఇది మీరు పథకం కోసం చేసే పెట్టుబడి. మీరు దాని రేటింగ్లు మరియు దాని చారిత్రక పనితీరును కూడా తనిఖీ చేయాలి. మీ పెట్టుబడి సురక్షితంగా ఉందని నిర్ధారించుకోవడానికి SIP అందించే రాబడిని అర్థం చేసుకోవడం చాలా అవసరం.
8. SIP కోసం KYC ముఖ్యమా?
జ: అవును, SIP కోసం కూడా KYC అవసరం. SIP మ్యూచువల్ ఫండ్ పథకం కిందకు వస్తుంది కాబట్టి, మీరు SIPలో పెట్టుబడి పెట్టడానికి KYC పత్రాలను అందించాలి.
9. SIP లకు కనీస పెట్టుబడి అవసరం ఉందా?
జ: అవును, కొన్ని SIPలకు కనీస పెట్టుబడులు అవసరం. ఉదాహరణకు, ఆదిత్య బిర్లా సన్ లైఫ్ డిజిటల్ ఇండియా ఫండ్కి కనీస SIP పెట్టుబడి అవసరం రూ.1000. SBI బ్లూచిప్ ఫండ్ రెగ్యులర్ గ్రోత్కు కనీసం రూ.5000 అవసరం. కాబట్టి, మీరు పెట్టుబడి పెట్టే SIPని బట్టి, మీరు మీ పెట్టుబడి మొత్తాన్ని పెంచుకోవాలి.
ఇక్కడ అందించిన సమాచారం ఖచ్చితమైనదని నిర్ధారించడానికి అన్ని ప్రయత్నాలు చేయబడ్డాయి. అయినప్పటికీ, డేటా యొక్క ఖచ్చితత్వానికి సంబంధించి ఎటువంటి హామీలు ఇవ్వబడవు. దయచేసి ఏదైనా పెట్టుబడి పెట్టే ముందు పథకం సమాచార పత్రంతో ధృవీకరించండి.
You Might Also Like


AMFI Registration No. 112358 | CIN: U74999MH2016PTC282153
Shepard Technologies Pvt. Ltd. (with ARN code 112358) makes no warranties or representations, express or implied, on products offered through the platform. It accepts no liability for any damages or losses, however caused, in connection with the use of, or on the reliance of its product or related services. Terms and conditions of the website are applicable.
©2025 Shepard Technologies Private Limited. All Rights Reserved
helpful to invest in SIP