Table of Contents
FD Vs Debt Mutual Fund
FD vs Debt fund? Thinking where to invest your savings to earn good returns. Generally, people consider Investing in fixed deposit or FD to be the most convenient option as it is safe and offers fixed returns. But is it the best way? Though Fixed Deposit is an easy investment option for all, however, the returns of fixed deposits being taxable are much less as compared to a Debt Fund. Moreover, when held for a longer duration, Debt Mutual Funds offer good returns. Before making a final decision to invest in debt mutual funds or fixed deposits, go through the detailed comparison of these investments.
In summary:
Debt Mutual Funds (Debt Fund) Vs Fixed Deposits (FD)
We would need to break this up by the ability to take a risk and the intended holding period of the investor in question.
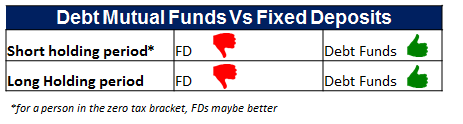
Short Holding Period (1 Year or Less)
Here the options for debt fund would be limited to Liquid Funds, ultra-short term funds and short-term Income funds. While the returns or yields normally would go higher from liquid to ultra-short to Short term fund, the yield differential between these debt funds and a Fixed Deposit can be determined considering their returns in last one year.
Debt Mutual Fund (Category Average Return)
| Type Of Debt Mutual Fund | Last 1 yr. Return (%) |
|---|---|
| Liquid Fund | 7.36 |
| Ultra Short-term Debt Funds | 9.18 |
| Short-term Debt Funds | 9.78 |
| Dynamic Debt Funds | 13.89 |
| Long-term Debt Funds | 13.19 |
| Gilt Short-term Funds | 11.76 |
| Gilt Long-term Funds | 15.06 |
| Data as of 20th Feb 2017 |
Fixed Deposit or FD Average Return Rate
The Average Return rate of Fixed Deposits ranged from 8-8.5% p.a. in the year 2016 (so one can compare the above returns in the table). However, in the past one year, the return rate has dropped to 6.6-7.5% p.a.
With the above illustration, it is clear that the average rate of return of Debt Funds is better than that of Fixed Deposits.
Talk to our investment specialist
Long-Term Holding Period
With a long intended holding period, debt funds may prove to be better than FDs.
The options to invest here would be:
- Long term income funds
- Long-term gilt,
- Corporate bond funds (high yield funds), in addition to the options mentioned above the liquid, ultra-short and short term funds may also be used.
Given that the holding period could be 3 years or more, we can say the following:
- With Capital gains tax at 20% with indexation benefits, the net tax incidence would be minimal ( however one should calculate the tax incidence given the year of incurring tax)
- Long term income funds/Gilt Funds with high yields and additionally, if interest rates move down would give very higher returns.
- One could end up with high double digit returns with these debt funds.
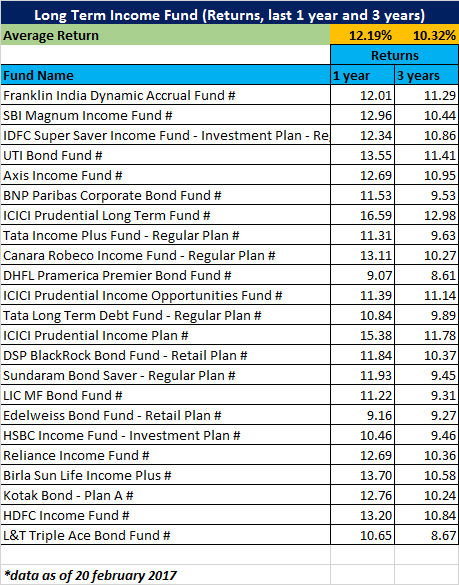
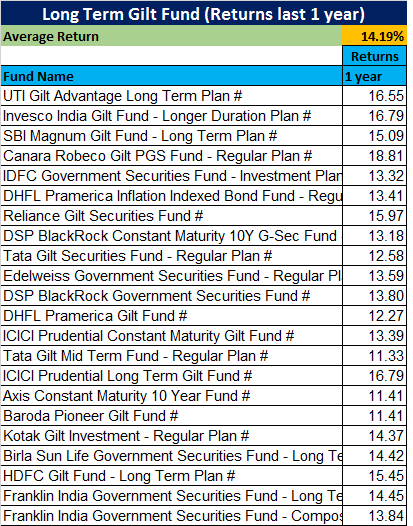
Take the example below of returns on long-term income funds, the average last 1-year return for the category is 12.19% and last 3 years is 10.32% p.a. No FD could have given a similar return in the period. Gilt Fund returns are even higher. In the same period, last year FD rates would have been close to 8-8.5% per annum across most banks, (albeit today the rates have dropped further to 6.5 - 7.5%)
So with an investor having a long intended holding period and interest rates falling, a debt fund (Long term income or Gilt) would give much better returns than an FD. Even in the case of interest rates not falling, high yield corporate bond funds would beat FDs in the same period.
Taxation on Debt Mutual Funds and Fixed Deposits
Taxation also plays an important role in determining the returns of the debt funds and fixed deposits. Typically, taxation on Fixed Deposits is 33% (marginal rate of tax) while on Debt Funds if one invests with a less than 3-year view then incurring dividend distribution tax would be a better option given that DDT (Dividend Distribution Tax) is deducted at approximately 25% (+surcharge etc). This shows that taxation on debt mutual funds is relatively lower than that in fixed deposits.
The additional benefits that come with debt funds are:
- liquidity: money available within 1–2 days from Redemption
- Professional management: ability to dynamically change strategy and take advantage of markets
- No premature withdrawal penalty.
To sum up:
| Parameters | Mutual Funds | Fixed Deposits |
|---|---|---|
| Rate of Returns | No Assured Returns | Fixed Returns |
| Inflation Adjusted Returns | Potential of High Inflation Adjusted Returns | Usually Low Inflation Adjusted Returns |
| Risk | Low to High Risk (Depends of Fund | Low Risk |
| Liquidity | Liquid | Liquid |
| Premature Withdrawal | Allowed with Exit Load/No Load | Allowed with Penalty |
| Cost of Investment | Management Cost/Expense Ratio | No Cost |
Top 8 Best Performing Debt Funds 2025
Below is the list of Debt funds having Net Assets/AUM above 1000 Crore and sorted on 3 Year compounded (CAGR) returns.
The primary investment objective of the Scheme is to generate regular income through investments in debt & money market instruments in order to make regular dividend payments to unit holders & secondary objective is growth of capital. Aditya Birla Sun Life Medium Term Plan is a Debt - Medium term Bond fund was launched on 25 Mar 09. It is a fund with Moderate risk and has given a Below is the key information for Aditya Birla Sun Life Medium Term Plan Returns up to 1 year are on An Open-ended income scheme with the objective to generate optimal returns with high liquidity through active management of the portfolio by investing in high quality debt and money market instruments. Aditya Birla Sun Life Dynamic Bond Fund is a Debt - Dynamic Bond fund was launched on 27 Sep 04. It is a fund with Moderate risk and has given a Below is the key information for Aditya Birla Sun Life Dynamic Bond Fund Returns up to 1 year are on (Erstwhile SBI Magnum Gilt Fund - Long Term Plan) To provide the investors with returns generated through investments in government securities issued by the Central Government and / or a State Government SBI Magnum Gilt Fund is a Debt - Government Bond fund was launched on 30 Dec 00. It is a fund with Moderate risk and has given a Below is the key information for SBI Magnum Gilt Fund Returns up to 1 year are on The Scheme aims to generate returns through investments in Central Govt Securities. DSP BlackRock Government Securities Fund is a Debt - Government Bond fund was launched on 30 Sep 99. It is a fund with Moderate risk and has given a Below is the key information for DSP BlackRock Government Securities Fund Returns up to 1 year are on (Erstwhile ICICI Prudential Income Plan) To generate income through investments in a range of debt and money market instruments of various maturities with a view to maximising income while maintaining the optimum balance of yield, safety and liquidity. ICICI Prudential Long Term Bond Fund is a Debt - Longterm Bond fund was launched on 9 Jul 98. It is a fund with Moderate risk and has given a Below is the key information for ICICI Prudential Long Term Bond Fund Returns up to 1 year are on The Scheme aims to provide reasonable returns by investing in portfolio of Government Securities with average maturity of around 10 years. However, there can be no assurance that the investment objective of the
Scheme will be realized. ICICI Prudential Constant Maturity Gilt Fund is a Debt - 10 Yr Govt Bond fund was launched on 12 Sep 14. It is a fund with Moderate risk and has given a Below is the key information for ICICI Prudential Constant Maturity Gilt Fund Returns up to 1 year are on (Erstwhile SBI Magnum Gilt Fund Short Term) To provide the investors with the returns generated through investments in government securities issued by the Central Govt. and State Govt. SBI Magnum Constant Maturity Fund is a Debt - 10 Yr Govt Bond fund was launched on 30 Dec 00. It is a fund with Moderately Low risk and has given a Below is the key information for SBI Magnum Constant Maturity Fund Returns up to 1 year are on (Erstwhile ICICI Prudential Long Term Gilt Fund) To generate income through investment in Gilts of various maturities. ICICI Prudential Gilt Fund is a Debt - Government Bond fund was launched on 19 Aug 99. It is a fund with Moderate risk and has given a Below is the key information for ICICI Prudential Gilt Fund Returns up to 1 year are on 1. Aditya Birla Sun Life Medium Term Plan
CAGR/Annualized return of 8.9% since its launch. Ranked 6 in Medium term Bond category. Return for 2024 was 10.5% , 2023 was 6.9% and 2022 was 24.8% . Aditya Birla Sun Life Medium Term Plan
Growth Launch Date 25 Mar 09 NAV (23 Apr 25) ₹39.349 ↑ 0.01 (0.03 %) Net Assets (Cr) ₹2,206 on 31 Mar 25 Category Debt - Medium term Bond AMC Birla Sun Life Asset Management Co Ltd Rating ☆☆☆☆ Risk Moderate Expense Ratio 1.55 Sharpe Ratio 2.48 Information Ratio 0 Alpha Ratio 0 Min Investment 1,000 Min SIP Investment 1,000 Exit Load 0-365 Days (1%),365 Days and above(NIL) Yield to Maturity 7.89% Effective Maturity 4 Years 10 Months 24 Days Modified Duration 3 Years 7 Months 17 Days Growth of 10,000 investment over the years.
Date Value 31 Mar 20 ₹10,000 31 Mar 21 ₹10,987 31 Mar 22 ₹12,025 31 Mar 23 ₹14,567 31 Mar 24 ₹15,635 31 Mar 25 ₹17,673 Returns for Aditya Birla Sun Life Medium Term Plan
absolute basis & more than 1 year are on CAGR (Compound Annual Growth Rate) basis. as on 23 Apr 25 Duration Returns 1 Month 1.9% 3 Month 5.3% 6 Month 7.1% 1 Year 14.5% 3 Year 14.3% 5 Year 12.4% 10 Year 15 Year Since launch 8.9% Historical performance (Yearly) on absolute basis
Year Returns 2024 10.5% 2023 6.9% 2022 24.8% 2021 7.1% 2020 8.1% 2019 -4.4% 2018 5.6% 2017 7% 2016 10.9% 2015 9.5% Fund Manager information for Aditya Birla Sun Life Medium Term Plan
Name Since Tenure Sunaina Cunha 1 Sep 14 10.59 Yr. Mohit Sharma 6 Aug 20 4.65 Yr. Data below for Aditya Birla Sun Life Medium Term Plan as on 31 Mar 25
Asset Allocation
Asset Class Value Cash 3.74% Equity 4.08% Debt 91.93% Other 0.25% Debt Sector Allocation
Sector Value Corporate 51.47% Government 39.97% Cash Equivalent 3.74% Securitized 0.5% Credit Quality
Rating Value A 3.53% AA 30.9% AAA 63.02% BBB 2.54% Top Securities Holdings / Portfolio
Name Holding Value Quantity 7.18% Govt Stock 2033
Sovereign Bonds | -22% ₹483 Cr 47,000,000
↓ -1,500,000 National Bank For Agriculture And Rural Development
Debentures | -5% ₹100 Cr 10,000
↑ 10,000 Nuvama Wealth Finance Ltd
Debentures | -4% ₹95 Cr 9,500
↑ 1,500 7.1% Govt Stock 2034
Sovereign Bonds | -4% ₹94 Cr 9,196,700
↑ 500,000 360 One Prime Ltd. 9.4%
Debentures | -3% ₹65 Cr 6,500
↑ 6,500 Narayana Hrudayalaya Limited
Debentures | -3% ₹60 Cr 6,000 Vedanta Limited
Debentures | -3% ₹60 Cr 6,000 7.23% Government Of India (15/04/2039)
Sovereign Bonds | -2% ₹52 Cr 5,000,000 LIC Housing Finance Limited
Debentures | -2% ₹50 Cr 5,000 Creditaccess Grameen Limited
Debentures | -2% ₹50 Cr 500,000 2. Aditya Birla Sun Life Dynamic Bond Fund
CAGR/Annualized return of 7.7% since its launch. Ranked 16 in Dynamic Bond category. Return for 2024 was 8.8% , 2023 was 6.9% and 2022 was 6% . Aditya Birla Sun Life Dynamic Bond Fund
Growth Launch Date 27 Sep 04 NAV (23 Apr 25) ₹46.3685 ↑ 0.04 (0.08 %) Net Assets (Cr) ₹1,767 on 31 Mar 25 Category Debt - Dynamic Bond AMC Birla Sun Life Asset Management Co Ltd Rating ☆☆☆ Risk Moderate Expense Ratio 1.21 Sharpe Ratio 0.81 Information Ratio 0 Alpha Ratio 0 Min Investment 1,000 Min SIP Investment 1,000 Exit Load 0-90 Days (0.5%),90 Days and above(NIL) Yield to Maturity 7.33% Effective Maturity 14 Years 7 Months 20 Days Modified Duration 7 Years 7 Months 2 Days Growth of 10,000 investment over the years.
Date Value 31 Mar 20 ₹10,000 31 Mar 21 ₹10,824 31 Mar 22 ₹11,337 31 Mar 23 ₹12,141 31 Mar 24 ₹13,078 31 Mar 25 ₹14,280 Returns for Aditya Birla Sun Life Dynamic Bond Fund
absolute basis & more than 1 year are on CAGR (Compound Annual Growth Rate) basis. as on 23 Apr 25 Duration Returns 1 Month 2.8% 3 Month 4.3% 6 Month 5.7% 1 Year 11.7% 3 Year 8.9% 5 Year 7.6% 10 Year 15 Year Since launch 7.7% Historical performance (Yearly) on absolute basis
Year Returns 2024 8.8% 2023 6.9% 2022 6% 2021 4.9% 2020 9.7% 2019 -0.9% 2018 5.7% 2017 2.2% 2016 14% 2015 7.4% Fund Manager information for Aditya Birla Sun Life Dynamic Bond Fund
Name Since Tenure Mohit Sharma 22 Mar 21 3.94 Yr. Bhupesh Bameta 6 Aug 20 4.57 Yr. Data below for Aditya Birla Sun Life Dynamic Bond Fund as on 31 Mar 25
Asset Allocation
Asset Class Value Cash 2.72% Debt 97% Other 0.28% Debt Sector Allocation
Sector Value Government 65.45% Corporate 31.54% Cash Equivalent 2.72% Credit Quality
Rating Value A 2.48% AA 7.71% AAA 89.82% Top Securities Holdings / Portfolio
Name Holding Value Quantity 7.23% Government Of India (15/04/2039)
Sovereign Bonds | -20% ₹347 Cr 33,577,900 7.18% Govt Stock 2037
Sovereign Bonds | -16% ₹277 Cr 27,000,000 7.1% Govt Stock 2034
Sovereign Bonds | -10% ₹170 Cr 16,590,200 Power Finance Corporation Limited
Debentures | -7% ₹124 Cr 12,500 7.34% Govt Stock 2064
Sovereign Bonds | -7% ₹124 Cr 11,914,000 Cholamandalam Investment And Finance Company Limited
Debentures | -5% ₹80 Cr 8,000 Bharti Telecom Limited
Debentures | -4% ₹76 Cr 7,500 State Bank Of India
Debentures | -4% ₹74 Cr 75 7.25% Govt Stock 2063
Sovereign Bonds | -3% ₹51 Cr 5,000,000 LIC Housing Finance Limited
Debentures | -3% ₹50 Cr 5,000 3. SBI Magnum Gilt Fund
CAGR/Annualized return of 8.1% since its launch. Ranked 3 in Government Bond category. Return for 2024 was 8.9% , 2023 was 7.6% and 2022 was 4.2% . SBI Magnum Gilt Fund
Growth Launch Date 30 Dec 00 NAV (23 Apr 25) ₹66.8899 ↑ 0.06 (0.09 %) Net Assets (Cr) ₹11,489 on 31 Mar 25 Category Debt - Government Bond AMC SBI Funds Management Private Limited Rating ☆☆☆☆ Risk Moderate Expense Ratio 0.94 Sharpe Ratio 0.61 Information Ratio 0 Alpha Ratio 0 Min Investment 5,000 Min SIP Investment 500 Exit Load NIL Yield to Maturity 6.97% Effective Maturity 24 Years 14 Days Modified Duration 10 Years 2 Months 1 Day Growth of 10,000 investment over the years.
Date Value 31 Mar 20 ₹10,000 31 Mar 21 ₹10,724 31 Mar 22 ₹11,112 31 Mar 23 ₹11,744 31 Mar 24 ₹12,773 31 Mar 25 ₹13,915 Returns for SBI Magnum Gilt Fund
absolute basis & more than 1 year are on CAGR (Compound Annual Growth Rate) basis. as on 23 Apr 25 Duration Returns 1 Month 3.2% 3 Month 4.8% 6 Month 6% 1 Year 12.2% 3 Year 8.8% 5 Year 6.8% 10 Year 15 Year Since launch 8.1% Historical performance (Yearly) on absolute basis
Year Returns 2024 8.9% 2023 7.6% 2022 4.2% 2021 3% 2020 11.7% 2019 13.1% 2018 5.1% 2017 3.9% 2016 16.3% 2015 7.3% Fund Manager information for SBI Magnum Gilt Fund
Name Since Tenure Rajeev Radhakrishnan 1 Nov 23 1.33 Yr. Tejas Soman 1 Dec 23 1.25 Yr. Data below for SBI Magnum Gilt Fund as on 31 Mar 25
Asset Allocation
Asset Class Value Cash 10.5% Debt 89.5% Debt Sector Allocation
Sector Value Government 89.5% Cash Equivalent 10.5% Credit Quality
Rating Value AAA 100% Top Securities Holdings / Portfolio
Name Holding Value Quantity 7.34% Govt Stock 2064
Sovereign Bonds | -37% ₹4,219 Cr 406,500,000
↓ -7,500,000 6.79% Government Of India (07/10/2034)
Sovereign Bonds | -36% ₹4,009 Cr 398,326,400
↑ 27,000,000 7.3% Govt Stock 2053
Sovereign Bonds | -10% ₹1,096 Cr 106,000,000
↓ -5,500,000 7.22% State Government Of Haryana 2038
Sovereign Bonds | -4% ₹402 Cr 40,000,000 7.13% State Government Of Karnataka 2041
Sovereign Bonds | -2% ₹249 Cr 25,048,600
↑ 4,500,000 7.16% State Government Of Madhya Pradesh 2037
Sovereign Bonds | -1% ₹100 Cr 10,000,000 Treps
CBLO/Reverse Repo | -5% ₹608 Cr Net Receivable / Payable
CBLO | -5% ₹574 Cr 8.83% Govt Stock 2041
Sovereign Bonds | -₹0 Cr 00
↓ -80,000,000 7.93% Govt Stock 2033
Sovereign Bonds | -₹0 Cr 00
↓ -6,000,000 4. DSP BlackRock Government Securities Fund
CAGR/Annualized return of 9.3% since its launch. Ranked 9 in Government Bond category. Return for 2024 was 10.1% , 2023 was 7.1% and 2022 was 2.7% . DSP BlackRock Government Securities Fund
Growth Launch Date 30 Sep 99 NAV (23 Apr 25) ₹97.3127 ↑ 0.14 (0.15 %) Net Assets (Cr) ₹1,566 on 31 Mar 25 Category Debt - Government Bond AMC DSP BlackRock Invmt Managers Pvt. Ltd. Rating ☆☆☆ Risk Moderate Expense Ratio 1.1 Sharpe Ratio 0.52 Information Ratio 0 Alpha Ratio 0 Min Investment 1,000 Min SIP Investment 500 Exit Load 0-7 Days (0.1%),7 Days and above(NIL) Yield to Maturity 7.04% Effective Maturity 29 Years 2 Months 26 Days Modified Duration 11 Years 6 Months Growth of 10,000 investment over the years.
Date Value 31 Mar 20 ₹10,000 31 Mar 21 ₹10,730 31 Mar 22 ₹11,166 31 Mar 23 ₹11,651 31 Mar 24 ₹12,744 31 Mar 25 ₹13,899 Returns for DSP BlackRock Government Securities Fund
absolute basis & more than 1 year are on CAGR (Compound Annual Growth Rate) basis. as on 23 Apr 25 Duration Returns 1 Month 3.4% 3 Month 4.9% 6 Month 5.9% 1 Year 12.9% 3 Year 8.6% 5 Year 6.8% 10 Year 15 Year Since launch 9.3% Historical performance (Yearly) on absolute basis
Year Returns 2024 10.1% 2023 7.1% 2022 2.7% 2021 3.1% 2020 13.1% 2019 12.5% 2018 7.4% 2017 1.4% 2016 15.3% 2015 6.2% Fund Manager information for DSP BlackRock Government Securities Fund
Name Since Tenure Sandeep Yadav 1 Aug 24 0.58 Yr. Shantanu Godambe 1 Jun 23 1.75 Yr. Data below for DSP BlackRock Government Securities Fund as on 31 Mar 25
Asset Allocation
Asset Class Value Cash 3.77% Debt 96.23% Debt Sector Allocation
Sector Value Government 96.23% Cash Equivalent 3.77% Credit Quality
Rating Value AAA 100% Top Securities Holdings / Portfolio
Name Holding Value Quantity 7.34% Govt Stock 2064
Sovereign Bonds | -34% ₹555 Cr 52,000,000
↓ -3,500,000 7.3% Govt Stock 2053
Sovereign Bonds | -29% ₹473 Cr 45,000,000
↓ -3,000,000 7.09% Govt Stock 2054
Sovereign Bonds | -7% ₹112 Cr 11,000,000
↓ -4,000,000 7.14% Madhya Pradesh SDL 2043
Sovereign Bonds | -6% ₹103 Cr 10,000,000 7.26% Maharashtra SDL 2050
Sovereign Bonds | -6% ₹101 Cr 10,000,000 7.1% Govt Stock 2034
Sovereign Bonds | -5% ₹90 Cr 8,500,000
↑ 8,500,000 8.17% Govt Stock 2044
Sovereign Bonds | -4% ₹58 Cr 5,000,000 7.14% Maharashtra SDL 2039
Sovereign Bonds | -3% ₹50 Cr 5,000,000 7.85% MP Sdl 2032
Sovereign Bonds | -2% ₹27 Cr 2,500,000 7.22% Maharashtra SDL 2049
Sovereign Bonds | -1% ₹15 Cr 1,500,000 5. ICICI Prudential Long Term Bond Fund
CAGR/Annualized return of 8.6% since its launch. Ranked 12 in Longterm Bond category. Return for 2024 was 10.1% , 2023 was 6.8% and 2022 was 1.3% . ICICI Prudential Long Term Bond Fund
Growth Launch Date 9 Jul 98 NAV (23 Apr 25) ₹90.7205 ↑ 0.07 (0.08 %) Net Assets (Cr) ₹1,078 on 31 Mar 25 Category Debt - Longterm Bond AMC ICICI Prudential Asset Management Company Limited Rating ☆☆☆☆ Risk Moderate Expense Ratio 1.97 Sharpe Ratio 1.03 Information Ratio 0 Alpha Ratio 0 Min Investment 5,000 Min SIP Investment 1,000 Exit Load NIL Yield to Maturity 7.09% Effective Maturity 23 Years 1 Month 6 Days Modified Duration 9 Years 6 Months 7 Days Growth of 10,000 investment over the years.
Date Value 31 Mar 20 ₹10,000 31 Mar 21 ₹10,493 31 Mar 22 ₹10,688 31 Mar 23 ₹11,063 31 Mar 24 ₹12,017 31 Mar 25 ₹13,198 Returns for ICICI Prudential Long Term Bond Fund
absolute basis & more than 1 year are on CAGR (Compound Annual Growth Rate) basis. as on 23 Apr 25 Duration Returns 1 Month 3% 3 Month 4.9% 6 Month 6.7% 1 Year 12.6% 3 Year 8.6% 5 Year 5.7% 10 Year 15 Year Since launch 8.6% Historical performance (Yearly) on absolute basis
Year Returns 2024 10.1% 2023 6.8% 2022 1.3% 2021 0.4% 2020 11% 2019 12.1% 2018 6.8% 2017 4.1% 2016 15.7% 2015 5.1% Fund Manager information for ICICI Prudential Long Term Bond Fund
Name Since Tenure Manish Banthia 22 Jan 24 1.11 Yr. Raunak Surana 22 Jan 24 1.11 Yr. Data below for ICICI Prudential Long Term Bond Fund as on 31 Mar 25
Asset Allocation
Asset Class Value Cash 5.41% Debt 94.36% Other 0.23% Debt Sector Allocation
Sector Value Government 77.89% Corporate 16.47% Cash Equivalent 5.41% Credit Quality
Rating Value AAA 100% Top Securities Holdings / Portfolio
Name Holding Value Quantity 7.34% Govt Stock 2064
Sovereign Bonds | -32% ₹391 Cr 37,701,500
↑ 2,500,000 7.18% Govt Stock 2037
Sovereign Bonds | -18% ₹222 Cr 21,603,830 6.92% Govt Stock 2039
Sovereign Bonds | -8% ₹101 Cr 10,063,500
↓ -8,000,000 7.23% Government Of India (15/04/2039)
Sovereign Bonds | -6% ₹72 Cr 7,000,000 The Great Eastern Shipping Company Limited
Debentures | -4% ₹53 Cr 536 HDFC Bank Limited
Debentures | -4% ₹51 Cr 5,000
↓ -2,500 LIC Housing Finance Limited
Debentures | -4% ₹50 Cr 500 7.12% Maharashtra SDL 2038
Sovereign Bonds | -4% ₹49 Cr 4,960,700
↑ 4,960,700 7.14% Maharashtra SDL 2039
Sovereign Bonds | -3% ₹40 Cr 4,000,000
↑ 4,000,000 7.09% Govt Stock 2054
Sovereign Bonds | -3% ₹35 Cr 3,500,000 6. ICICI Prudential Constant Maturity Gilt Fund
CAGR/Annualized return of 8.9% since its launch. Ranked 6 in 10 Yr Govt Bond category. Return for 2024 was 9.3% , 2023 was 7.7% and 2022 was 1.2% . ICICI Prudential Constant Maturity Gilt Fund
Growth Launch Date 12 Sep 14 NAV (23 Apr 25) ₹24.6915 ↓ 0.00 (-0.01 %) Net Assets (Cr) ₹2,537 on 31 Mar 25 Category Debt - 10 Yr Govt Bond AMC ICICI Prudential Asset Management Company Limited Rating ☆☆☆ Risk Moderate Expense Ratio 0.39 Sharpe Ratio 1.14 Information Ratio 0 Alpha Ratio 0 Min Investment 5,000 Min SIP Investment 1,000 Exit Load 0-7 Days (0.25%),7 Days and above(NIL) Yield to Maturity 9.83% Effective Maturity 9 Years 9 Months 29 Days Modified Duration 6 Years 10 Months 13 Days Growth of 10,000 investment over the years.
Date Value 31 Mar 20 ₹10,000 31 Mar 21 ₹10,799 31 Mar 22 ₹11,205 31 Mar 23 ₹11,591 31 Mar 24 ₹12,568 31 Mar 25 ₹13,796 Returns for ICICI Prudential Constant Maturity Gilt Fund
absolute basis & more than 1 year are on CAGR (Compound Annual Growth Rate) basis. as on 23 Apr 25 Duration Returns 1 Month 2.9% 3 Month 4.7% 6 Month 6.7% 1 Year 12.6% 3 Year 8.6% 5 Year 6.6% 10 Year 15 Year Since launch 8.9% Historical performance (Yearly) on absolute basis
Year Returns 2024 9.3% 2023 7.7% 2022 1.2% 2021 2.8% 2020 13.6% 2019 12.8% 2018 9.7% 2017 2.4% 2016 16.2% 2015 6.9% Fund Manager information for ICICI Prudential Constant Maturity Gilt Fund
Name Since Tenure Manish Banthia 22 Jan 24 1.11 Yr. Raunak Surana 22 Jan 24 1.11 Yr. Data below for ICICI Prudential Constant Maturity Gilt Fund as on 31 Mar 25
Asset Allocation
Asset Class Value Cash 3.14% Debt 96.86% Debt Sector Allocation
Sector Value Government 96.86% Cash Equivalent 3.14% Credit Quality
Rating Value AAA 100% Top Securities Holdings / Portfolio
Name Holding Value Quantity 7.1% Govt Stock 2034
Sovereign Bonds | -44% ₹1,121 Cr 109,556,400
↓ -62,500,000 6.64% Govt Stock 2035
Sovereign Bonds | -39% ₹988 Cr 100,000,000
↑ 70,000,000 7.18% Govt Stock 2037
Sovereign Bonds | -8% ₹200 Cr 19,500,000 6.19% Govt Stock 2034
Sovereign Bonds | -2% ₹48 Cr 5,000,000 6.92% Govt Stock 2039
Sovereign Bonds | -1% ₹35 Cr 3,500,000
↓ -2,500,000 7.23% Government Of India (15/04/2039)
Sovereign Bonds | -1% ₹31 Cr 3,000,000 6.67% Govt Stock 2035
Sovereign Bonds | -1% ₹25 Cr 2,500,000 6.79% Government Of India (07/10/2034)
Sovereign Bonds | -0% ₹6 Cr 549,300
↓ -3,000,000 7.18% Govt Stock 2033
Sovereign Bonds | -0% ₹1 Cr 72,600 Net Current Assets
Net Current Assets | -2% ₹56 Cr 7. SBI Magnum Constant Maturity Fund
CAGR/Annualized return of 7.9% since its launch. Ranked 1 in 10 Yr Govt Bond category. Return for 2024 was 9.1% , 2023 was 7.5% and 2022 was 1.3% . SBI Magnum Constant Maturity Fund
Growth Launch Date 30 Dec 00 NAV (23 Apr 25) ₹63.8107 ↓ -0.02 (-0.03 %) Net Assets (Cr) ₹1,831 on 31 Mar 25 Category Debt - 10 Yr Govt Bond AMC SBI Funds Management Private Limited Rating ☆☆☆☆ Risk Moderately Low Expense Ratio 0.64 Sharpe Ratio 1 Information Ratio 0 Alpha Ratio 0 Min Investment 5,000 Min SIP Investment 500 Exit Load NIL Yield to Maturity 6.74% Effective Maturity 9 Years 9 Months 29 Days Modified Duration 6 Years 9 Months 22 Days Growth of 10,000 investment over the years.
Date Value 31 Mar 20 ₹10,000 31 Mar 21 ₹10,595 31 Mar 22 ₹10,971 31 Mar 23 ₹11,385 31 Mar 24 ₹12,324 31 Mar 25 ₹13,484 Returns for SBI Magnum Constant Maturity Fund
absolute basis & more than 1 year are on CAGR (Compound Annual Growth Rate) basis. as on 23 Apr 25 Duration Returns 1 Month 2.8% 3 Month 4.5% 6 Month 6.3% 1 Year 12.2% 3 Year 8.5% 5 Year 6.1% 10 Year 15 Year Since launch 7.9% Historical performance (Yearly) on absolute basis
Year Returns 2024 9.1% 2023 7.5% 2022 1.3% 2021 2.4% 2020 11.6% 2019 11.9% 2018 9.9% 2017 6.2% 2016 12.8% 2015 9.1% Fund Manager information for SBI Magnum Constant Maturity Fund
Name Since Tenure Rajeev Radhakrishnan 1 Nov 23 1.33 Yr. Tejas Soman 1 Dec 23 1.25 Yr. Data below for SBI Magnum Constant Maturity Fund as on 31 Mar 25
Asset Allocation
Asset Class Value Cash 3.09% Debt 96.91% Debt Sector Allocation
Sector Value Government 96.91% Cash Equivalent 3.09% Credit Quality
Rating Value AAA 100% Top Securities Holdings / Portfolio
Name Holding Value Quantity 7.1% Govt Stock 2034
Sovereign Bonds | -72% ₹1,320 Cr 129,000,000 7.18% Govt Stock 2037
Sovereign Bonds | -25% ₹467 Cr 45,500,000 Net Receivable / Payable
CBLO | -2% ₹42 Cr Treps
CBLO/Reverse Repo | -1% ₹15 Cr 8. ICICI Prudential Gilt Fund
CAGR/Annualized return of 9.5% since its launch. Ranked 5 in Government Bond category. Return for 2024 was 8.2% , 2023 was 8.3% and 2022 was 3.7% . ICICI Prudential Gilt Fund
Growth Launch Date 19 Aug 99 NAV (23 Apr 25) ₹102.742 ↑ 0.03 (0.03 %) Net Assets (Cr) ₹7,133 on 31 Mar 25 Category Debt - Government Bond AMC ICICI Prudential Asset Management Company Limited Rating ☆☆☆☆ Risk Moderate Expense Ratio 1.12 Sharpe Ratio 0.87 Information Ratio 0 Alpha Ratio 0 Min Investment 5,000 Min SIP Investment 1,000 Exit Load NIL Yield to Maturity 6.94% Effective Maturity 15 Years 9 Months 14 Days Modified Duration 7 Years 22 Days Growth of 10,000 investment over the years.
Date Value 31 Mar 20 ₹10,000 31 Mar 21 ₹10,828 31 Mar 22 ₹11,265 31 Mar 23 ₹11,915 31 Mar 24 ₹12,953 31 Mar 25 ₹14,074 Returns for ICICI Prudential Gilt Fund
absolute basis & more than 1 year are on CAGR (Compound Annual Growth Rate) basis. as on 23 Apr 25 Duration Returns 1 Month 2.5% 3 Month 4.2% 6 Month 6% 1 Year 11% 3 Year 8.5% 5 Year 6.8% 10 Year 15 Year Since launch 9.5% Historical performance (Yearly) on absolute basis
Year Returns 2024 8.2% 2023 8.3% 2022 3.7% 2021 3.8% 2020 12.6% 2019 10.8% 2018 6.8% 2017 2.1% 2016 18.2% 2015 5.5% Fund Manager information for ICICI Prudential Gilt Fund
Name Since Tenure Manish Banthia 22 Jan 24 1.11 Yr. Raunak Surana 22 Jan 24 1.11 Yr. Data below for ICICI Prudential Gilt Fund as on 31 Mar 25
Asset Allocation
Asset Class Value Cash 9.99% Debt 90.01% Debt Sector Allocation
Sector Value Government 90.01% Cash Equivalent 9.99% Credit Quality
Rating Value AAA 100% Top Securities Holdings / Portfolio
Name Holding Value Quantity 7.1% Govt Stock 2034
Sovereign Bonds | -33% ₹2,109 Cr 206,066,000
↓ -30,000,000 7.34% Govt Stock 2064
Sovereign Bonds | -21% ₹1,360 Cr 131,038,200
↑ 25,000,000 7.93% Govt Stock 2033
Sovereign Bonds | -15% ₹968 Cr 94,096,700 7.3% Govt Stock 2028
Sovereign Bonds | -7% ₹427 Cr 42,500,000 7.12% Maharashtra SDL 2038
Sovereign Bonds | -3% ₹214 Cr 21,496,400
↑ 21,496,400 91 Days Tbill Red 24-04-2025
Sovereign Bonds | -3% ₹189 Cr 19,000,000 7.14% Maharashtra SDL 2039
Sovereign Bonds | -3% ₹180 Cr 18,000,000
↑ 18,000,000 91 DTB 17042025
Sovereign Bonds | -3% ₹174 Cr 17,500,000
↓ -10,000,000 7.09% Govt Stock 2054
Sovereign Bonds | -2% ₹151 Cr 15,000,000 7.18% Govt Stock 2033
Sovereign Bonds | -2% ₹109 Cr 10,567,890
↓ -262,500
All efforts have been made to ensure the information provided here is accurate. However, no guarantees are made regarding correctness of data. Please verify with scheme information document before making any investment.
You Might Also Like
")


AMFI Registration No. 112358 | CIN: U74999MH2016PTC282153
Shepard Technologies Pvt. Ltd. (with ARN code 112358) makes no warranties or representations, express or implied, on products offered through the platform. It accepts no liability for any damages or losses, however caused, in connection with the use of, or on the reliance of its product or related services. Terms and conditions of the website are applicable.
©2025 Shepard Technologies Private Limited. All Rights Reserved