Table of Contents
- റിട്ടയർമെന്റ് കാൽക്കുലേറ്റർ മനസ്സിലാക്കുന്നു
- റിട്ടയർമെന്റ് കാൽക്കുലേറ്റർ: മൂല്യനിർണ്ണയ പ്രക്രിയ
- 2022-ലെ മികച്ച ഫണ്ടുകൾ
Top 2 Equity - Sectoral Funds
റിട്ടയർമെന്റ് കാൽക്കുലേറ്റർ: വിലയിരുത്തുകയും നിക്ഷേപിക്കുകയും ചെയ്യുക
വിരമിക്കൽ ഒരു നിശ്ചിത ജീവിത നിലവാരം നിലനിർത്തുന്നതിന് വിരമിക്കലിന് ശേഷം ആവശ്യമായ കോർപ്പസിനെ കുറിച്ച് അറിയാൻ ഉത്സുകരായവർക്കുള്ള ഒരു ഉപകരണമാണ് കാൽക്കുലേറ്റർ. റിട്ടയർമെന്റ് കാൽക്കുലേറ്റർ ഒരു അത്യാവശ്യ ഘടകമായി കണക്കാക്കുമ്പോൾവിരമിക്കുന്നതിനുള്ള ആസൂത്രണം. നിങ്ങളുടെ നിലവിലെ സാമ്പത്തിക സാഹചര്യങ്ങളെ അടിസ്ഥാനമാക്കി നിങ്ങളുടെ റിട്ടയർമെന്റിനായി നിങ്ങൾ സംരക്ഷിക്കേണ്ട കണക്കാക്കിയ തുക തിരിച്ചറിയാൻ ഇത് നിങ്ങളെ സഹായിക്കുന്നു. അതിനാൽ, നിങ്ങൾ വിരമിക്കുമ്പോൾ ആവശ്യമായ കോർപ്പസ് വിലയിരുത്താൻ സഹായിക്കുന്ന വളരെ ലളിതമായ ഒരു റിട്ടയർമെന്റ് കാൽക്കുലേറ്ററിലൂടെ ഞങ്ങൾ നിങ്ങളെ കൊണ്ടുപോകുന്നു.
റിട്ടയർമെന്റ് കാൽക്കുലേറ്റർ മനസ്സിലാക്കുന്നു
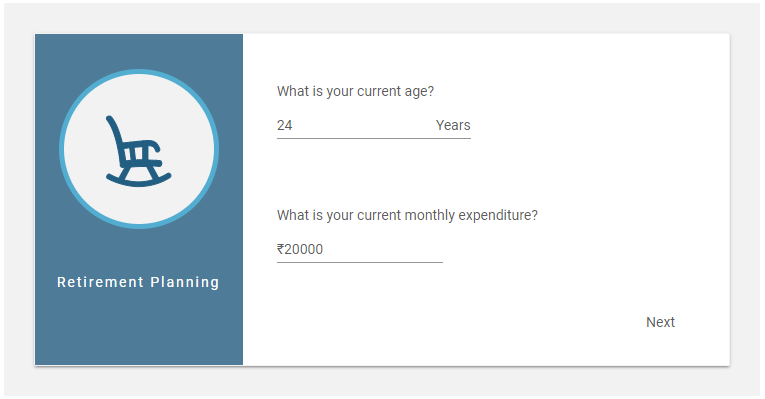
ഒരു റിട്ടയർമെന്റ് കാൽക്കുലേറ്റർ ഉപയോഗിക്കുമ്പോൾ, നിങ്ങൾ ചില വേരിയബിളുകൾ നൽകേണ്ടതുണ്ട്,
- നിങ്ങളുടെ ഇപ്പോഴത്തെ പ്രായം
- നിങ്ങളുടെ നിലവിലെ പ്രതിമാസ ചെലവുകൾ
- പ്രതീക്ഷിച്ചത്പണപ്പെരുപ്പം വരും വർഷങ്ങളിലെ നിരക്ക് (വാർഷികം).
- നിക്ഷേപങ്ങളുടെ ദീർഘകാല വളർച്ചാ നിരക്ക്
ഈ വേരിയബിളുകളെല്ലാം കാൽക്കുലേറ്ററിലേക്ക് നൽകുമ്പോൾ, ജീവിതനിലവാരം നിലനിർത്താൻ നിങ്ങളുടെ വിരമിക്കലിന് പ്രതിമാസം നിക്ഷേപിക്കേണ്ട തുക നൽകും. (അതായത് നിങ്ങളുടെ നിലവിലെ പ്രതിമാസ ജീവിതച്ചെലവുകൾ പണപ്പെരുപ്പത്തിനനുസരിച്ച് ക്രമീകരിച്ചിരിക്കുന്നു).
റിട്ടയർമെന്റ് കാൽക്കുലേറ്റർ: മൂല്യനിർണ്ണയ പ്രക്രിയ
1. നിങ്ങളുടെ നിലവിലെ പ്രതിമാസ ചെലവുകൾ കണക്കാക്കുന്നു
നിങ്ങൾ ഇവിടെ ആദ്യം ചെയ്യേണ്ടത്, വീട്ടുചെലവുകൾ, യൂട്ടിലിറ്റി ചെലവുകൾ, ഗതാഗത ചെലവ്, മറ്റ് ജീവിതശൈലി ചെലവുകൾ എന്നിങ്ങനെയുള്ള നിങ്ങളുടെ പ്രതിമാസ ചെലവുകൾ കണക്കാക്കുക എന്നതാണ്. ഇതുകൂടാതെ, വിവിധ ചെലവുകൾക്കായി നിങ്ങൾക്ക് പ്രതിമാസം ആവശ്യമായ ഏറ്റവും കുറഞ്ഞ തുകയെക്കുറിച്ച് നിങ്ങൾക്ക് ഏകദേശ ധാരണ ഉണ്ടായിരിക്കണം. വിരമിച്ച ശേഷം സുഖപ്രദമായ ജീവിതം നയിക്കാൻ ഭാവിയിൽ പണപ്പെരുപ്പത്തിനായി ക്രമീകരിച്ച ഈ ചെലവുകൾ മതിയാകും എന്നതാണ് ഇവിടെ അടിസ്ഥാന അനുമാനം.
*ഉദാഹരണത്തിന്-*
- വീട്ടുചെലവുകൾ -10 രൂപ,000
- ഗതാഗത ചെലവുകൾ -2,000 രൂപ
- യൂട്ടിലിറ്റി ചെലവുകൾ-** INR 3,000**
- മറ്റ് ജീവിതശൈലി ചെലവുകൾ (സിനിമകൾ, ഡൈനിംഗ് മുതലായവ) -3,000 രൂപ
- വിവിധ ചെലവുകൾ -2000 രൂപ
മൊത്തം പ്രതിമാസ ചെലവുകൾ-20,000 രൂപ
Know Your Monthly SIP Amount
2. വരും വർഷങ്ങളിലെ പണപ്പെരുപ്പ നിരക്ക് മനസ്സിലാക്കുക
നിങ്ങൾ വിരമിക്കുന്നതുവരെ വരും വർഷങ്ങളിൽ നിങ്ങൾ പ്രതീക്ഷിക്കുന്ന ശരാശരി വാർഷിക പണപ്പെരുപ്പ നിരക്കാണിത്. വിവിധ പ്രകാരംവിപണി സ്രോതസ്സുകൾ, ശരാശരി പണപ്പെരുപ്പം ഏകദേശം 4-5% p.a ആയി കണക്കാക്കാം. വരും വർഷങ്ങളിൽ. എന്നിരുന്നാലും, ഒരാൾക്ക് അവരുടെ സ്വന്തം അനുമാനവും നൽകാം.
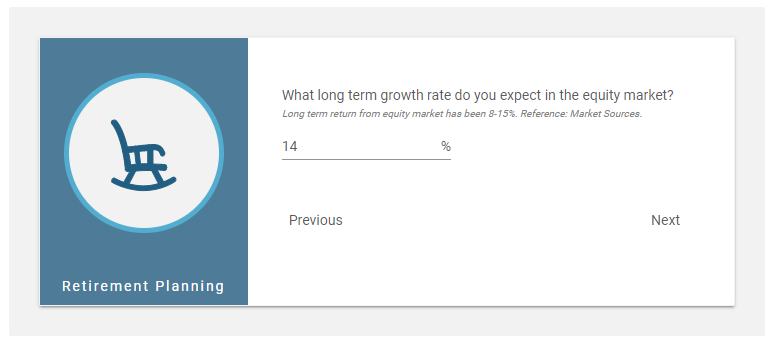
3. നിക്ഷേപങ്ങളുടെ ദീർഘകാല വളർച്ചാ നിരക്ക്
നിങ്ങളുടെ നിക്ഷേപങ്ങളിൽ നിങ്ങൾ പ്രതീക്ഷിക്കുന്ന ദീർഘകാല വളർച്ചാ നിരക്കാണിത്. ഇക്വിറ്റി മാർക്കറ്റിൽ നിന്നുള്ള ദീർഘകാല റിട്ടേൺ ചരിത്രപരമായി 8-15% ആണെങ്കിലും, വിപണി സ്രോതസ്സുകൾ പ്രകാരം, മുന്നോട്ട് പോകുമ്പോൾ ഏകദേശം 8-15% p.a. ദീർഘകാലാടിസ്ഥാനത്തിൽ. നിങ്ങൾക്ക് വിപണിയെക്കുറിച്ച് നല്ല അറിവുണ്ടെങ്കിൽ, വളർച്ചാ നിരക്കിൽ നിങ്ങളുടെ സ്വന്തം അനുമാനങ്ങൾ നൽകാം.
Talk to our investment specialist
4. നിക്ഷേപ മൂല്യനിർണ്ണയം
നിങ്ങൾക്ക് പ്രതിമാസം നിക്ഷേപിക്കേണ്ട ആവശ്യമുള്ള തുക ലഭിക്കുന്ന രസകരമായ ഭാഗം ഇപ്പോൾ വരുന്നു. മേൽപ്പറഞ്ഞ വേരിയബിളുകൾ കണക്കിലെടുക്കുമ്പോൾ, നിങ്ങൾ വിരമിക്കുന്നതുവരെ പ്രതിമാസം ലാഭിക്കേണ്ട ആവശ്യമുള്ള കോർപ്പസ് നിങ്ങൾക്ക് ലഭിക്കും. ഇവിടെ റിട്ടയർമെന്റിനുള്ള കണക്കാക്കിയ പ്രായം 60 വയസ്സായി കണക്കാക്കുന്നു (ചുവടെയുള്ള ചിത്രം കാണുക).
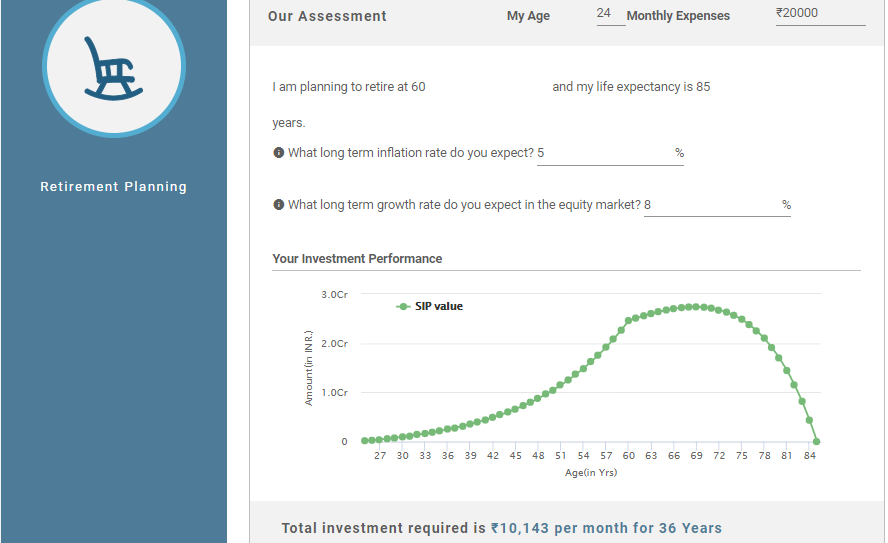
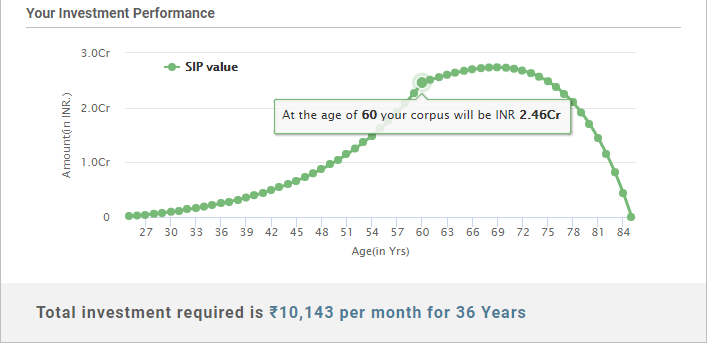
5. മൊത്തം കോർപ്പസ്
നിങ്ങൾ 36 വർഷത്തേക്ക് നിക്ഷേപിക്കുമ്പോൾ എത്ര കോർപ്പസ് സമാഹരിക്കപ്പെടും എന്നർത്ഥം, നിങ്ങൾ ആരംഭിച്ചാൽനിക്ഷേപിക്കുന്നു 24 വയസ്സ് മുതൽ 60 വയസ്സ് വരെ. ആവശ്യമുള്ള കോർപ്പസിൽ എത്താൻ, നിങ്ങൾ പ്രതിമാസ നിക്ഷേപം നടത്തേണ്ടതുണ്ട്. മേൽപ്പറഞ്ഞ കണക്കുകൾ പ്രകാരം, 36 വർഷത്തേക്ക് എല്ലാ മാസവും ആവശ്യമായ മൊത്തം നിക്ഷേപം 10,143 രൂപയാണ്. സൂചിപ്പിച്ചതുപോലെ, കണക്കാക്കിയ മൊത്തം കോർപ്പസ് നിങ്ങളുടെ നിലവിലെ പ്രായം, നിലവിലെ പ്രതിമാസ ചെലവുകൾ, പണപ്പെരുപ്പം, വർഷങ്ങളിൽ പ്രതീക്ഷിക്കുന്ന നിക്ഷേപത്തിന്റെ വളർച്ചാ നിരക്ക് എന്നിവയെ ആശ്രയിച്ചിരിക്കും.
ഉപസംഹാരം- റിട്ടയർമെന്റിനായി ആസൂത്രണം ചെയ്യുന്ന ആളുകൾക്ക് ഈ കാൽക്കുലേറ്റർ ഉപയോഗിക്കാം, അതിലൂടെ നിങ്ങളുടെ റിട്ടയർമെന്റ് കോർപ്പസ് എളുപ്പത്തിൽ കണക്കാക്കാം. വിരമിക്കലിന് ആവശ്യമായ തുക ഏകദേശം കണക്കാക്കാൻ ഇത് നിങ്ങളെ സഹായിക്കും, അതിനാൽ, അതിനനുസരിച്ച് നിങ്ങളുടെ നിക്ഷേപം ആസൂത്രണം ചെയ്യാൻ കഴിയും!
2022-ലെ മികച്ച ഫണ്ടുകൾ
*5 വർഷത്തെ പ്രകടനത്തെ അടിസ്ഥാനമാക്കിയുള്ള മികച്ച ഫണ്ടുകൾ.
The investment objective of the scheme is to seek to generate long-term capital growth through an active diversified portfolio of predominantly equity and equity related instruments of companies that are participating in and benefiting from growth in Indian infrastructure and infrastructural related activities. However, there can be no assurance that the investment objective of the scheme will be realized. IDFC Infrastructure Fund is a Equity - Sectoral fund was launched on 8 Mar 11. It is a fund with High risk and has given a Below is the key information for IDFC Infrastructure Fund Returns up to 1 year are on To seek long-term capital appreciation by investing predominantly in equity and equity related securities of companies engaged in or expected to benefit from growth and development of infrastructure. HDFC Infrastructure Fund is a Equity - Sectoral fund was launched on 10 Mar 08. It is a fund with High risk and has given a Below is the key information for HDFC Infrastructure Fund Returns up to 1 year are on 1. IDFC Infrastructure Fund
CAGR/Annualized return of 11.6% since its launch. Ranked 1 in Sectoral category. Return for 2024 was 39.3% , 2023 was 50.3% and 2022 was 1.7% . IDFC Infrastructure Fund
Growth Launch Date 8 Mar 11 NAV (17 Apr 25) ₹47.008 ↑ 0.57 (1.23 %) Net Assets (Cr) ₹1,400 on 28 Feb 25 Category Equity - Sectoral AMC IDFC Asset Management Company Limited Rating ☆☆☆☆☆ Risk High Expense Ratio 2.33 Sharpe Ratio -0.3 Information Ratio 0 Alpha Ratio 0 Min Investment 5,000 Min SIP Investment 100 Exit Load 0-365 Days (1%),365 Days and above(NIL) Growth of 10,000 investment over the years.
Date Value 31 Mar 20 ₹10,000 31 Mar 21 ₹20,153 31 Mar 22 ₹24,848 31 Mar 23 ₹27,324 31 Mar 24 ₹47,064 31 Mar 25 ₹50,038 Returns for IDFC Infrastructure Fund
absolute basis & more than 1 year are on CAGR (Compound Annual Growth Rate) basis. as on 17 Apr 25 Duration Returns 1 Month 10.1% 3 Month -4.7% 6 Month -13.8% 1 Year 4.3% 3 Year 24.7% 5 Year 35% 10 Year 15 Year Since launch 11.6% Historical performance (Yearly) on absolute basis
Year Returns 2023 39.3% 2022 50.3% 2021 1.7% 2020 64.8% 2019 6.3% 2018 -5.3% 2017 -25.9% 2016 58.7% 2015 10.7% 2014 -0.2% Fund Manager information for IDFC Infrastructure Fund
Name Since Tenure Vishal Biraia 24 Jan 24 1.1 Yr. Ritika Behera 7 Oct 23 1.4 Yr. Gaurav Satra 7 Jun 24 0.73 Yr. Data below for IDFC Infrastructure Fund as on 28 Feb 25
Equity Sector Allocation
Sector Value Industrials 54.7% Utility 13.22% Basic Materials 10.84% Communication Services 4.49% Energy 3.88% Consumer Cyclical 3.46% Financial Services 2.99% Technology 2.07% Health Care 1.9% Asset Allocation
Asset Class Value Cash 2.43% Equity 97.57% Top Securities Holdings / Portfolio
Name Holding Value Quantity Kirloskar Brothers Ltd (Industrials)
Equity, Since 31 Dec 17 | KIRLOSBROS5% ₹71 Cr 443,385 Larsen & Toubro Ltd (Industrials)
Equity, Since 29 Feb 12 | LT4% ₹58 Cr 183,173
↑ 11,726 Reliance Industries Ltd (Energy)
Equity, Since 30 Jun 24 | RELIANCE4% ₹54 Cr 452,706 Bharti Airtel Ltd (Communication Services)
Equity, Since 30 Apr 19 | BHARTIARTL4% ₹52 Cr 330,018
↑ 40,855 UltraTech Cement Ltd (Basic Materials)
Equity, Since 31 Mar 14 | 5325384% ₹51 Cr 50,452
↑ 3,476 GPT Infraprojects Ltd (Industrials)
Equity, Since 30 Nov 17 | GPTINFRA3% ₹45 Cr 4,797,143 Adani Ports & Special Economic Zone Ltd (Industrials)
Equity, Since 31 Dec 23 | ADANIPORTS3% ₹39 Cr 365,137
↓ -69,842 PTC India Financial Services Ltd (Financial Services)
Equity, Since 31 Dec 23 | PFS3% ₹39 Cr 12,400,122 Bharat Electronics Ltd (Industrials)
Equity, Since 31 Oct 19 | BEL3% ₹35 Cr 1,431,700 KEC International Ltd (Industrials)
Equity, Since 30 Jun 24 | 5327143% ₹35 Cr 512,915 2. HDFC Infrastructure Fund
CAGR/Annualized return of since its launch. Ranked 26 in Sectoral category. Return for 2024 was 23% , 2023 was 55.4% and 2022 was 19.3% . HDFC Infrastructure Fund
Growth Launch Date 10 Mar 08 NAV (17 Apr 25) ₹44.53 ↑ 0.41 (0.92 %) Net Assets (Cr) ₹2,105 on 28 Feb 25 Category Equity - Sectoral AMC HDFC Asset Management Company Limited Rating ☆☆☆ Risk High Expense Ratio 2.31 Sharpe Ratio -0.55 Information Ratio 0 Alpha Ratio 0 Min Investment 5,000 Min SIP Investment 300 Exit Load 0-1 Years (1%),1 Years and above(NIL) Growth of 10,000 investment over the years.
Date Value 31 Mar 20 ₹10,000 31 Mar 21 ₹17,356 31 Mar 22 ₹21,727 31 Mar 23 ₹25,279 31 Mar 24 ₹45,346 31 Mar 25 ₹47,548 Returns for HDFC Infrastructure Fund
absolute basis & more than 1 year are on CAGR (Compound Annual Growth Rate) basis. as on 17 Apr 25 Duration Returns 1 Month 9.7% 3 Month -0.2% 6 Month -8% 1 Year 5% 3 Year 28.1% 5 Year 33.8% 10 Year 15 Year Since launch Historical performance (Yearly) on absolute basis
Year Returns 2023 23% 2022 55.4% 2021 19.3% 2020 43.2% 2019 -7.5% 2018 -3.4% 2017 -29% 2016 43.3% 2015 -1.9% 2014 -2.5% Fund Manager information for HDFC Infrastructure Fund
Name Since Tenure Srinivasan Ramamurthy 12 Jan 24 1.13 Yr. Dhruv Muchhal 22 Jun 23 1.69 Yr. Data below for HDFC Infrastructure Fund as on 28 Feb 25
Equity Sector Allocation
Sector Value Industrials 38.42% Financial Services 20.62% Basic Materials 10.93% Utility 7.4% Energy 6.96% Communication Services 3.76% Health Care 1.73% Technology 0.98% Real Estate 0.94% Consumer Cyclical 0.58% Asset Allocation
Asset Class Value Cash 6.48% Equity 92.31% Debt 1.21% Top Securities Holdings / Portfolio
Name Holding Value Quantity ICICI Bank Ltd (Financial Services)
Equity, Since 31 Oct 09 | ICICIBANK7% ₹157 Cr 1,300,000 HDFC Bank Ltd (Financial Services)
Equity, Since 31 Aug 23 | HDFCBANK6% ₹121 Cr 700,000 Larsen & Toubro Ltd (Industrials)
Equity, Since 30 Jun 12 | LT6% ₹120 Cr 380,000
↑ 30,000 J Kumar Infraprojects Ltd (Industrials)
Equity, Since 31 Oct 15 | JKIL5% ₹98 Cr 1,450,000
↓ -50,000 NTPC Ltd (Utilities)
Equity, Since 31 Dec 17 | 5325553% ₹69 Cr 2,200,000 InterGlobe Aviation Ltd (Industrials)
Equity, Since 31 Dec 21 | INDIGO3% ₹67 Cr 150,000 Kalpataru Projects International Ltd (Industrials)
Equity, Since 31 Jan 23 | KPIL3% ₹67 Cr 758,285 Coal India Ltd (Energy)
Equity, Since 31 Oct 18 | COALINDIA3% ₹63 Cr 1,700,000 Reliance Industries Ltd (Energy)
Equity, Since 31 May 24 | RELIANCE3% ₹60 Cr 500,000 Bharti Airtel Ltd (Communication Services)
Equity, Since 30 Sep 20 | BHARTIARTL3% ₹55 Cr 350,000
↓ -50,000
ഇവിടെ നൽകിയിരിക്കുന്ന വിവരങ്ങൾ കൃത്യമാണെന്ന് ഉറപ്പാക്കാൻ എല്ലാ ശ്രമങ്ങളും നടത്തിയിട്ടുണ്ട്. എന്നിരുന്നാലും, ഡാറ്റയുടെ കൃത്യത സംബന്ധിച്ച് യാതൊരു ഉറപ്പും നൽകുന്നില്ല. എന്തെങ്കിലും നിക്ഷേപം നടത്തുന്നതിന് മുമ്പ് സ്കീം വിവര രേഖ ഉപയോഗിച്ച് പരിശോധിക്കുക.


AMFI Registration No. 112358 | CIN: U74999MH2016PTC282153
Shepard Technologies Pvt. Ltd. (with ARN code 112358) makes no warranties or representations, express or implied, on products offered through the platform. It accepts no liability for any damages or losses, however caused, in connection with the use of, or on the reliance of its product or related services. Terms and conditions of the website are applicable.
©2025 Shepard Technologies Private Limited. All Rights Reserved