Table of Contents
- म्युच्युअल फंडातील एकरकमी गुंतवणूक म्हणजे काय?
- 2022 - 2023 मध्ये एकरकमी गुंतवणुकीसाठी सर्वोत्तम म्युच्युअल फंड
- मागील 1 महिन्यावर आधारित सर्वोत्तम म्युच्युअल फंड
- एकरकमी गुंतवणूक करताना विचारात घ्यायच्या गोष्टी
- म्युच्युअल फंड एकरकमी परतावा कॅल्क्युलेटर
- म्युच्युअल फंडातील एकवेळच्या गुंतवणुकीचे फायदे आणि तोटे
- निष्कर्ष
Top 5 Funds
म्युच्युअल फंडात एकरकमी गुंतवणूक
तुम्हाला माहीत आहे का की तुम्ही एकरकमी रक्कम गुंतवू शकताम्युच्युअल फंड? जर होय, तर ते चांगले आहे. तथापि, जर नाही, तर काळजी करू नका. हा लेख तुम्हाला त्याच माध्यमातून मार्गदर्शन करेल. म्युच्युअल फंडातील एकरकमी गुंतवणूक म्हणजे अशी परिस्थिती जेव्हा एखादी व्यक्ती म्युच्युअल फंडात पैसे गुंतवते. येथे, ठेव अनेक वेळा होत नाही. मध्ये खूप फरक आहेSIP आणि गुंतवणुकीची एकरकमी पद्धत. तर, म्युच्युअल फंडातील एकरकमी गुंतवणूक ही संकल्पना समजून घेऊया,सर्वोत्तम म्युच्युअल फंड एकरकमी गुंतवणुकीसाठी, एकरकमी गुंतवणूक करताना विचारात घ्यायच्या गोष्टी, म्युच्युअल फंड एकरकमी परतावा कॅल्क्युलेटर आणि इतर संबंधित बाबी या लेखाद्वारे.

म्युच्युअल फंडातील एकरकमी गुंतवणूक म्हणजे काय?
म्युच्युअल फंडात एकरकमी गुंतवणूक ही एक अशी परिस्थिती आहे जिथे व्यक्तीम्युच्युअल फंडात गुंतवणूक करा फक्त एकदाच. तथापि, गुंतवणुकीच्या एसआयपी पद्धतीच्या विरूद्ध जेथे व्यक्ती एकरकमी मोडमध्ये लहान रक्कम जमा करतात, व्यक्ती लक्षणीय रक्कम जमा करतात. दुसऱ्या शब्दांत, ते एक-शॉट तंत्र आहेगुंतवणूक म्युच्युअल फंड मध्ये. एकरकमी गुंतवणुकीची पद्धत ज्या गुंतवणूकदारांकडे जास्त निधी आहे त्यांच्यासाठी योग्य आहेबँक खाते आणि अधिक कमाई करण्यासाठी चॅनेल शोधत आहातउत्पन्न म्युच्युअल फंडात गुंतवणूक करून.
2022 - 2023 मध्ये एकरकमी गुंतवणुकीसाठी सर्वोत्तम म्युच्युअल फंड
तुम्ही एकरकमी पद्धतीने म्युच्युअल फंडामध्ये गुंतवणूक करण्यापूर्वी, व्यक्तींनी विविध पॅरामीटर्स जसे की AUM, गुंतवणूक रक्कम आणि बरेच काही विचारात घेणे आवश्यक आहे. तर, या पॅरामीटर्सच्या आधारे एकरकमी गुंतवणुकीसाठी काही सर्वोत्तम म्युच्युअल फंड खालीलप्रमाणे आहेत.
इक्विटी म्युच्युअल फंडातील सर्वोत्तम एकरकमी गुंतवणूक
इक्विटी फंड अशा योजना आहेत ज्या विविध कंपन्यांच्या इक्विटी आणि इक्विटी-संबंधित साधनांमध्ये त्यांचे कॉर्पस गुंतवतात. या योजना दीर्घकालीन गुंतवणुकीसाठी चांगला पर्याय मानल्या जातात. जरी व्यक्ती इक्विटी फंडांमध्ये एकरकमी रक्कम गुंतवू शकतात तरीही इक्विटी फंडांमध्ये गुंतवणूक करण्याचे शिफारस केलेले तंत्र एकतर एसआयपीद्वारे किंवापद्धतशीर हस्तांतरण योजना (STP) मोड. एसटीपी मोडमध्ये, व्यक्ती प्रथम मोठ्या प्रमाणात पैसे जमा करतातकर्ज निधी जसेलिक्विड फंड आणि नंतर पैसे इक्विटी फंडांमध्ये नियमित अंतराने हस्तांतरित केले जातात. गुंतवणुकीसाठी विचारात घेतलेले काही इक्विटी म्युच्युअल फंड खालीलप्रमाणे आहेत.
Fund NAV Net Assets (Cr) Min Investment 3 MO (%) 6 MO (%) 1 YR (%) 3 YR (%) 5 YR (%) 2024 (%) Nippon India Small Cap Fund Growth ₹157.898
↑ 1.60 ₹55,491 5,000 -4.3 -12.7 6.7 21.1 39.2 26.1 ICICI Prudential Infrastructure Fund Growth ₹182.22
↓ -0.27 ₹7,214 5,000 2.4 -6.3 8.3 27.8 38.9 27.4 Motilal Oswal Midcap 30 Fund Growth ₹93.0829
↑ 0.70 ₹26,028 5,000 -4.9 -12.4 14.2 25.8 36.5 57.1 IDFC Infrastructure Fund Growth ₹47.851
↑ 0.17 ₹1,563 5,000 -1.7 -10.8 5.7 25.4 36.3 39.3 Nippon India Power and Infra Fund Growth ₹327.229
↓ -0.09 ₹6,849 5,000 -0.2 -10 3.8 27.8 35.8 26.9 Note: Returns up to 1 year are on absolute basis & more than 1 year are on CAGR basis. as on 22 Apr 25
Talk to our investment specialist
डेट म्युच्युअल फंडात सर्वोत्तम एकरकमी गुंतवणूक
डेट फंड त्यांच्या फंडाचे पैसे वेगवेगळ्या ठिकाणी गुंतवतातनिश्चित उत्पन्न ट्रेझरी बिले, कॉर्पोरेट सारखी साधनेबंध, आणि बरेच काही. या योजना अल्प आणि मध्यम मुदतीसाठी चांगला पर्याय मानल्या जातात. अनेक व्यक्ती डेट म्युच्युअल फंडामध्ये एकरकमी पैसे गुंतवण्याचा पर्याय निवडतात. काहीसर्वोत्तम कर्ज निधी जे एकरकमी गुंतवणुकीसाठी निवडले जाऊ शकतात ते खालीलप्रमाणे आहेत.
Fund NAV Net Assets (Cr) Min Investment 3 MO (%) 6 MO (%) 1 YR (%) 3 YR (%) 2024 (%) Debt Yield (YTM) Mod. Duration Eff. Maturity Aditya Birla Sun Life Medium Term Plan Growth ₹39.3376
↑ 0.01 ₹2,206 1,000 5.3 7.1 14.7 14.3 10.5 7.89% 3Y 7M 17D 4Y 10M 24D DSP BlackRock Credit Risk Fund Growth ₹48.7366
↑ 0.01 ₹207 1,000 15.7 17.7 22.5 14 7.8 7.81% 2Y 2M 8D 2Y 11M 12D Franklin India Credit Risk Fund Growth ₹25.3348
↑ 0.04 ₹104 5,000 2.9 5 7.5 11 0% Aditya Birla Sun Life Credit Risk Fund Growth ₹21.9558
↑ 0.01 ₹970 1,000 6.3 8.2 17.2 10.6 11.9 8.29% 2Y 5M 16D 3Y 9M 29D UTI Bond Fund Growth ₹73.4447
↑ 0.08 ₹320 1,000 3.9 5.5 11.1 10.2 8.5 7.17% 6Y 5M 1D 9Y 11M 5D Note: Returns up to 1 year are on absolute basis & more than 1 year are on CAGR basis. as on 22 Apr 25
एकरकमी गुंतवणुकीसाठी सर्वोत्तम हायब्रिड फंड
हायब्रीड फंड म्हणूनही ओळखले जातेसंतुलित निधी त्यांचे पैसे इक्विटी आणि निश्चित उत्पन्न साधनांमध्ये गुंतवा. या योजना शोधत असलेल्या व्यक्तींसाठी योग्य आहेतभांडवल नियमित उत्पन्नासह निर्मिती. संतुलित योजना म्हणूनही ओळखल्या जाणार्या, व्यक्ती संकरित योजनांमध्ये एकरकमी रक्कम गुंतवणे निवडू शकतात. एकरकमी गुंतवणुकीसाठी काही सर्वोत्कृष्ट हायब्रिड फंड खाली सूचीबद्ध आहेत.
Fund NAV Net Assets (Cr) Min Investment 3 MO (%) 6 MO (%) 1 YR (%) 3 YR (%) 5 YR (%) 2024 (%) JM Equity Hybrid Fund Growth ₹117.258
↑ 0.32 ₹768 5,000 0.9 -7.9 8.1 20.4 28.3 27 HDFC Balanced Advantage Fund Growth ₹501.785
↑ 0.39 ₹90,375 5,000 2.8 -1.2 10.1 19.1 26 16.7 UTI Multi Asset Fund Growth ₹72.055
↑ 0.34 ₹5,285 5,000 2.9 -1.5 9.7 18.1 18.5 20.7 ICICI Prudential Equity and Debt Fund Growth ₹379.33
↑ 0.10 ₹40,962 5,000 6.2 0 12.2 18 27.3 17.2 ICICI Prudential Multi-Asset Fund Growth ₹733.932
↑ 5.34 ₹55,360 5,000 5.4 2.6 13.3 17.9 26 16.1 Note: Returns up to 1 year are on absolute basis & more than 1 year are on CAGR basis. as on 22 Apr 25
एकरकमी गुंतवणुकीसाठी सर्वोत्तम इंडेक्स फंड
इंडेक्स फंडाच्या पोर्टफोलिओमध्ये शेअर्स आणि इतर साधने निर्देशांकात असतात त्याच प्रमाणात असतात. दुसऱ्या शब्दांत, या योजना निर्देशांकाच्या कामगिरीची नक्कल करतात. हे निष्क्रीयपणे व्यवस्थापित केलेले फंड आहेत आणि एकरकमी गुंतवणुकीसाठी एक चांगला पर्याय मानला जाऊ शकतो. काही उत्तमइंडेक्स फंड जे एकरकमी गुंतवणुकीसाठी निवडले जाऊ शकतात ते खालीलप्रमाणे आहेत.
Fund NAV Net Assets (Cr) 3 MO (%) 6 MO (%) 1 YR (%) 3 YR (%) 5 YR (%) 2024 (%) LIC MF Index Fund Sensex Growth ₹148.336
↑ 0.35 ₹84 4.5 -2.4 8.7 11.3 21 8.2 Nippon India Index Fund - Sensex Plan Growth ₹40.2569
↑ 0.09 ₹839 4.7 -2.1 9.3 11.8 21.6 8.9 SBI Nifty Index Fund Growth ₹212.351
↑ 0.36 ₹9,192 4.8 -2.5 9.7 12.2 22.5 9.5 IDBI Nifty Index Fund Growth ₹36.2111
↓ -0.02 ₹208 9.1 11.9 16.2 20.3 11.7 Franklin India Index Fund Nifty Plan Growth ₹193.9
↑ 0.33 ₹701 4.8 -2.5 9.6 12.1 22.1 9.5 Note: Returns up to 1 year are on absolute basis & more than 1 year are on CAGR basis. as on 22 Apr 25
मागील 1 महिन्यावर आधारित सर्वोत्तम म्युच्युअल फंड
"The primary investment objective of the Scheme is to seek capital appreciation by investing predominantly in units of MLIIF - WGF. The Scheme may, at the discretion of the Investment Manager, also invest in the units of other similar overseas mutual fund schemes, which may constitute a significant part of its corpus. The Scheme may also invest a certain portion of its corpus in money market securities and/or units of money market/liquid schemes of DSP Merrill Lynch Mutual Fund, in order to meet liquidity requirements from time to time. However, there is no assurance that the investment objective of the Scheme will be realized." DSP BlackRock World Gold Fund is a Equity - Global fund was launched on 14 Sep 07. It is a fund with High risk and has given a Below is the key information for DSP BlackRock World Gold Fund Returns up to 1 year are on An Open ended Fund of Funds Scheme with the investment objective to provide returns that tracks returns provided by Birla Sun Life Gold ETF (BSL Gold ETF). Aditya Birla Sun Life Gold Fund is a Gold - Gold fund was launched on 20 Mar 12. It is a fund with Moderately High risk and has given a Below is the key information for Aditya Birla Sun Life Gold Fund Returns up to 1 year are on Seek capital appreciation by investing predominantly in equity and equity related securities of indian companies engaged in banking and financial Services. Sundaram Financial Services Opportunities Fund is a Equity - Sectoral fund was launched on 10 Jun 08. It is a fund with High risk and has given a Below is the key information for Sundaram Financial Services Opportunities Fund Returns up to 1 year are on To provide returns that closely corresponds to returns provided by Invesco India Gold Exchange Traded Fund. Invesco India Gold Fund is a Gold - Gold fund was launched on 5 Dec 11. It is a fund with Moderately High risk and has given a Below is the key information for Invesco India Gold Fund Returns up to 1 year are on The investment objective of the Scheme will be to generate returns that correspond closely to the returns generated by IDBI Gold Exchange Traded Fund (IDBI GOLD ETF). IDBI Gold Fund is a Gold - Gold fund was launched on 14 Aug 12. It is a fund with Moderately High risk and has given a Below is the key information for IDBI Gold Fund Returns up to 1 year are on 1. DSP BlackRock World Gold Fund
CAGR/Annualized return of 6.4% since its launch. Ranked 11 in Global category. Return for 2024 was 15.9% , 2023 was 7% and 2022 was -7.7% . DSP BlackRock World Gold Fund
Growth Launch Date 14 Sep 07 NAV (17 Apr 25) ₹29.7321 ↓ -0.43 (-1.42 %) Net Assets (Cr) ₹1,146 on 31 Mar 25 Category Equity - Global AMC DSP BlackRock Invmt Managers Pvt. Ltd. Rating ☆☆☆ Risk High Expense Ratio 1.35 Sharpe Ratio 1.49 Information Ratio -0.12 Alpha Ratio 0.84 Min Investment 1,000 Min SIP Investment 500 Exit Load 0-12 Months (1%),12 Months and above(NIL) Growth of 10,000 investment over the years.
Date Value 31 Mar 20 ₹10,000 31 Mar 21 ₹13,604 31 Mar 22 ₹15,152 31 Mar 23 ₹14,266 31 Mar 24 ₹13,920 31 Mar 25 ₹20,792 Returns for DSP BlackRock World Gold Fund
absolute basis & more than 1 year are on CAGR (Compound Annual Growth Rate) basis. as on 17 Apr 25 Duration Returns 1 Month 14.9% 3 Month 37.8% 6 Month 27.4% 1 Year 63.6% 3 Year 14.5% 5 Year 13.1% 10 Year 15 Year Since launch 6.4% Historical performance (Yearly) on absolute basis
Year Returns 2024 15.9% 2023 7% 2022 -7.7% 2021 -9% 2020 31.4% 2019 35.1% 2018 -10.7% 2017 -4% 2016 52.7% 2015 -18.5% Fund Manager information for DSP BlackRock World Gold Fund
Name Since Tenure Jay Kothari 1 Mar 13 12.01 Yr. Data below for DSP BlackRock World Gold Fund as on 31 Mar 25
Equity Sector Allocation
Sector Value Basic Materials 92.86% Asset Allocation
Asset Class Value Cash 3.12% Equity 93.16% Debt 0.02% Other 3.7% Top Securities Holdings / Portfolio
Name Holding Value Quantity BGF World Gold I2
Investment Fund | -80% ₹844 Cr 1,880,211
↓ -73,489 VanEck Gold Miners ETF
- | GDX19% ₹199 Cr 573,719 Treps / Reverse Repo Investments
CBLO/Reverse Repo | -2% ₹19 Cr Net Receivables/Payables
CBLO | -0% -₹4 Cr 2. Aditya Birla Sun Life Gold Fund
CAGR/Annualized return of 8.4% since its launch. Return for 2024 was 18.7% , 2023 was 14.5% and 2022 was 12.3% . Aditya Birla Sun Life Gold Fund
Growth Launch Date 20 Mar 12 NAV (22 Apr 25) ₹29.0362 ↑ 0.42 (1.47 %) Net Assets (Cr) ₹555 on 31 Mar 25 Category Gold - Gold AMC Birla Sun Life Asset Management Co Ltd Rating ☆☆☆ Risk Moderately High Expense Ratio 0.51 Sharpe Ratio 1.65 Information Ratio 0 Alpha Ratio 0 Min Investment 100 Min SIP Investment 100 Exit Load 0-365 Days (1%),365 Days and above(NIL) Growth of 10,000 investment over the years.
Date Value 31 Mar 20 ₹10,000 31 Mar 21 ₹9,940 31 Mar 22 ₹11,371 31 Mar 23 ₹13,025 31 Mar 24 ₹14,416 31 Mar 25 ₹18,985 Returns for Aditya Birla Sun Life Gold Fund
absolute basis & more than 1 year are on CAGR (Compound Annual Growth Rate) basis. as on 17 Apr 25 Duration Returns 1 Month 10.4% 3 Month 21.5% 6 Month 24% 1 Year 30.7% 3 Year 21% 5 Year 13.5% 10 Year 15 Year Since launch 8.4% Historical performance (Yearly) on absolute basis
Year Returns 2024 18.7% 2023 14.5% 2022 12.3% 2021 -5% 2020 26% 2019 21.3% 2018 6.8% 2017 1.6% 2016 11.5% 2015 -7.2% Fund Manager information for Aditya Birla Sun Life Gold Fund
Name Since Tenure Priya Sridhar 31 Dec 24 0.16 Yr. Data below for Aditya Birla Sun Life Gold Fund as on 31 Mar 25
Asset Allocation
Asset Class Value Cash 1.87% Other 98.13% Top Securities Holdings / Portfolio
Name Holding Value Quantity Aditya BSL Gold ETF
- | -100% ₹511 Cr 67,773,270
↑ 3,265,683 Clearing Corporation Of India Limited
CBLO/Reverse Repo | -1% ₹3 Cr Net Receivables / (Payables)
Net Current Assets | -0% -₹2 Cr 3. Sundaram Financial Services Opportunities Fund
CAGR/Annualized return of 14.9% since its launch. Ranked 23 in Sectoral category. Return for 2024 was 7.1% , 2023 was 31.1% and 2022 was 16.8% . Sundaram Financial Services Opportunities Fund
Growth Launch Date 10 Jun 08 NAV (22 Apr 25) ₹103.864 ↑ 0.15 (0.14 %) Net Assets (Cr) ₹1,415 on 31 Mar 25 Category Equity - Sectoral AMC Sundaram Asset Management Company Ltd Rating ☆☆☆ Risk High Expense Ratio 2.24 Sharpe Ratio 0.15 Information Ratio 0.62 Alpha Ratio -10.88 Min Investment 100,000 Min SIP Investment 100 Exit Load 0-12 Months (1%),12 Months and above(NIL) Growth of 10,000 investment over the years.
Date Value 31 Mar 20 ₹10,000 31 Mar 21 ₹17,095 31 Mar 22 ₹18,755 31 Mar 23 ₹20,630 31 Mar 24 ₹28,468 31 Mar 25 ₹30,814 Returns for Sundaram Financial Services Opportunities Fund
absolute basis & more than 1 year are on CAGR (Compound Annual Growth Rate) basis. as on 17 Apr 25 Duration Returns 1 Month 10.2% 3 Month 13.8% 6 Month 5% 1 Year 17.1% 3 Year 21.2% 5 Year 26.6% 10 Year 15 Year Since launch 14.9% Historical performance (Yearly) on absolute basis
Year Returns 2024 7.1% 2023 31.1% 2022 16.8% 2021 15.3% 2020 2.7% 2019 26.4% 2018 -3.7% 2017 33.3% 2016 12.8% 2015 -9% Fund Manager information for Sundaram Financial Services Opportunities Fund
Name Since Tenure Rohit Seksaria 30 Dec 17 7.17 Yr. Ashish Aggarwal 1 Jan 22 3.16 Yr. Data below for Sundaram Financial Services Opportunities Fund as on 31 Mar 25
Equity Sector Allocation
Sector Value Financial Services 94.17% Asset Allocation
Asset Class Value Cash 3.84% Equity 95.06% Debt 1.09% Top Securities Holdings / Portfolio
Name Holding Value Quantity HDFC Bank Ltd (Financial Services)
Equity, Since 31 Dec 08 | HDFCBANK18% ₹241 Cr 1,390,056
↑ 7,660 ICICI Bank Ltd (Financial Services)
Equity, Since 30 Jun 10 | ICICIBANK12% ₹161 Cr 1,339,673
↑ 10,584 Axis Bank Ltd (Financial Services)
Equity, Since 28 Feb 10 | 53221510% ₹128 Cr 1,259,449 State Bank of India (Financial Services)
Equity, Since 31 Dec 08 | SBIN5% ₹65 Cr 949,469
↑ 64,175 Shriram Finance Ltd (Financial Services)
Equity, Since 30 Sep 23 | SHRIRAMFIN5% ₹64 Cr 1,036,445 IndusInd Bank Ltd (Financial Services)
Equity, Since 30 Jun 20 | INDUSINDBK4% ₹60 Cr 601,270 Bajaj Finance Ltd (Financial Services)
Equity, Since 31 Jul 18 | 5000344% ₹58 Cr 68,102
↓ -5,238 Ujjivan Small Finance Bank Ltd Ordinary Shares (Financial Services)
Equity, Since 31 May 24 | UJJIVANSFB4% ₹49 Cr 15,383,384
↑ 412,458 CSB Bank Ltd Ordinary Shares (Financial Services)
Equity, Since 30 Jun 20 | CSBBANK4% ₹48 Cr 1,697,765
↑ 3,396 PNB Housing Finance Ltd (Financial Services)
Equity, Since 31 Jul 24 | PNBHOUSING4% ₹47 Cr 616,144
↑ 39,470 4. Invesco India Gold Fund
CAGR/Annualized return of 7.9% since its launch. Return for 2024 was 18.8% , 2023 was 14.5% and 2022 was 12.8% . Invesco India Gold Fund
Growth Launch Date 5 Dec 11 NAV (22 Apr 25) ₹28.2018 ↑ 0.49 (1.78 %) Net Assets (Cr) ₹142 on 31 Mar 25 Category Gold - Gold AMC Invesco Asset Management (India) Private Ltd Rating ☆☆☆ Risk Moderately High Expense Ratio 0.45 Sharpe Ratio 1.6 Information Ratio 0 Alpha Ratio 0 Min Investment 5,000 Min SIP Investment 500 Exit Load 0-6 Months (2%),6-12 Months (1%),12 Months and above(NIL) Growth of 10,000 investment over the years.
Date Value 31 Mar 20 ₹10,000 31 Mar 21 ₹10,219 31 Mar 22 ₹11,561 31 Mar 23 ₹13,495 31 Mar 24 ₹14,930 31 Mar 25 ₹19,501 Returns for Invesco India Gold Fund
absolute basis & more than 1 year are on CAGR (Compound Annual Growth Rate) basis. as on 17 Apr 25 Duration Returns 1 Month 9.9% 3 Month 21.9% 6 Month 22.9% 1 Year 29.6% 3 Year 21.1% 5 Year 14.2% 10 Year 15 Year Since launch 7.9% Historical performance (Yearly) on absolute basis
Year Returns 2024 18.8% 2023 14.5% 2022 12.8% 2021 -5.5% 2020 27.2% 2019 21.4% 2018 6.6% 2017 1.3% 2016 21.6% 2015 -15.1% Fund Manager information for Invesco India Gold Fund
Name Since Tenure Krishna Cheemalapati 1 Mar 25 0 Yr. Data below for Invesco India Gold Fund as on 31 Mar 25
Asset Allocation
Asset Class Value Cash 3.81% Other 96.19% Top Securities Holdings / Portfolio
Name Holding Value Quantity Invesco India Gold ETF
- | -98% ₹124 Cr 166,343
↑ 11,350 Triparty Repo
CBLO/Reverse Repo | -3% ₹4 Cr Net Receivables / (Payables)
Net Current Assets | -1% -₹1 Cr 5. IDBI Gold Fund
CAGR/Annualized return of 7.7% since its launch. Return for 2024 was 18.7% , 2023 was 14.8% and 2022 was 12% . IDBI Gold Fund
Growth Launch Date 14 Aug 12 NAV (22 Apr 25) ₹26.3342 ↑ 0.82 (3.23 %) Net Assets (Cr) ₹104 on 31 Mar 25 Category Gold - Gold AMC IDBI Asset Management Limited Rating Risk Moderately High Expense Ratio 0.65 Sharpe Ratio 1.62 Information Ratio 0 Alpha Ratio 0 Min Investment 5,000 Min SIP Investment 500 Exit Load 0-12 Months (1%),12 Months and above(NIL) Growth of 10,000 investment over the years.
Date Value 31 Mar 20 ₹10,000 31 Mar 21 ₹10,000 31 Mar 22 ₹11,326 31 Mar 23 ₹13,151 31 Mar 24 ₹14,541 31 Mar 25 ₹19,184 Returns for IDBI Gold Fund
absolute basis & more than 1 year are on CAGR (Compound Annual Growth Rate) basis. as on 17 Apr 25 Duration Returns 1 Month 9.8% 3 Month 21.3% 6 Month 23.2% 1 Year 29.6% 3 Year 21.2% 5 Year 14.3% 10 Year 15 Year Since launch 7.7% Historical performance (Yearly) on absolute basis
Year Returns 2024 18.7% 2023 14.8% 2022 12% 2021 -4% 2020 24.2% 2019 21.6% 2018 5.8% 2017 1.4% 2016 8.3% 2015 -8.7% Fund Manager information for IDBI Gold Fund
Name Since Tenure Sumit Bhatnagar 1 Jun 24 0.75 Yr. Data below for IDBI Gold Fund as on 31 Mar 25
Asset Allocation
Asset Class Value Cash 1.33% Other 98.67% Top Securities Holdings / Portfolio
Name Holding Value Quantity LIC MF Gold ETF
- | -99% ₹92 Cr 119,347
↑ 12,271 Treps
CBLO/Reverse Repo | -1% ₹1 Cr Net Receivables / (Payables)
Net Current Assets | -1% -₹1 Cr
एकरकमी गुंतवणूक करताना विचारात घ्यायच्या गोष्टी
म्युच्युअल फंडामध्ये गुंतवणूक करण्यापूर्वी व्यक्तींनी अनेक बाबींची काळजी घेणे आवश्यक आहे. यात समाविष्ट आहे:
मार्केटची वेळ
एकरकमी गुंतवणुकीचा प्रश्न येतो तेव्हा, व्यक्तींना नेहमी शोधण्याची गरज असतेबाजार विशेषत: इक्विटी-आधारित फंडांच्या संदर्भात वेळ. एकरकमी गुंतवणुकीची चांगली वेळ म्हणजे जेव्हा बाजार कमी असतात आणि त्यांना लवकरच प्रशंसा मिळण्यास वाव असतो. तथापि, जर बाजार आधीच शिखरावर असेल तर, एकरकमी गुंतवणुकीपासून दूर राहणे चांगले.
विविधीकरण
एकरकमी गुंतवणुक करण्यापूर्वी वैविध्यता ही एक महत्त्वाची बाब आहे ज्याचा विचार करणे आवश्यक आहे. एकरकमी गुंतवणुकीच्या बाबतीत व्यक्तींनी त्यांच्या गुंतवणुकीत अनेक मार्गांनी विस्तार करून विविधता आणली पाहिजे. हे सुनिश्चित करण्यात मदत करेल की त्यांच्या एकूण पोर्टफोलिओपैकी एक योजना चांगली कामगिरी करत नसली तरीही.
तुमच्या उद्दिष्टानुसार तुमची गुंतवणूक करा
व्यक्ती जी कोणतीही गुंतवणूक करतात ती विशिष्ट उद्दिष्ट साध्य करण्यासाठी असते. म्हणून, व्यक्तींनी योजनेचा दृष्टीकोन त्याच्याशी सुसंगत आहे की नाही हे तपासावेगुंतवणूकदारचे उद्दिष्ट. येथे, व्यक्तींनी विविध पॅरामीटर्स शोधले पाहिजेत जसे कीCAGR योजनेत गुंतवणूक करण्यापूर्वी परतावा, संपूर्ण परतावा, कर आकारणीचा प्रभाव आणि बरेच काही.
विमोचन योग्य वेळी केले पाहिजे
व्यक्तींनी त्यांचे करावेविमोचन एकरकमी गुंतवणूक योग्य वेळी. जरी ते अद्याप गुंतवणुकीच्या उद्दिष्टानुसार असू शकते; व्यक्तींनी ज्या योजनेत गुंतवणूक करण्याची योजना आखली आहे त्याचा वेळेवर आढावा घ्यावा. तथापि, त्यांना त्यांची गुंतवणूक दीर्घ कालावधीसाठी ठेवण्याची देखील आवश्यकता आहे जेणेकरून ते जास्तीत जास्त लाभ घेऊ शकतील.
म्युच्युअल फंड एकरकमी परतावा कॅल्क्युलेटर
म्युच्युअल फंड एकरकमी परतावा कॅल्क्युलेटर एखाद्या व्यक्तीची एकरकमी गुंतवणूक दिलेल्या कालावधीत कशी वाढते हे दर्शविण्यास मदत करते. एकरकमी कॅल्क्युलेटरमध्ये इनपुट करणे आवश्यक असलेल्या काही डेटामध्ये गुंतवणुकीचा कालावधी, प्रारंभिक गुंतवणूक रक्कम, दीर्घकालीन अपेक्षित वाढीचा दर आणि बरेच काही समाविष्ट आहे. म्युच्युअल फंड एकरकमी परतावा कॅल्क्युलेटरचे उदाहरण खालीलप्रमाणे आहे.
चित्रण
एकरकमी गुंतवणूक: 25 रुपये,000
गुंतवणुकीचा कालावधी: 15 वर्षे
दीर्घकालीन वाढीचा दर (अंदाजे): १५%
एकरकमी कॅल्क्युलेटरनुसार अपेक्षित परतावा: INR 2,03,427
गुंतवणुकीवर निव्वळ नफा: INR 1,78,427
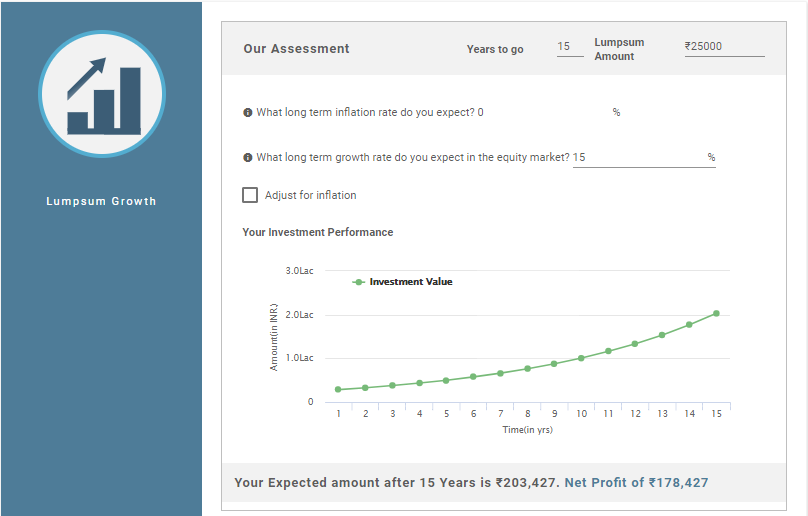
अशा प्रकारे, वरील गणना दर्शवते की तुमच्या गुंतवणुकीवरील गुंतवणुकीवर निव्वळ नफा INR 1,78,427 आहे तर तुमच्या गुंतवणुकीचे एकूण मूल्य INR 2,03,427 आहे..
म्युच्युअल फंडातील एकवेळच्या गुंतवणुकीचे फायदे आणि तोटे
SIP प्रमाणेच, एकरकमी गुंतवणूकीचे स्वतःचे फायदे आणि तोटे आहेत. तर, हे फायदे आणि तोटे पाहू.
फायदे
एकरकमी गुंतवणुकीचे फायदे खालीलप्रमाणे आहेत.
- मोठी रक्कम गुंतवा: व्यक्ती म्युच्युअल फंडामध्ये मोठ्या प्रमाणात गुंतवणूक करू शकतात आणि निधी निष्क्रिय ठेवण्याऐवजी जास्त परतावा मिळवू शकतात.
- दीर्घ मुदतीसाठी आदर्श: एकरकमी गुंतवणुकीची पद्धत दीर्घकालीन गुंतवणुकीसाठी विशेषत: इक्विटी फंडांच्या बाबतीत चांगली आहे. तथापि, कर्ज निधीच्या बाबतीत, कार्यकाळ अल्प किंवा मध्यम-मुदतीचा असू शकतो
- सुविधा: गुंतवणुकीची एकरकमी पद्धत सोयीस्कर आहे कारण पेमेंट एकदाच केले जाते आणि नियमित अंतराने वजा केले जात नाही.
तोटे
एकरकमी गुंतवणुकीचे तोटे आहेत:
- अनियमित गुंतवणूक: एकरकमी गुंतवणूक ही गुंतवणूकदाराची नियमित बचत सुनिश्चित करत नाही कारण ती नियमित बचतीची सवय लावत नाही.
- उच्च धोका: एकरकमी गुंतवणुकीत, वेळ पाहणे महत्त्वाचे आहे. कारण एकरकमी पद्धतीने गुंतवणूक फक्त एकदाच केली जाते आणि नियमित अंतराने नाही. म्हणून, जर व्यक्तींनी वेळेचा विचार केला नाही तर त्यांचे नुकसान होऊ शकते.
निष्कर्ष
अशाप्रकारे, वरील पॉइंटर्सवरून असे म्हणता येईल की म्युच्युअल फंडामध्ये गुंतवणुकीसाठी एकरकमी मोड देखील एक चांगला मार्ग आहे. तथापि, योजनेमध्ये एकरकमी रक्कम गुंतवताना व्यक्तींनी आत्मविश्वास बाळगणे आवश्यक आहे. नसल्यास, ते गुंतवणुकीचा SIP मोड निवडू शकतात. याशिवाय, लोकांनी गुंतवणूक करण्यापूर्वी योजनेचे स्वरूप समजून घेतले पाहिजे. आवश्यक असल्यास, ते एआर्थिक सल्लागार. हे त्यांना त्यांचे पैसे सुरक्षित असल्याची खात्री करण्यास मदत करेल आणि त्यांची उद्दिष्टे वेळेवर पूर्ण होतील.
येथे प्रदान केलेली माहिती अचूक असल्याची खात्री करण्यासाठी सर्व प्रयत्न केले गेले आहेत. तथापि, डेटाच्या अचूकतेबद्दल कोणतीही हमी दिली जात नाही. कृपया कोणतीही गुंतवणूक करण्यापूर्वी योजना माहिती दस्तऐवजासह सत्यापित करा.
You Might Also Like


")
AMFI Registration No. 112358 | CIN: U74999MH2016PTC282153
Shepard Technologies Pvt. Ltd. (with ARN code 112358) makes no warranties or representations, express or implied, on products offered through the platform. It accepts no liability for any damages or losses, however caused, in connection with the use of, or on the reliance of its product or related services. Terms and conditions of the website are applicable.
©2025 Shepard Technologies Private Limited. All Rights Reserved