सर्वोत्कृष्ट डेट म्युच्युअल फंड 2022
सर्वोत्कृष्ट कर्ज निधी गुंतवणूकीच्या कालावधीनुसार बदलतातगुंतवणूकदार. सर्वोत्कृष्ट निवडताना गुंतवणूकदारांनी त्यांच्या गुंतवणुकीच्या क्षितिजावर स्पष्ट असणे आवश्यक आहेकर्ज निधी त्यांच्या गुंतवणुकीसाठी आणि व्याजदर परिस्थितीमध्ये देखील घटक.
खूप कमी होल्डिंग कालावधी असलेल्या गुंतवणूकदारांसाठी, काही दिवस ते एक महिना म्हणा,लिक्विड फंड आणि अति-अल्पकालीन निधी संबंधित असू शकते. जेव्हा वेळ क्षितिज एक ते दोन वर्षांचा असतो तेव्हा अल्पकालीन निधी हे इच्छित साधन असू शकते. दीर्घ मुदतीसाठी, 3 वर्षांहून अधिक काळासाठी, दीर्घकालीन डेट फंड हे गुंतवणूकदारांचे सर्वाधिक पसंतीचे साधन आहेत, विशेषत: घसरलेल्या व्याजदराच्या वेळी. सर्वात महत्त्वाचे म्हणजे, डेट फंड पेक्षा कमी धोकादायक असल्याचे सिद्ध झाले आहेइक्विटी अल्पकालीन गुंतवणूक शोधत असताना, तथापि, दीर्घकालीन उत्पन्न निधीची अस्थिरता इक्विटीशी जुळू शकते.

डेट फंड सरकारी सिक्युरिटीज, ट्रेझरी बिले, कॉर्पोरेट यांसारख्या निश्चित उत्पन्न साधनांमध्ये गुंतवणूक करतात म्हणूनबंध, इत्यादी, त्यांच्याकडे कालांतराने सातत्यपूर्ण आणि नियमित परतावा निर्माण करण्याची क्षमता आहे. तथापि, गुंतवणुकीसाठी सर्वोत्तम डेट फंड निवडण्यापूर्वी अनेक गुणात्मक आणि परिमाणात्मक घटक समजून घेणे आवश्यक आहे, उदा - AUM, सरासरी परिपक्वता, कर आकारणी, पोर्टफोलिओची क्रेडिट गुणवत्ता इ. खाली आम्ही शीर्ष 5 सर्वोत्तम डेट फंडांची यादी केली आहे. डेट फंडाच्या विविध श्रेणींमध्ये गुंतवणूक करण्यासाठी -सर्वोत्तम लिक्विड फंड, सर्वोत्तम अल्ट्रा शॉर्ट टर्म फंड,सर्वोत्तम अल्पकालीन निधी, सर्वोत्तम दीर्घकालीन निधी आणि सर्वोत्तमगिल्ट फंड 2022 - 2023 मध्ये गुंतवणूक करा.
डेट म्युच्युअल फंडात गुंतवणूक का करावी?
a नियमित उत्पन्न मिळविण्यासाठी डेट फंड ही एक आदर्श गुंतवणूक मानली जाते. उदाहरणार्थ, लाभांश पेआउट निवडणे हा नियमित उत्पन्नाचा पर्याय असू शकतो.
b डेट फंडांमध्ये, गुंतवणूकदार कोणत्याही वेळी गुंतवणुकीतून आवश्यक पैसे काढू शकतात आणि उर्वरित पैसे गुंतवू शकतात.
c डेट फंड मोठ्या प्रमाणावर सरकारी सिक्युरिटीज, कॉर्पोरेट डेट आणि इतर सिक्युरिटीज जसे की ट्रेझरी बिले इत्यादींमध्ये गुंतवणूक करत असल्याने, त्यांना इक्विटी बाजारातील अस्थिरतेचा परिणाम होत नाही.
d जर एखादा गुंतवणूकदार अल्प-मुदतीसाठी साध्य करण्याचा विचार करत असेलआर्थिक उद्दिष्टे किंवा कमी कालावधीसाठी गुंतवणूक करा मग डेट फंड हा चांगला पर्याय असू शकतो. लिक्विड फंड, अल्ट्रा शॉर्ट टर्म फंड आणि शॉर्ट टर्म इन्कम फंड हे इच्छित पर्याय असू शकतात.
ई डेट फंडांमध्ये, गुंतवणूकदार एक पद्धतशीर पैसे काढण्याची योजना सुरू करून दर महिन्याला निश्चित उत्पन्न मिळवू शकतात (SWP याच्या उलट आहेSIP /कृपया) मासिक आधारावर निश्चित रक्कम काढणे. तसेच, जेव्हा आवश्यक असेल तेव्हा तुम्ही SWP ची रक्कम बदलू शकता.
डेट म्युच्युअल फंडातील जोखीम
असतानागुंतवणूक डेट फंडांमध्ये, गुंतवणूकदारांनी त्यांच्याशी संबंधित दोन प्रमुख जोखमींबद्दल सावध असले पाहिजे- क्रेडिट जोखीम आणि व्याज जोखीम.
a उधारीची जोखीम
जेव्हा कर्जाची साधने जारी केलेली कंपनी नियमित पेमेंट करत नाही तेव्हा क्रेडिट जोखीम उद्भवते. अशा परिस्थितीत, फंडाचा पोर्टफोलिओमध्ये किती भाग आहे यावर त्याचा फंडावर मोठा परिणाम होतो. म्हणून, अधिक रेटिंग असलेल्या कर्ज साधनांमध्ये असण्याची सूचना केली जाते. अएएए कमी किंवा नगण्य पेमेंटसह रेटिंग ही सर्वोच्च गुणवत्ता मानली जातेअविचल जोखीम.
b व्याज जोखीम
व्याजदर जोखीम प्रचलित व्याजदरातील बदलामुळे बाँडच्या किमतीतील बदलास सूचित करते. जेव्हा अर्थव्यवस्थेत व्याजदर वाढतात तेव्हा रोख्यांच्या किमती खाली येतात आणि त्याउलट. फंडाच्या पोर्टफोलिओची मॅच्युरिटी जितकी जास्त असेल तितका तो व्याजदराच्या जोखमीसाठी अधिक प्रवण असतो. त्यामुळे वाढत्या व्याजदराच्या परिस्थितीत, कमी मुदतीच्या कर्ज निधीसाठी जाण्याचा सल्ला दिला जातो. आणि घसरलेल्या व्याजदर परिस्थितीत उलट.
डेट म्युच्युअल फंड कर आकारणी
डेट फंडावरील कराची गणना खालील पद्धतीने केली जाते-
a शॉर्ट टर्म कॅपिटल गेन
जर कर्ज गुंतवणुकीचा होल्डिंग कालावधी 36 महिन्यांपेक्षा कमी असेल, तर ती अल्प-मुदतीची गुंतवणूक म्हणून वर्गीकृत केली जाते आणि त्यावर व्यक्तीच्या कर स्लॅबनुसार कर आकारला जातो.
b दीर्घकालीन भांडवली नफा
जर कर्ज गुंतवणुकीचा होल्डिंग कालावधी 36 महिन्यांपेक्षा जास्त असेल, तर ती दीर्घकालीन गुंतवणूक म्हणून वर्गीकृत केली जाते आणि इंडेक्सेशन लाभासह 20% कर आकारला जातो.
| भांडवल फायदा होतो | गुंतवणूक होल्डिंग नफा | कर आकारणी |
|---|---|---|
| अल्पकालीनभांडवली नफा | 36 महिन्यांपेक्षा कमी | व्यक्तीच्या कर स्लॅबनुसार |
| दीर्घकालीन भांडवली नफा | 36 महिन्यांहून अधिक | इंडेक्सेशन लाभांसह 20% |
Talk to our investment specialist
आर्थिक वर्ष 22 - 23 गुंतवणुकीसाठी भारतातील सर्वोत्तम डेट म्युच्युअल फंड
शीर्ष 5 लिक्विड म्युच्युअल फंड
शीर्षस्थानीद्रव एयूएम/निव्वळ मालमत्ता > 10 असलेले निधी,000 कोटी.Fund NAV Net Assets (Cr) Min Investment 1 MO (%) 3 MO (%) 6 MO (%) 1 YR (%) 2024 (%) Debt Yield (YTM) Mod. Duration Eff. Maturity Axis Liquid Fund Growth ₹2,982.84
↑ 0.43 ₹35,360 500 0.5 1.4 2.9 6.6 7.4 6% 1M 6D 1M 8D Tata Liquid Fund Growth ₹4,218.86
↑ 0.59 ₹22,366 5,000 0.5 1.4 2.9 6.6 7.3 6.09% 2M 2D 2M 2D Aditya Birla Sun Life Liquid Fund Growth ₹431.623
↑ 0.06 ₹56,938 5,000 0.5 1.4 2.9 6.6 7.3 6.11% 2M 12D 2M 12D Invesco India Liquid Fund Growth ₹3,681.73
↑ 0.53 ₹16,638 5,000 0.5 1.4 2.9 6.6 7.4 5.95% 1M 8D 1M 8D Nippon India Liquid Fund Growth ₹6,536.55
↑ 0.91 ₹30,230 100 0.5 1.4 2.8 6.5 7.3 6.06% 1M 9D 1M 11D Note: Returns up to 1 year are on absolute basis & more than 1 year are on CAGR basis. as on 12 Dec 25 Research Highlights & Commentary of 5 Funds showcased
Commentary Axis Liquid Fund Tata Liquid Fund Aditya Birla Sun Life Liquid Fund Invesco India Liquid Fund Nippon India Liquid Fund Point 1 Upper mid AUM (₹35,360 Cr). Bottom quartile AUM (₹22,366 Cr). Highest AUM (₹56,938 Cr). Bottom quartile AUM (₹16,638 Cr). Lower mid AUM (₹30,230 Cr). Point 2 Established history (16+ yrs). Established history (21+ yrs). Established history (21+ yrs). Established history (19+ yrs). Oldest track record among peers (22 yrs). Point 3 Top rated. Rating: 4★ (upper mid). Rating: 4★ (lower mid). Rating: 4★ (bottom quartile). Rating: 4★ (bottom quartile). Point 4 Risk profile: Low. Risk profile: Low. Risk profile: Low. Risk profile: Low. Risk profile: Low. Point 5 1Y return: 6.60% (top quartile). 1Y return: 6.56% (upper mid). 1Y return: 6.56% (lower mid). 1Y return: 6.56% (bottom quartile). 1Y return: 6.53% (bottom quartile). Point 6 1M return: 0.46% (top quartile). 1M return: 0.46% (lower mid). 1M return: 0.46% (bottom quartile). 1M return: 0.46% (upper mid). 1M return: 0.46% (bottom quartile). Point 7 Sharpe: 3.13 (top quartile). Sharpe: 2.83 (lower mid). Sharpe: 2.76 (bottom quartile). Sharpe: 2.93 (upper mid). Sharpe: 2.59 (bottom quartile). Point 8 Information ratio: 0.00 (top quartile). Information ratio: 0.00 (upper mid). Information ratio: 0.00 (lower mid). Information ratio: 0.00 (bottom quartile). Information ratio: 0.00 (bottom quartile). Point 9 Yield to maturity (debt): 6.00% (bottom quartile). Yield to maturity (debt): 6.09% (upper mid). Yield to maturity (debt): 6.11% (top quartile). Yield to maturity (debt): 5.95% (bottom quartile). Yield to maturity (debt): 6.06% (lower mid). Point 10 Modified duration: 0.10 yrs (top quartile). Modified duration: 0.17 yrs (bottom quartile). Modified duration: 0.20 yrs (bottom quartile). Modified duration: 0.11 yrs (upper mid). Modified duration: 0.11 yrs (lower mid). Axis Liquid Fund
Tata Liquid Fund
Aditya Birla Sun Life Liquid Fund
Invesco India Liquid Fund
Nippon India Liquid Fund
टॉप 5 अल्ट्रा शॉर्ट टर्म बाँड म्युच्युअल फंड
शीर्षस्थानीअल्ट्रा शॉर्ट बाँड एयूएम/निव्वळ मालमत्ता > 1,000 कोटी असलेले निधी.Fund NAV Net Assets (Cr) Min Investment 3 MO (%) 6 MO (%) 1 YR (%) 3 YR (%) 2024 (%) Debt Yield (YTM) Mod. Duration Eff. Maturity Aditya Birla Sun Life Savings Fund Growth ₹564.439
↑ 0.06 ₹22,389 1,000 1.5 3.1 7.5 7.5 7.9 6.81% 5M 19D 6M 22D UTI Ultra Short Term Fund Growth ₹4,349.32
↑ 0.50 ₹4,097 5,000 1.4 2.8 6.7 6.9 7.2 6.63% 5M 15D 6M 13D ICICI Prudential Ultra Short Term Fund Growth ₹28.483
↑ 0.00 ₹17,841 5,000 1.5 3 7.1 7.2 7.5 6.64% 4M 24D 6M 11D SBI Magnum Ultra Short Duration Fund Growth ₹6,140.22
↑ 0.81 ₹14,505 5,000 1.5 3 7 7.1 7.4 6.39% 4M 20D 5M 26D Invesco India Ultra Short Term Fund Growth ₹2,768.44
↑ 0.36 ₹1,259 5,000 1.4 2.8 6.9 7 7.5 6.37% 4M 23D 5M 2D Note: Returns up to 1 year are on absolute basis & more than 1 year are on CAGR basis. as on 12 Dec 25 Research Highlights & Commentary of 5 Funds showcased
Commentary Aditya Birla Sun Life Savings Fund UTI Ultra Short Term Fund ICICI Prudential Ultra Short Term Fund SBI Magnum Ultra Short Duration Fund Invesco India Ultra Short Term Fund Point 1 Highest AUM (₹22,389 Cr). Bottom quartile AUM (₹4,097 Cr). Upper mid AUM (₹17,841 Cr). Lower mid AUM (₹14,505 Cr). Bottom quartile AUM (₹1,259 Cr). Point 2 Established history (22+ yrs). Established history (22+ yrs). Established history (14+ yrs). Oldest track record among peers (26 yrs). Established history (14+ yrs). Point 3 Top rated. Rating: 4★ (upper mid). Rating: 3★ (lower mid). Rating: 3★ (bottom quartile). Rating: 3★ (bottom quartile). Point 4 Risk profile: Moderately Low. Risk profile: Moderately Low. Risk profile: Moderate. Risk profile: Low. Risk profile: Moderate. Point 5 1Y return: 7.49% (top quartile). 1Y return: 6.67% (bottom quartile). 1Y return: 7.12% (upper mid). 1Y return: 7.01% (lower mid). 1Y return: 6.87% (bottom quartile). Point 6 1M return: 0.43% (upper mid). 1M return: 0.41% (bottom quartile). 1M return: 0.42% (lower mid). 1M return: 0.45% (top quartile). 1M return: 0.41% (bottom quartile). Point 7 Sharpe: 3.40 (top quartile). Sharpe: 1.70 (bottom quartile). Sharpe: 2.79 (upper mid). Sharpe: 2.48 (lower mid). Sharpe: 2.37 (bottom quartile). Point 8 Information ratio: 0.00 (top quartile). Information ratio: 0.00 (upper mid). Information ratio: 0.00 (lower mid). Information ratio: 0.00 (bottom quartile). Information ratio: 0.00 (bottom quartile). Point 9 Yield to maturity (debt): 6.81% (top quartile). Yield to maturity (debt): 6.63% (lower mid). Yield to maturity (debt): 6.64% (upper mid). Yield to maturity (debt): 6.39% (bottom quartile). Yield to maturity (debt): 6.37% (bottom quartile). Point 10 Modified duration: 0.47 yrs (bottom quartile). Modified duration: 0.46 yrs (bottom quartile). Modified duration: 0.40 yrs (lower mid). Modified duration: 0.39 yrs (top quartile). Modified duration: 0.40 yrs (upper mid). Aditya Birla Sun Life Savings Fund
UTI Ultra Short Term Fund
ICICI Prudential Ultra Short Term Fund
SBI Magnum Ultra Short Duration Fund
Invesco India Ultra Short Term Fund
शीर्ष आणि सर्वोत्तम फ्लोटिंग रेट म्युच्युअल फंड
Fund NAV Net Assets (Cr) Min Investment 3 MO (%) 6 MO (%) 1 YR (%) 3 YR (%) 2024 (%) Debt Yield (YTM) Mod. Duration Eff. Maturity Aditya Birla Sun Life Floating Rate Fund - Long Term Growth ₹358.416
↑ 0.01 ₹13,126 1,000 1.7 3.1 7.7 7.7 7.9 6.74% 11M 26D 1Y 10M 6D Nippon India Floating Rate Fund Growth ₹46.529
↑ 0.00 ₹8,359 5,000 1.6 2.7 7.9 7.8 8.2 6.97% 2Y 7M 17D 3Y 4M 10D ICICI Prudential Floating Interest Fund Growth ₹438.036
↑ 0.02 ₹7,153 5,000 1.9 3.3 7.9 7.8 8 7.03% 1Y 5M 5D 4Y 25D Note: Returns up to 1 year are on absolute basis & more than 1 year are on CAGR basis. as on 12 Dec 25 Research Highlights & Commentary of 3 Funds showcased
Commentary Aditya Birla Sun Life Floating Rate Fund - Long Term Nippon India Floating Rate Fund ICICI Prudential Floating Interest Fund Point 1 Highest AUM (₹13,126 Cr). Lower mid AUM (₹8,359 Cr). Bottom quartile AUM (₹7,153 Cr). Point 2 Established history (16+ yrs). Oldest track record among peers (21 yrs). Established history (20+ yrs). Point 3 Top rated. Rating: 3★ (lower mid). Rating: 3★ (bottom quartile). Point 4 Risk profile: Moderately Low. Risk profile: Moderately Low. Risk profile: Moderate. Point 5 1Y return: 7.74% (bottom quartile). 1Y return: 7.93% (upper mid). 1Y return: 7.93% (lower mid). Point 6 1M return: 0.34% (lower mid). 1M return: 0.22% (bottom quartile). 1M return: 0.42% (upper mid). Point 7 Sharpe: 2.19 (upper mid). Sharpe: 1.55 (bottom quartile). Sharpe: 1.69 (lower mid). Point 8 Information ratio: 0.00 (upper mid). Information ratio: 0.00 (lower mid). Information ratio: 0.00 (bottom quartile). Point 9 Yield to maturity (debt): 6.74% (bottom quartile). Yield to maturity (debt): 6.97% (lower mid). Yield to maturity (debt): 7.03% (upper mid). Point 10 Modified duration: 0.99 yrs (upper mid). Modified duration: 2.63 yrs (bottom quartile). Modified duration: 1.43 yrs (lower mid). Aditya Birla Sun Life Floating Rate Fund - Long Term
Nippon India Floating Rate Fund
ICICI Prudential Floating Interest Fund
शीर्ष 5 सर्वोत्तम मनी मार्केट म्युच्युअल फंड
Fund NAV Net Assets (Cr) Min Investment 3 MO (%) 6 MO (%) 1 YR (%) 3 YR (%) 2024 (%) Debt Yield (YTM) Mod. Duration Eff. Maturity Aditya Birla Sun Life Money Manager Fund Growth ₹380.912
↑ 0.06 ₹29,882 1,000 1.5 3 7.4 7.6 7.8 6.37% 5M 16D 5M 16D UTI Money Market Fund Growth ₹3,175.68
↑ 0.42 ₹20,352 10,000 1.5 3 7.5 7.6 7.7 6.26% 4M 24D 4M 24D ICICI Prudential Money Market Fund Growth ₹390.708
↑ 0.06 ₹35,011 500 1.5 3 7.5 7.5 7.7 6.23% 4M 7D 4M 16D Kotak Money Market Scheme Growth ₹4,622.42
↑ 0.68 ₹35,100 5,000 1.5 3 7.4 7.5 7.7 6.25% 4M 10D 4M 10D Franklin India Savings Fund Growth ₹51.6379
↑ 0.01 ₹4,440 10,000 1.5 3 7.5 7.5 7.7 6.19% 4M 17D 4M 24D Note: Returns up to 1 year are on absolute basis & more than 1 year are on CAGR basis. as on 12 Dec 25 Research Highlights & Commentary of 5 Funds showcased
Commentary Aditya Birla Sun Life Money Manager Fund UTI Money Market Fund ICICI Prudential Money Market Fund Kotak Money Market Scheme Franklin India Savings Fund Point 1 Lower mid AUM (₹29,882 Cr). Bottom quartile AUM (₹20,352 Cr). Upper mid AUM (₹35,011 Cr). Highest AUM (₹35,100 Cr). Bottom quartile AUM (₹4,440 Cr). Point 2 Established history (20+ yrs). Established history (16+ yrs). Established history (19+ yrs). Established history (22+ yrs). Oldest track record among peers (23 yrs). Point 3 Top rated. Rating: 4★ (upper mid). Rating: 4★ (lower mid). Rating: 4★ (bottom quartile). Rating: 3★ (bottom quartile). Point 4 Risk profile: Low. Risk profile: Low. Risk profile: Low. Risk profile: Low. Risk profile: Moderately Low. Point 5 1Y return: 7.41% (bottom quartile). 1Y return: 7.51% (top quartile). 1Y return: 7.47% (upper mid). 1Y return: 7.41% (bottom quartile). 1Y return: 7.47% (lower mid). Point 6 1M return: 0.44% (bottom quartile). 1M return: 0.47% (top quartile). 1M return: 0.46% (upper mid). 1M return: 0.45% (bottom quartile). 1M return: 0.46% (lower mid). Point 7 Sharpe: 2.97 (top quartile). Sharpe: 2.90 (upper mid). Sharpe: 2.71 (lower mid). Sharpe: 2.70 (bottom quartile). Sharpe: 2.66 (bottom quartile). Point 8 Information ratio: 0.00 (top quartile). Information ratio: 0.00 (upper mid). Information ratio: 0.00 (lower mid). Information ratio: 0.00 (bottom quartile). Information ratio: 0.00 (bottom quartile). Point 9 Yield to maturity (debt): 6.37% (top quartile). Yield to maturity (debt): 6.26% (upper mid). Yield to maturity (debt): 6.23% (bottom quartile). Yield to maturity (debt): 6.25% (lower mid). Yield to maturity (debt): 6.19% (bottom quartile). Point 10 Modified duration: 0.46 yrs (bottom quartile). Modified duration: 0.40 yrs (bottom quartile). Modified duration: 0.35 yrs (top quartile). Modified duration: 0.36 yrs (upper mid). Modified duration: 0.38 yrs (lower mid). Aditya Birla Sun Life Money Manager Fund
UTI Money Market Fund
ICICI Prudential Money Market Fund
Kotak Money Market Scheme
Franklin India Savings Fund
टॉप 5 शॉर्ट टर्म बाँड म्युच्युअल फंड
Fund NAV Net Assets (Cr) 3 MO (%) 6 MO (%) 1 YR (%) 3 YR (%) 2024 (%) Debt Yield (YTM) Mod. Duration Eff. Maturity PGIM India Short Maturity Fund Growth ₹39.3202
↓ 0.00 ₹28 1.2 3.1 6.1 4.2 7.18% 1Y 7M 28D 1Y 11M 1D ICICI Prudential Short Term Fund Growth ₹61.9657
↑ 0.01 ₹22,880 1.7 2.9 8 7.7 7.8 7.19% 2Y 7M 13D 4Y 8M 12D Nippon India Short Term Fund Growth ₹54.3008
↑ 0.00 ₹9,297 1.7 2.6 7.9 7.6 8 7.04% 2Y 8M 1D 3Y 3M 29D Aditya Birla Sun Life Short Term Opportunities Fund Growth ₹48.9448
↑ 0.00 ₹10,963 1.7 2.7 7.8 7.5 7.9 7.21% 2Y 9M 25D 3Y 8M 1D UTI Short Term Income Fund Growth ₹32.5333
↑ 0.00 ₹3,381 1.3 2.3 7.3 7.4 7.9 6.77% 2Y 5M 26D 3Y 1M 24D Note: Returns up to 1 year are on absolute basis & more than 1 year are on CAGR basis. as on 29 Sep 23 Research Highlights & Commentary of 5 Funds showcased
Commentary PGIM India Short Maturity Fund ICICI Prudential Short Term Fund Nippon India Short Term Fund Aditya Birla Sun Life Short Term Opportunities Fund UTI Short Term Income Fund Point 1 Bottom quartile AUM (₹28 Cr). Highest AUM (₹22,880 Cr). Lower mid AUM (₹9,297 Cr). Upper mid AUM (₹10,963 Cr). Bottom quartile AUM (₹3,381 Cr). Point 2 Established history (22+ yrs). Oldest track record among peers (24 yrs). Established history (23+ yrs). Established history (22+ yrs). Established history (18+ yrs). Point 3 Top rated. Rating: 4★ (upper mid). Rating: 4★ (lower mid). Rating: 4★ (bottom quartile). Rating: 4★ (bottom quartile). Point 4 Risk profile: Moderate. Risk profile: Moderate. Risk profile: Moderately Low. Risk profile: Moderate. Risk profile: Moderate. Point 5 1Y return: 6.08% (bottom quartile). 1Y return: 7.98% (top quartile). 1Y return: 7.92% (upper mid). 1Y return: 7.75% (lower mid). 1Y return: 7.29% (bottom quartile). Point 6 1M return: 0.43% (top quartile). 1M return: 0.27% (upper mid). 1M return: 0.18% (bottom quartile). 1M return: 0.18% (lower mid). 1M return: 0.14% (bottom quartile). Point 7 Sharpe: -0.98 (bottom quartile). Sharpe: 1.59 (top quartile). Sharpe: 1.45 (upper mid). Sharpe: 1.32 (lower mid). Sharpe: 1.18 (bottom quartile). Point 8 Information ratio: 0.00 (top quartile). Information ratio: 0.00 (upper mid). Information ratio: 0.00 (lower mid). Information ratio: 0.00 (bottom quartile). Information ratio: 0.00 (bottom quartile). Point 9 Yield to maturity (debt): 7.18% (lower mid). Yield to maturity (debt): 7.19% (upper mid). Yield to maturity (debt): 7.04% (bottom quartile). Yield to maturity (debt): 7.21% (top quartile). Yield to maturity (debt): 6.77% (bottom quartile). Point 10 Modified duration: 1.66 yrs (top quartile). Modified duration: 2.62 yrs (lower mid). Modified duration: 2.67 yrs (bottom quartile). Modified duration: 2.82 yrs (bottom quartile). Modified duration: 2.49 yrs (upper mid). PGIM India Short Maturity Fund
ICICI Prudential Short Term Fund
Nippon India Short Term Fund
Aditya Birla Sun Life Short Term Opportunities Fund
UTI Short Term Income Fund
शीर्ष 5 मध्यम ते दीर्घ मुदतीचे बाँड म्युच्युअल फंड
शीर्षस्थानीमध्यम ते दीर्घ मुदतीचे बाँड एयूएम/निव्वळ मालमत्ता > 500 कोटी असलेले निधी.Fund NAV Net Assets (Cr) 3 MO (%) 6 MO (%) 1 YR (%) 3 YR (%) 2024 (%) Debt Yield (YTM) Mod. Duration Eff. Maturity SBI Magnum Income Fund Growth ₹71.5564
↑ 0.03 ₹2,171 1.1 1.2 5.6 7 8.1 7.31% 5Y 4M 28D 9Y 5M 1D ICICI Prudential Bond Fund Growth ₹40.8018
↑ 0.04 ₹2,890 1.3 1.2 6.4 7.5 8.6 7.24% 6Y 1M 10D 16Y 5M 12D Aditya Birla Sun Life Income Fund Growth ₹126.327
↑ 0.10 ₹2,115 0.7 0.4 4.7 6.6 8.4 7.1% 6Y 8M 5D 15Y 3M 29D HDFC Income Fund Growth ₹58.5913
↑ 0.03 ₹915 0.6 0.6 5 6.7 9 6.88% 6Y 7M 20D 12Y 5M 16D Kotak Bond Fund Growth ₹77.3555
↑ 0.04 ₹2,053 0.9 0.5 4.9 6.7 8.2 7.09% 6Y 8M 5D 13Y 1M 28D Note: Returns up to 1 year are on absolute basis & more than 1 year are on CAGR basis. as on 12 Dec 25 Research Highlights & Commentary of 5 Funds showcased
Commentary SBI Magnum Income Fund ICICI Prudential Bond Fund Aditya Birla Sun Life Income Fund HDFC Income Fund Kotak Bond Fund Point 1 Upper mid AUM (₹2,171 Cr). Highest AUM (₹2,890 Cr). Lower mid AUM (₹2,115 Cr). Bottom quartile AUM (₹915 Cr). Bottom quartile AUM (₹2,053 Cr). Point 2 Established history (27+ yrs). Established history (17+ yrs). Oldest track record among peers (30 yrs). Established history (25+ yrs). Established history (26+ yrs). Point 3 Top rated. Rating: 3★ (upper mid). Rating: 3★ (lower mid). Rating: 2★ (bottom quartile). Rating: 2★ (bottom quartile). Point 4 Risk profile: Moderate. Risk profile: Moderate. Risk profile: Moderate. Risk profile: Moderate. Risk profile: Moderate. Point 5 1Y return: 5.60% (upper mid). 1Y return: 6.37% (top quartile). 1Y return: 4.74% (bottom quartile). 1Y return: 5.05% (lower mid). 1Y return: 4.95% (bottom quartile). Point 6 1M return: -0.19% (upper mid). 1M return: -0.05% (top quartile). 1M return: -0.35% (bottom quartile). 1M return: -0.31% (lower mid). 1M return: -0.51% (bottom quartile). Point 7 Sharpe: 0.05 (upper mid). Sharpe: 0.31 (top quartile). Sharpe: -0.15 (bottom quartile). Sharpe: -0.13 (bottom quartile). Sharpe: -0.13 (lower mid). Point 8 Information ratio: 0.00 (top quartile). Information ratio: 0.00 (upper mid). Information ratio: 0.00 (lower mid). Information ratio: 0.00 (bottom quartile). Information ratio: 0.00 (bottom quartile). Point 9 Yield to maturity (debt): 7.31% (top quartile). Yield to maturity (debt): 7.24% (upper mid). Yield to maturity (debt): 7.10% (lower mid). Yield to maturity (debt): 6.88% (bottom quartile). Yield to maturity (debt): 7.09% (bottom quartile). Point 10 Modified duration: 5.41 yrs (top quartile). Modified duration: 6.11 yrs (upper mid). Modified duration: 6.68 yrs (bottom quartile). Modified duration: 6.64 yrs (lower mid). Modified duration: 6.68 yrs (bottom quartile). SBI Magnum Income Fund
ICICI Prudential Bond Fund
Aditya Birla Sun Life Income Fund
HDFC Income Fund
Kotak Bond Fund
शीर्ष 5 बँकिंग आणि PSU डेट म्युच्युअल फंड
Fund NAV Net Assets (Cr) 3 MO (%) 6 MO (%) 1 YR (%) 3 YR (%) 2024 (%) Debt Yield (YTM) Mod. Duration Eff. Maturity UTI Banking & PSU Debt Fund Growth ₹22.5419
↑ 0.00 ₹804 1.4 2.5 7.7 7.3 7.6 6.5% 1Y 6M 14D 1Y 9M 4D HDFC Banking and PSU Debt Fund Growth ₹23.5948
↑ 0.00 ₹5,901 1.5 2.2 7.4 7.4 7.9 6.85% 3Y 2M 19D 4Y 7M 10D Kotak Banking and PSU Debt fund Growth ₹67.249
↑ 0.01 ₹5,747 1.8 2.5 7.7 7.5 8 6.9% 3Y 2M 26D 5Y 3M 29D ICICI Prudential Banking and PSU Debt Fund Growth ₹33.6364
↑ 0.01 ₹9,764 1.7 2.7 7.6 7.6 7.9 6.94% 3Y 3M 5Y 11M 16D Aditya Birla Sun Life Banking & PSU Debt Fund Growth ₹375.836
↑ 0.01 ₹9,240 1.5 2.2 7.3 7.4 7.9 6.92% 3Y 9M 4D 5Y 2M 26D Note: Returns up to 1 year are on absolute basis & more than 1 year are on CAGR basis. as on 12 Dec 25 Research Highlights & Commentary of 5 Funds showcased
Commentary UTI Banking & PSU Debt Fund HDFC Banking and PSU Debt Fund Kotak Banking and PSU Debt fund ICICI Prudential Banking and PSU Debt Fund Aditya Birla Sun Life Banking & PSU Debt Fund Point 1 Bottom quartile AUM (₹804 Cr). Lower mid AUM (₹5,901 Cr). Bottom quartile AUM (₹5,747 Cr). Highest AUM (₹9,764 Cr). Upper mid AUM (₹9,240 Cr). Point 2 Established history (11+ yrs). Established history (11+ yrs). Oldest track record among peers (26 yrs). Established history (15+ yrs). Established history (17+ yrs). Point 3 Top rated. Rating: 5★ (upper mid). Rating: 4★ (lower mid). Rating: 4★ (bottom quartile). Rating: 4★ (bottom quartile). Point 4 Risk profile: Moderate. Risk profile: Moderately Low. Risk profile: Moderately Low. Risk profile: Moderate. Risk profile: Moderate. Point 5 1Y return: 7.72% (top quartile). 1Y return: 7.39% (bottom quartile). 1Y return: 7.68% (upper mid). 1Y return: 7.64% (lower mid). 1Y return: 7.28% (bottom quartile). Point 6 1M return: 0.26% (top quartile). 1M return: 0.10% (bottom quartile). 1M return: 0.11% (lower mid). 1M return: 0.19% (upper mid). 1M return: 0.06% (bottom quartile). Point 7 Sharpe: 1.56 (top quartile). Sharpe: 0.87 (bottom quartile). Sharpe: 0.88 (lower mid). Sharpe: 1.19 (upper mid). Sharpe: 0.86 (bottom quartile). Point 8 Information ratio: 0.00 (top quartile). Information ratio: 0.00 (upper mid). Information ratio: 0.00 (lower mid). Information ratio: 0.00 (bottom quartile). Information ratio: 0.00 (bottom quartile). Point 9 Yield to maturity (debt): 6.50% (bottom quartile). Yield to maturity (debt): 6.85% (bottom quartile). Yield to maturity (debt): 6.90% (lower mid). Yield to maturity (debt): 6.94% (top quartile). Yield to maturity (debt): 6.92% (upper mid). Point 10 Modified duration: 1.54 yrs (top quartile). Modified duration: 3.22 yrs (upper mid). Modified duration: 3.24 yrs (lower mid). Modified duration: 3.25 yrs (bottom quartile). Modified duration: 3.76 yrs (bottom quartile). UTI Banking & PSU Debt Fund
HDFC Banking and PSU Debt Fund
Kotak Banking and PSU Debt fund
ICICI Prudential Banking and PSU Debt Fund
Aditya Birla Sun Life Banking & PSU Debt Fund
शीर्ष 5 क्रेडिट जोखीम म्युच्युअल फंड
शीर्षस्थानीउधारीची जोखीम एयूएम/निव्वळ मालमत्ता > 500 कोटी असलेले निधी.Fund NAV Net Assets (Cr) 3 MO (%) 6 MO (%) 1 YR (%) 3 YR (%) 2024 (%) Debt Yield (YTM) Mod. Duration Eff. Maturity SBI Credit Risk Fund Growth ₹46.9981
↑ 0.01 ₹2,190 1.6 3.1 8 8.1 8.1 8.09% 2Y 8M 23D 4Y 3M 11D HDFC Credit Risk Debt Fund Growth ₹24.7873
↑ 0.01 ₹7,029 1.6 3.1 7.8 7.6 8.2 8.02% 2Y 4M 17D 3Y 8M 23D Kotak Credit Risk Fund Growth ₹30.5589
↑ 0.03 ₹725 2.1 3.9 8.9 7.5 7.1 7.7% 2Y 2M 12D 2Y 8M 5D Nippon India Credit Risk Fund Growth ₹36.1887
↑ 0.00 ₹1,003 1.7 3.6 8.9 8.3 8.3 8.23% 1Y 11M 19D 2Y 2M 26D ICICI Prudential Regular Savings Fund Growth ₹33.1203
↑ 0.02 ₹5,916 2.5 4.2 9.5 8.4 8.5 8.32% 2Y 3M 3Y 4M 13D Note: Returns up to 1 year are on absolute basis & more than 1 year are on CAGR basis. as on 12 Dec 25 Research Highlights & Commentary of 5 Funds showcased
Commentary SBI Credit Risk Fund HDFC Credit Risk Debt Fund Kotak Credit Risk Fund Nippon India Credit Risk Fund ICICI Prudential Regular Savings Fund Point 1 Lower mid AUM (₹2,190 Cr). Highest AUM (₹7,029 Cr). Bottom quartile AUM (₹725 Cr). Bottom quartile AUM (₹1,003 Cr). Upper mid AUM (₹5,916 Cr). Point 2 Oldest track record among peers (21 yrs). Established history (11+ yrs). Established history (15+ yrs). Established history (20+ yrs). Established history (15+ yrs). Point 3 Top rated. Rating: 4★ (upper mid). Rating: 3★ (lower mid). Rating: 2★ (bottom quartile). Rating: 1★ (bottom quartile). Point 4 Risk profile: Moderate. Risk profile: Moderate. Risk profile: Moderately Low. Risk profile: Moderate. Risk profile: Moderate. Point 5 1Y return: 7.99% (bottom quartile). 1Y return: 7.75% (bottom quartile). 1Y return: 8.92% (upper mid). 1Y return: 8.89% (lower mid). 1Y return: 9.48% (top quartile). Point 6 1M return: 0.31% (lower mid). 1M return: 0.20% (bottom quartile). 1M return: 0.34% (upper mid). 1M return: 0.25% (bottom quartile). 1M return: 0.53% (top quartile). Point 7 Sharpe: 1.98 (lower mid). Sharpe: 1.32 (bottom quartile). Sharpe: 1.64 (bottom quartile). Sharpe: 2.98 (top quartile). Sharpe: 2.18 (upper mid). Point 8 Information ratio: 0.00 (top quartile). Information ratio: 0.00 (upper mid). Information ratio: 0.00 (lower mid). Information ratio: 0.00 (bottom quartile). Information ratio: 0.00 (bottom quartile). Point 9 Yield to maturity (debt): 8.09% (lower mid). Yield to maturity (debt): 8.02% (bottom quartile). Yield to maturity (debt): 7.70% (bottom quartile). Yield to maturity (debt): 8.23% (upper mid). Yield to maturity (debt): 8.32% (top quartile). Point 10 Modified duration: 2.73 yrs (bottom quartile). Modified duration: 2.38 yrs (bottom quartile). Modified duration: 2.20 yrs (upper mid). Modified duration: 1.97 yrs (top quartile). Modified duration: 2.25 yrs (lower mid). SBI Credit Risk Fund
HDFC Credit Risk Debt Fund
Kotak Credit Risk Fund
Nippon India Credit Risk Fund
ICICI Prudential Regular Savings Fund
शीर्ष 5 डायनॅमिक बाँड म्युच्युअल फंड
शीर्षस्थानीडायनॅमिक बाँड एयूएम/निव्वळ मालमत्ता > 500 कोटी असलेले निधी.Fund NAV Net Assets (Cr) 3 MO (%) 6 MO (%) 1 YR (%) 3 YR (%) 2024 (%) Debt Yield (YTM) Mod. Duration Eff. Maturity SBI Dynamic Bond Fund Growth ₹36.0715
↓ -0.01 ₹4,961 0.7 1 5.1 7.1 8.6 6.85% 6Y 3M 29D 10Y 6M 22D Axis Dynamic Bond Fund Growth ₹30.1434
↑ 0.01 ₹1,197 1.4 1.5 6.5 7.3 8.6 6.61% 4Y 11M 1D 8Y 3M 7D Aditya Birla Sun Life Dynamic Bond Fund Growth ₹47.0952
↑ 0.02 ₹1,918 1 1.3 6.5 7.4 8.8 7.59% 6Y 3M 4D 12Y 5M 26D HDFC Dynamic Debt Fund Growth ₹89.7366
↑ 0.11 ₹775 0.6 0 3.8 6.5 8.5 7.05% 7Y 4M 20D 19Y 8M 5D Bandhan Dynamic Bond Fund Growth ₹33.9823
↓ -0.01 ₹2,654 1.1 0.4 3.1 6.6 10 6.6% 5Y 1M 17D 6Y 7M 13D Note: Returns up to 1 year are on absolute basis & more than 1 year are on CAGR basis. as on 12 Dec 25 Research Highlights & Commentary of 5 Funds showcased
Commentary SBI Dynamic Bond Fund Axis Dynamic Bond Fund Aditya Birla Sun Life Dynamic Bond Fund HDFC Dynamic Debt Fund Bandhan Dynamic Bond Fund Point 1 Highest AUM (₹4,961 Cr). Bottom quartile AUM (₹1,197 Cr). Lower mid AUM (₹1,918 Cr). Bottom quartile AUM (₹775 Cr). Upper mid AUM (₹2,654 Cr). Point 2 Established history (21+ yrs). Established history (14+ yrs). Established history (21+ yrs). Oldest track record among peers (28 yrs). Established history (17+ yrs). Point 3 Top rated. Rating: 3★ (upper mid). Rating: 3★ (lower mid). Rating: 3★ (bottom quartile). Rating: 3★ (bottom quartile). Point 4 Risk profile: Moderate. Risk profile: Moderate. Risk profile: Moderate. Risk profile: Moderate. Risk profile: Moderate. Point 5 1Y return: 5.12% (lower mid). 1Y return: 6.46% (top quartile). 1Y return: 6.46% (upper mid). 1Y return: 3.84% (bottom quartile). 1Y return: 3.10% (bottom quartile). Point 6 1M return: -0.30% (bottom quartile). 1M return: -0.14% (upper mid). 1M return: -0.21% (lower mid). 1M return: -0.46% (bottom quartile). 1M return: -0.06% (top quartile). Point 7 Sharpe: -0.05 (lower mid). Sharpe: 0.35 (top quartile). Sharpe: 0.33 (upper mid). Sharpe: -0.31 (bottom quartile). Sharpe: -0.52 (bottom quartile). Point 8 Information ratio: 0.00 (top quartile). Information ratio: 0.00 (upper mid). Information ratio: 0.00 (lower mid). Information ratio: 0.00 (bottom quartile). Information ratio: 0.00 (bottom quartile). Point 9 Yield to maturity (debt): 6.85% (lower mid). Yield to maturity (debt): 6.61% (bottom quartile). Yield to maturity (debt): 7.59% (top quartile). Yield to maturity (debt): 7.05% (upper mid). Yield to maturity (debt): 6.60% (bottom quartile). Point 10 Modified duration: 6.33 yrs (bottom quartile). Modified duration: 4.92 yrs (top quartile). Modified duration: 6.26 yrs (lower mid). Modified duration: 7.39 yrs (bottom quartile). Modified duration: 5.13 yrs (upper mid). SBI Dynamic Bond Fund
Axis Dynamic Bond Fund
Aditya Birla Sun Life Dynamic Bond Fund
HDFC Dynamic Debt Fund
Bandhan Dynamic Bond Fund
शीर्ष 5 कॉर्पोरेट बाँड म्युच्युअल फंड
शीर्षस्थानीकॉर्पोरेट बाँड एयूएम/निव्वळ मालमत्ता > 500 कोटी असलेले निधी.Fund NAV Net Assets (Cr) 3 MO (%) 6 MO (%) 1 YR (%) 3 YR (%) 2024 (%) Debt Yield (YTM) Mod. Duration Eff. Maturity Aditya Birla Sun Life Corporate Bond Fund Growth ₹115.637
↑ 0.03 ₹30,132 1.4 2.2 7.2 7.7 8.5 7.13% 4Y 10M 13D 7Y 7M 2D HDFC Corporate Bond Fund Growth ₹33.3263
↑ 0.00 ₹36,134 1.4 2.1 7.2 7.7 8.6 6.97% 4Y 3M 7D 7Y 29D ICICI Prudential Corporate Bond Fund Growth ₹30.7174
↑ 0.01 ₹34,630 1.7 2.9 8 7.8 8 6.95% 3Y 1M 6D 5Y 8M 1D Kotak Corporate Bond Fund Standard Growth ₹3,877.53
↓ -0.08 ₹18,909 1.5 2.5 7.8 7.6 8.3 6.9% 3Y 1M 24D 4Y 10M 20D Nippon India Prime Debt Fund Growth ₹61.5805
↑ 0.00 ₹10,732 1.4 2.3 7.7 7.8 8.4 6.98% 3Y 9M 5Y 29D Note: Returns up to 1 year are on absolute basis & more than 1 year are on CAGR basis. as on 12 Dec 25 Research Highlights & Commentary of 5 Funds showcased
Commentary Aditya Birla Sun Life Corporate Bond Fund HDFC Corporate Bond Fund ICICI Prudential Corporate Bond Fund Kotak Corporate Bond Fund Standard Nippon India Prime Debt Fund Point 1 Lower mid AUM (₹30,132 Cr). Highest AUM (₹36,134 Cr). Upper mid AUM (₹34,630 Cr). Bottom quartile AUM (₹18,909 Cr). Bottom quartile AUM (₹10,732 Cr). Point 2 Oldest track record among peers (28 yrs). Established history (15+ yrs). Established history (16+ yrs). Established history (18+ yrs). Established history (25+ yrs). Point 3 Top rated. Rating: 5★ (upper mid). Rating: 4★ (lower mid). Rating: 4★ (bottom quartile). Rating: 4★ (bottom quartile). Point 4 Risk profile: Moderately Low. Risk profile: Moderately Low. Risk profile: Moderately Low. Risk profile: Moderately Low. Risk profile: Moderately Low. Point 5 1Y return: 7.20% (bottom quartile). 1Y return: 7.18% (bottom quartile). 1Y return: 7.96% (top quartile). 1Y return: 7.77% (upper mid). 1Y return: 7.66% (lower mid). Point 6 1M return: -0.03% (bottom quartile). 1M return: -0.02% (bottom quartile). 1M return: 0.23% (top quartile). 1M return: 0.10% (upper mid). 1M return: 0.05% (lower mid). Point 7 Sharpe: 0.79 (bottom quartile). Sharpe: 0.78 (bottom quartile). Sharpe: 1.56 (top quartile). Sharpe: 1.19 (upper mid). Sharpe: 1.11 (lower mid). Point 8 Information ratio: 0.00 (top quartile). Information ratio: 0.00 (upper mid). Information ratio: 0.00 (lower mid). Information ratio: 0.00 (bottom quartile). Information ratio: 0.00 (bottom quartile). Point 9 Yield to maturity (debt): 7.13% (top quartile). Yield to maturity (debt): 6.97% (lower mid). Yield to maturity (debt): 6.95% (bottom quartile). Yield to maturity (debt): 6.90% (bottom quartile). Yield to maturity (debt): 6.98% (upper mid). Point 10 Modified duration: 4.87 yrs (bottom quartile). Modified duration: 4.27 yrs (bottom quartile). Modified duration: 3.10 yrs (top quartile). Modified duration: 3.15 yrs (upper mid). Modified duration: 3.75 yrs (lower mid). Aditya Birla Sun Life Corporate Bond Fund
HDFC Corporate Bond Fund
ICICI Prudential Corporate Bond Fund
Kotak Corporate Bond Fund Standard
Nippon India Prime Debt Fund
शीर्ष 5 गिल्ट म्युच्युअल फंड
शीर्षस्थानी (Erstwhile Axis Fixed Income Opportunities Fund) To generate stable returns by investing in debt & money market instruments across the yield curve & credit spectrum. However, there is no assurance or guarantee that the investment objective of the Scheme will be achieved. The Scheme does not assure or guarantee any returns Research Highlights for Axis Credit Risk Fund Below is the key information for Axis Credit Risk Fund Returns up to 1 year are on (Erstwhile DHFL Pramerica Credit Opportunities Fund) The investment objective of the Scheme is to generate income and capital appreciation by investing predominantly in corporate debt. There can be no assurance that the investment objective of the Scheme will be realized. Research Highlights for PGIM India Credit Risk Fund Below is the key information for PGIM India Credit Risk Fund Returns up to 1 year are on The investment objective of the scheme is to generate steady and reasonable income, with low risk and high level of liquidity from a portfolio of predominantly debt & money market securities by Banks and Public Sector Undertakings (PSUs). Research Highlights for UTI Banking & PSU Debt Fund Below is the key information for UTI Banking & PSU Debt Fund Returns up to 1 year are on The primary objective of the schemes is to generate regular income through investments in debt and money market instruments. Income maybe generated through the receipt of coupon payments or the purchase and sale of securities in the underlying portfolio. The schemes will under normal market conditions, invest its net assets in fixed income securities, money market instruments, cash and cash equivalents. Research Highlights for Aditya Birla Sun Life Savings Fund Below is the key information for Aditya Birla Sun Life Savings Fund Returns up to 1 year are on (Erstwhile Aditya Birla Sun Life Floating Rate Fund - Short Term) The primary objective of the schemes is to generate regular income through investment in a portfolio comprising substantially of floating rate debt / money market instruments. The schemes may invest a portion of its net assets in fixed rate debt securities and money market instruments. Research Highlights for Aditya Birla Sun Life Money Manager Fund Below is the key information for Aditya Birla Sun Life Money Manager Fund Returns up to 1 year are on लागू आहे एयूएम/निव्वळ मालमत्ता > 500 कोटी असलेले निधी.Fund NAV Net Assets (Cr) 3 MO (%) 6 MO (%) 1 YR (%) 3 YR (%) 2024 (%) Debt Yield (YTM) Mod. Duration Eff. Maturity ICICI Prudential Gilt Fund Growth ₹104.231
↑ 0.11 ₹9,146 1 1 6.5 7.6 8.2 7.13% 6Y 1M 28D 17Y 5M 1D SBI Magnum Constant Maturity Fund Growth ₹64.6067
↑ 0.02 ₹1,862 0.8 1.1 6.4 7.7 9.1 6.76% 6Y 10M 20D 9Y 7M 17D UTI Gilt Fund Growth ₹63.3269
↑ 0.01 ₹565 1.3 0.6 4.8 6.9 8.9 6.57% 5Y 7M 28D 8Y 2M 8D SBI Magnum Gilt Fund Growth ₹66.1254
↑ 0.01 ₹11,055 0.5 0 4.1 7 8.9 6.93% 8Y 5M 12D 16Y 4M 17D Nippon India Gilt Securities Fund Growth ₹37.8124
↑ 0.06 ₹1,879 0.2 -0.9 2.8 6.2 8.9 7.25% 9Y 2M 19D 21Y 6M 25D Note: Returns up to 1 year are on absolute basis & more than 1 year are on CAGR basis. as on 12 Dec 25 Research Highlights & Commentary of 5 Funds showcased
Commentary ICICI Prudential Gilt Fund SBI Magnum Constant Maturity Fund UTI Gilt Fund SBI Magnum Gilt Fund Nippon India Gilt Securities Fund Point 1 Upper mid AUM (₹9,146 Cr). Bottom quartile AUM (₹1,862 Cr). Bottom quartile AUM (₹565 Cr). Highest AUM (₹11,055 Cr). Lower mid AUM (₹1,879 Cr). Point 2 Oldest track record among peers (26 yrs). Established history (24+ yrs). Established history (23+ yrs). Established history (24+ yrs). Established history (17+ yrs). Point 3 Top rated. Rating: 4★ (upper mid). Rating: 4★ (lower mid). Rating: 4★ (bottom quartile). Rating: 4★ (bottom quartile). Point 4 Risk profile: Moderate. Risk profile: Moderately Low. Risk profile: Moderate. Risk profile: Moderate. Risk profile: Moderate. Point 5 1Y return: 6.49% (top quartile). 1Y return: 6.43% (upper mid). 1Y return: 4.84% (lower mid). 1Y return: 4.10% (bottom quartile). 1Y return: 2.78% (bottom quartile). Point 6 1M return: 0.01% (upper mid). 1M return: -0.23% (lower mid). 1M return: 0.06% (top quartile). 1M return: -0.54% (bottom quartile). 1M return: -0.75% (bottom quartile). Point 7 Sharpe: 0.35 (top quartile). Sharpe: 0.34 (upper mid). Sharpe: -0.16 (lower mid). Sharpe: -0.19 (bottom quartile). Sharpe: -0.40 (bottom quartile). Point 8 Information ratio: 0.00 (top quartile). Information ratio: 0.00 (upper mid). Information ratio: 0.00 (lower mid). Information ratio: 0.00 (bottom quartile). Information ratio: 0.00 (bottom quartile). Point 9 Yield to maturity (debt): 7.13% (upper mid). Yield to maturity (debt): 6.76% (bottom quartile). Yield to maturity (debt): 6.57% (bottom quartile). Yield to maturity (debt): 6.93% (lower mid). Yield to maturity (debt): 7.25% (top quartile). Point 10 Modified duration: 6.16 yrs (upper mid). Modified duration: 6.89 yrs (lower mid). Modified duration: 5.66 yrs (top quartile). Modified duration: 8.45 yrs (bottom quartile). Modified duration: 9.22 yrs (bottom quartile). ICICI Prudential Gilt Fund
SBI Magnum Constant Maturity Fund
UTI Gilt Fund
SBI Magnum Gilt Fund
Nippon India Gilt Securities Fund
1. Axis Credit Risk Fund
Axis Credit Risk Fund
Growth Launch Date 15 Jul 14 NAV (12 Dec 25) ₹22.1931 ↑ 0.00 (0.00 %) Net Assets (Cr) ₹367 on 31 Oct 25 Category Debt - Credit Risk AMC Axis Asset Management Company Limited Rating ☆☆☆☆☆ Risk Moderate Expense Ratio 1.57 Sharpe Ratio 2.49 Information Ratio 0 Alpha Ratio 0 Min Investment 5,000 Min SIP Investment 1,000 Exit Load 0-12 Months (1%),12 Months and above(NIL) Yield to Maturity 8.08% Effective Maturity 2 Years 5 Months 12 Days Modified Duration 2 Years 1 Month 24 Days Growth of 10,000 investment over the years.
Date Value 30 Nov 20 ₹10,000 30 Nov 21 ₹10,625 30 Nov 22 ₹11,026 30 Nov 23 ₹11,779 30 Nov 24 ₹12,750 30 Nov 25 ₹13,884 Returns for Axis Credit Risk Fund
absolute basis & more than 1 year are on CAGR (Compound Annual Growth Rate) basis. as on 12 Dec 25 Duration Returns 1 Month 0.4% 3 Month 2.1% 6 Month 3.7% 1 Year 8.6% 3 Year 7.9% 5 Year 6.8% 10 Year 15 Year Since launch 7.2% Historical performance (Yearly) on absolute basis
Year Returns 2024 8% 2023 7% 2022 4% 2021 6% 2020 8.2% 2019 4.4% 2018 5.9% 2017 6.4% 2016 9.8% 2015 8.7% Fund Manager information for Axis Credit Risk Fund
Name Since Tenure Devang Shah 15 Jul 14 11.31 Yr. Akhil Thakker 9 Nov 21 3.98 Yr. Data below for Axis Credit Risk Fund as on 31 Oct 25
Asset Allocation
Asset Class Value Cash 3.32% Equity 2.91% Debt 93.29% Other 0.49% Debt Sector Allocation
Sector Value Corporate 81.55% Government 8.97% Cash Equivalent 3.32% Securitized 2.76% Credit Quality
Rating Value A 16.82% AA 65.85% AAA 17.33% Top Securities Holdings / Portfolio
Name Holding Value Quantity 6.48% Govt Stock 2035
Sovereign Bonds | -5% ₹18 Cr 1,800,000
↑ 1,000,000 Jubilant Bevco Limited
Debentures | -4% ₹16 Cr 1,500 Jtpm Metal TRaders Limited
Debentures | -4% ₹15 Cr 1,500 Narayana Hrudayalaya Limited
Debentures | -4% ₹15 Cr 1,500 Aditya Birla Renewables Limited
Debentures | -4% ₹15 Cr 1,500 Altius Telecom Infrastructure Trust
Debentures | -4% ₹15 Cr 1,500 Nirma Limited
Debentures | -4% ₹15 Cr 1,500 Infopark Properties Limited
Debentures | -4% ₹15 Cr 1,500 Aditya Birla Digital Fashion Ventures Limited
Debentures | -4% ₹15 Cr 1,500 7.18% Govt Stock 2033
Sovereign Bonds | -3% ₹12 Cr 1,200,000 2. PGIM India Credit Risk Fund
PGIM India Credit Risk Fund
Growth Launch Date 29 Sep 14 NAV (21 Jan 22) ₹15.5876 ↑ 0.00 (0.01 %) Net Assets (Cr) ₹39 on 31 Dec 21 Category Debt - Credit Risk AMC Pramerica Asset Managers Private Limited Rating ☆☆☆☆☆ Risk Moderate Expense Ratio 1.85 Sharpe Ratio 1.73 Information Ratio 0 Alpha Ratio 0 Min Investment 5,000 Min SIP Investment 1,000 Exit Load 0-1 Years (1%),1 Years and above(NIL) Yield to Maturity 5.01% Effective Maturity 7 Months 2 Days Modified Duration 6 Months 14 Days Growth of 10,000 investment over the years.
Date Value 30 Nov 20 ₹10,000 30 Nov 21 ₹10,965 Returns for PGIM India Credit Risk Fund
absolute basis & more than 1 year are on CAGR (Compound Annual Growth Rate) basis. as on 12 Dec 25 Duration Returns 1 Month 0.3% 3 Month 0.6% 6 Month 4.4% 1 Year 8.4% 3 Year 3% 5 Year 4.2% 10 Year 15 Year Since launch 6.3% Historical performance (Yearly) on absolute basis
Year Returns 2024 2023 2022 2021 2020 2019 2018 2017 2016 2015 Fund Manager information for PGIM India Credit Risk Fund
Name Since Tenure Data below for PGIM India Credit Risk Fund as on 31 Dec 21
Asset Allocation
Asset Class Value Debt Sector Allocation
Sector Value Credit Quality
Rating Value Top Securities Holdings / Portfolio
Name Holding Value Quantity 3. UTI Banking & PSU Debt Fund
UTI Banking & PSU Debt Fund
Growth Launch Date 3 Feb 14 NAV (12 Dec 25) ₹22.5419 ↑ 0.00 (0.00 %) Net Assets (Cr) ₹804 on 31 Oct 25 Category Debt - Banking & PSU Debt AMC UTI Asset Management Company Ltd Rating ☆☆☆☆☆ Risk Moderate Expense Ratio 0.54 Sharpe Ratio 1.56 Information Ratio 0 Alpha Ratio 0 Min Investment 5,000 Min SIP Investment 500 Exit Load NIL Yield to Maturity 6.5% Effective Maturity 1 Year 9 Months 4 Days Modified Duration 1 Year 6 Months 14 Days Growth of 10,000 investment over the years.
Date Value 30 Nov 20 ₹10,000 30 Nov 21 ₹10,279 30 Nov 22 ₹11,324 30 Nov 23 ₹12,024 30 Nov 24 ₹12,978 30 Nov 25 ₹14,023 Returns for UTI Banking & PSU Debt Fund
absolute basis & more than 1 year are on CAGR (Compound Annual Growth Rate) basis. as on 12 Dec 25 Duration Returns 1 Month 0.3% 3 Month 1.4% 6 Month 2.5% 1 Year 7.7% 3 Year 7.3% 5 Year 7% 10 Year 15 Year Since launch 7.1% Historical performance (Yearly) on absolute basis
Year Returns 2024 7.6% 2023 6.7% 2022 10.3% 2021 2.8% 2020 8.9% 2019 -1% 2018 6.8% 2017 6.4% 2016 11.7% 2015 8.6% Fund Manager information for UTI Banking & PSU Debt Fund
Name Since Tenure Anurag Mittal 1 Dec 21 3.92 Yr. Data below for UTI Banking & PSU Debt Fund as on 31 Oct 25
Asset Allocation
Asset Class Value Cash 8.57% Debt 91.1% Other 0.33% Debt Sector Allocation
Sector Value Corporate 51% Government 40.09% Cash Equivalent 8.57% Credit Quality
Rating Value AAA 100% Top Securities Holdings / Portfolio
Name Holding Value Quantity 7.38% Govt Stock 2027
Sovereign Bonds | -11% ₹92 Cr 900,000,000 Axis Bank Limited
Debentures | -7% ₹56 Cr 550 Export Import Bank Of India
Debentures | -6% ₹51 Cr 5,000 Small Industries Development Bank Of India
Debentures | -6% ₹51 Cr 5,000 Power Finance Corporation Limited
Debentures | -5% ₹41 Cr 400 Rural Electrification Corporation Limited
Debentures | -4% ₹36 Cr 3,500 National Housing Bank
Debentures | -4% ₹36 Cr 3,500 HDFC Bank Limited
Debentures | -4% ₹35 Cr 350 National Bank For Agriculture And Rural Development
Debentures | -4% ₹31 Cr 3,000 Indian Railway Finance Corporation Limited
Debentures | -4% ₹30 Cr 300 4. Aditya Birla Sun Life Savings Fund
Aditya Birla Sun Life Savings Fund
Growth Launch Date 16 Apr 03 NAV (12 Dec 25) ₹564.439 ↑ 0.06 (0.01 %) Net Assets (Cr) ₹22,389 on 31 Oct 25 Category Debt - Ultrashort Bond AMC Birla Sun Life Asset Management Co Ltd Rating ☆☆☆☆☆ Risk Moderately Low Expense Ratio 0.55 Sharpe Ratio 3.4 Information Ratio 0 Alpha Ratio 0 Min Investment 1,000 Min SIP Investment 1,000 Exit Load NIL Yield to Maturity 6.81% Effective Maturity 6 Months 22 Days Modified Duration 5 Months 19 Days Growth of 10,000 investment over the years.
Date Value 30 Nov 20 ₹10,000 30 Nov 21 ₹10,392 30 Nov 22 ₹10,859 30 Nov 23 ₹11,636 30 Nov 24 ₹12,535 30 Nov 25 ₹13,491 Returns for Aditya Birla Sun Life Savings Fund
absolute basis & more than 1 year are on CAGR (Compound Annual Growth Rate) basis. as on 12 Dec 25 Duration Returns 1 Month 0.4% 3 Month 1.5% 6 Month 3.1% 1 Year 7.5% 3 Year 7.5% 5 Year 6.2% 10 Year 15 Year Since launch 7.4% Historical performance (Yearly) on absolute basis
Year Returns 2024 7.9% 2023 7.2% 2022 4.8% 2021 3.9% 2020 7% 2019 8.5% 2018 7.6% 2017 7.2% 2016 9.2% 2015 8.9% Fund Manager information for Aditya Birla Sun Life Savings Fund
Name Since Tenure Sunaina Cunha 20 Jun 14 11.38 Yr. Kaustubh Gupta 15 Jul 11 14.31 Yr. Monika Gandhi 22 Mar 21 4.62 Yr. Data below for Aditya Birla Sun Life Savings Fund as on 31 Oct 25
Asset Allocation
Asset Class Value Cash 49.2% Debt 50.56% Other 0.24% Debt Sector Allocation
Sector Value Corporate 47.85% Cash Equivalent 39.2% Government 12.71% Credit Quality
Rating Value AA 28.73% AAA 71.27% Top Securities Holdings / Portfolio
Name Holding Value Quantity Shriram Finance Limited
Debentures | -3% ₹614 Cr 60,000 Nirma Limited
Debentures | -2% ₹487 Cr 48,500 07.22 GJ Sdl 2028
Sovereign Bonds | -2% ₹376 Cr 37,500,000 Muthoot Finance Limited
Debentures | -2% ₹352 Cr 35,000
↑ 10,000 Mankind Pharma Limited
Debentures | -1% ₹348 Cr 34,500 Bank of Baroda
Debentures | -1% ₹344 Cr 7,000 National Bank For Agriculture And Rural Development
Debentures | -1% ₹341 Cr 3,400 Avanse Financial Services Limited
Debentures | -1% ₹301 Cr 30,000 Power Finance Corporation Limited
Debentures | -1% ₹298 Cr 30,000 ICICI Home Finance Company Limited
Debentures | -1% ₹272 Cr 27,000 5. Aditya Birla Sun Life Money Manager Fund
Aditya Birla Sun Life Money Manager Fund
Growth Launch Date 13 Oct 05 NAV (12 Dec 25) ₹380.912 ↑ 0.06 (0.01 %) Net Assets (Cr) ₹29,882 on 31 Oct 25 Category Debt - Money Market AMC Birla Sun Life Asset Management Co Ltd Rating ☆☆☆☆☆ Risk Low Expense Ratio 0.35 Sharpe Ratio 2.97 Information Ratio 0 Alpha Ratio 0 Min Investment 1,000 Min SIP Investment 1,000 Exit Load NIL Yield to Maturity 6.37% Effective Maturity 5 Months 16 Days Modified Duration 5 Months 16 Days Growth of 10,000 investment over the years.
Date Value 30 Nov 20 ₹10,000 30 Nov 21 ₹10,382 30 Nov 22 ₹10,856 30 Nov 23 ₹11,663 30 Nov 24 ₹12,565 30 Nov 25 ₹13,510 Returns for Aditya Birla Sun Life Money Manager Fund
absolute basis & more than 1 year are on CAGR (Compound Annual Growth Rate) basis. as on 12 Dec 25 Duration Returns 1 Month 0.4% 3 Month 1.5% 6 Month 3% 1 Year 7.4% 3 Year 7.6% 5 Year 6.2% 10 Year 15 Year Since launch 6.9% Historical performance (Yearly) on absolute basis
Year Returns 2024 7.8% 2023 7.4% 2022 4.8% 2021 3.8% 2020 6.6% 2019 8% 2018 7.9% 2017 6.8% 2016 7.7% 2015 8.4% Fund Manager information for Aditya Birla Sun Life Money Manager Fund
Name Since Tenure Kaustubh Gupta 15 Jul 11 14.31 Yr. Anuj Jain 22 Mar 21 4.62 Yr. Mohit Sharma 1 Apr 17 8.59 Yr. Data below for Aditya Birla Sun Life Money Manager Fund as on 31 Oct 25
Asset Allocation
Asset Class Value Cash 90.08% Debt 9.69% Other 0.23% Debt Sector Allocation
Sector Value Cash Equivalent 70.4% Corporate 19.2% Government 10.17% Credit Quality
Rating Value AAA 100% Top Securities Holdings / Portfolio
Name Holding Value Quantity 5.63% Govt Stock 2026
Sovereign Bonds | -2% ₹770 Cr 77,000,000
↑ 500,000 India (Republic of)
- | -2% ₹493 Cr 50,000,000
↑ 50,000,000 India (Republic of)
- | -1% ₹248 Cr 25,000,000 7.59% Govt Stock 2026
Sovereign Bonds | -1% ₹241 Cr 24,000,000 364 Days T-Bill - 06nov2026
Sovereign Bonds | -1% ₹237 Cr 25,000,000
↑ 25,000,000 India (Republic of)
- | -1% ₹222 Cr 22,500,000
↑ 22,500,000 India (Republic of)
- | -1% ₹215 Cr 22,500,000
↑ 22,500,000 Canara Bank
Domestic Bonds | -1% ₹197 Cr 4,000
↑ 4,000 Gs CG 12/12/2025 - (Strips) Tb
Sovereign Bonds | -1% ₹189 Cr 19,009,500 08.16 KA Sdl 2025
Sovereign Bonds | -1% ₹180 Cr 18,000,000
सर्वोत्तम डेट म्युच्युअल फंडाचे मूल्यांकन कसे करावे
तुम्हाला गुंतवण्यासाठी इच्छित असलेले सर्वोत्तम डेट फंड निवडण्यासाठी, काही महत्त्वाच्या मापदंडांचा विचार करण्याची आवश्यकता आहे जसे की सरासरी मॅच्युरिटी, क्रेडिट क्वॉलिटी, एयूएम, एक्पेन्स रेशो, टॅक्स इम्लिप्शन इ. -
1. सरासरी परिपक्वता/कालावधी
डेट फंड्समध्ये सरासरी मॅच्युरिटी हा एक आवश्यक पॅरामीटर आहे ज्याकडे गुंतवणूकदारांकडून दुर्लक्ष केले जाते, जे गुंतवणुकीच्या जोखमींचा विचार न करता दीर्घ कालावधीसाठी गुंतवणूक करतात. गुंतवणूकदारांनी त्यांची डेट फंड गुंतवणूक त्याच्या मॅच्युरिटी कालावधीच्या आधारे ठरवणे आवश्यक आहे, डेट फंडाच्या मॅच्युरिटी कालावधीशी गुंतवणुकीचा कालावधी जुळणे हा तुम्ही अनावश्यक जोखीम पत्करणार नाही याची खात्री करण्याचा एक चांगला मार्ग आहे. अशाप्रकारे, डेट फंडामध्ये इष्टतम जोखीम परतावा मिळविण्यासाठी, गुंतवणूक करण्यापूर्वी, डेट फंडाची सरासरी परिपक्वता जाणून घेणे उचित आहे. सरासरी मॅच्युरिटी (कालावधी हा एक समान घटक आहे) पाहणे महत्त्वाचे आहे, उदाहरणार्थ, लिक्विड फंडाची सरासरी मॅच्युरिटी काही दिवसांपासून कदाचित एक महिन्याची असू शकते, याचा अर्थ असा होईल की गुंतवणूकदारांसाठी हा एक उत्तम पर्याय आहे. काही दिवस पैसे गुंतवायचे. त्याचप्रमाणे, जर तुम्ही एक वर्षाची कालमर्यादा पहात असालगुंतवणूक योजना मग, अल्पकालीन कर्ज निधी आदर्श असू शकतो.
2. व्याजदर परिस्थिती
व्याजदर आणि त्यातील चढ-उतार यामुळे प्रभावित होणाऱ्या डेट फंडांमध्ये बाजारातील वातावरण समजून घेणे खूप महत्त्वाचे आहे. जेव्हा अर्थव्यवस्थेत व्याजदर वाढतो तेव्हा रोख्यांची किंमत कमी होते आणि उलट. तसेच, ज्या काळात व्याजदर वाढतात त्या काळात, जुन्या रोख्यांपेक्षा जास्त उत्पन्न असलेले नवीन रोखे बाजारात जारी केले जातात, ज्यामुळे ते जुने रोखे कमी मूल्याचे बनतात. त्यामुळे, बाजारातील नवीन बाँड्सकडे गुंतवणूकदार अधिक आकर्षित होतात आणि जुन्या बाँड्सची पुनर्मूल्यांकन देखील होते. जर एखाद्या डेट फंडाला अशा "जुन्या बाँड्स" चे एक्सपोजर येत असेल तर जेव्हा व्याजदर वाढतात,नाही कर्ज निधीवर नकारात्मक परिणाम होईल. शिवाय, डेट फंड व्याजदरातील चढउतारांना सामोरे जात असल्याने, ते फंड पोर्टफोलिओमधील अंतर्निहित रोख्यांच्या किमतींना त्रास देतात. उदाहरणार्थ, वाढत्या व्याजदराच्या काळात दीर्घकालीन कर्ज निधीला जास्त धोका असतो. या काळात अल्प-मुदतीची गुंतवणूक योजना बनवल्याने तुमच्या व्याजदरातील जोखीम कमी होईल.
जर एखाद्याला व्याजदरांचे चांगले ज्ञान असेल आणि त्याला त्याचे निरीक्षण करता आले तर त्याचा फायदाही घेता येईल. घसरलेल्या व्याजदराच्या बाजारात, दीर्घकालीन कर्ज निधी हा एक चांगला पर्याय असेल. तथापि, वाढत्या व्याजदराच्या काळात अल्प मुदतीच्या फंडांसारख्या कमी सरासरी परिपक्वता असलेल्या फंडांमध्ये असणे शहाणपणाचे ठरेल.अल्ट्रा शॉर्ट टर्म फंड किंवा लिक्विड फंड देखील.
3. वर्तमान उत्पन्न किंवा पोर्टफोलिओ उत्पन्न
उत्पन्न हे पोर्टफोलिओमधील बाँड्सद्वारे व्युत्पन्न केलेल्या व्याज उत्पन्नाचे मोजमाप आहे. कर्ज किंवा रोख्यांमध्ये गुंतवणूक करणारे फंड ज्यांचे प्रमाण जास्त आहेकूपन दर (किंवा उत्पन्न) एकूण पोर्टफोलिओ उत्पन्न जास्त असेल. परिपक्वतेपर्यंत उत्पन्न (ytmडेट म्युच्युअल फंडाचे ) फंडाचे चालू उत्पन्न दर्शवते. YTM च्या आधारे कर्ज निधीची तुलना करताना, एखाद्याने हे तथ्य देखील पाहिले पाहिजे की अतिरिक्त उत्पन्न कसे निर्माण केले जात आहे. हे कमी पोर्टफोलिओ गुणवत्तेच्या किंमतीवर आहे का? चांगल्या दर्जाच्या नसलेल्या साधनांमध्ये गुंतवणूक करण्याचे स्वतःचे प्रश्न आहेत. तुम्ही डेट फंडात गुंतवणूक करू इच्छित नाही ज्यामध्ये असे रोखे किंवा रोखे असतीलडीफॉल्ट नंतर. म्हणून, नेहमी पोर्टफोलिओ उत्पन्न पहा आणि क्रेडिट गुणवत्तेसह ते संतुलित करा.
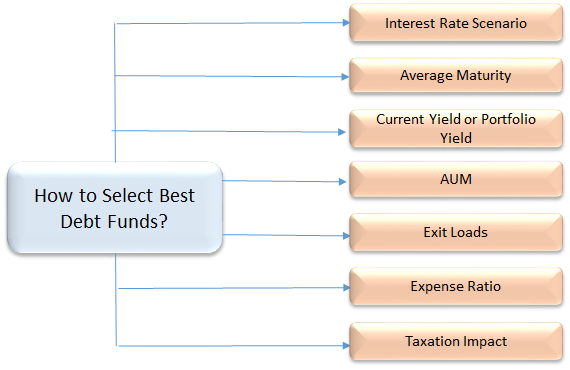
4. पोर्टफोलिओची क्रेडिट गुणवत्ता
सर्वोत्तम डेट फंडांमध्ये गुंतवणूक करण्यासाठी, बॉण्ड्स आणि डेट सिक्युरिटीजची क्रेडिट गुणवत्ता तपासणे हे एक आवश्यक पॅरामीटर आहे. रोखे परत देण्याच्या क्षमतेवर आधारित विविध एजन्सीद्वारे क्रेडिट रेटिंग नियुक्त केले जातात. AAA रेटिंग असलेले बाँड हे सर्वोत्तम क्रेडिट रेटिंग मानले जाते आणि ते सुरक्षित आणि सुरक्षित गुंतवणूक देखील सूचित करते. जर एखाद्याला खरोखरच सुरक्षितता हवी असेल आणि सर्वोत्तम डेट फंड निवडण्यासाठी हे सर्वोत्कृष्ट मापदंड मानत असेल, तर अत्यंत उच्च-गुणवत्तेची कर्ज साधने (AAA किंवा AA+) असलेल्या फंडात प्रवेश करणे हा इच्छित पर्याय असू शकतो.
5. व्यवस्थापन अंतर्गत मालमत्ता (AUM)
सर्वोत्कृष्ट कर्ज निधी निवडताना विचारात घेण्याचे हे सर्वात महत्त्वाचे पॅरामीटर आहे. AUM ही सर्व गुंतवणूकदारांनी विशिष्ट योजनेत गुंतवलेली एकूण रक्कम असते. पासून, बहुतेकम्युच्युअल फंडएकूण AUM डेट फंडांमध्ये गुंतवले जाते, गुंतवणूकदारांनी योजना मालमत्ता निवडणे आवश्यक आहे ज्यात लक्षणीय AUM आहे. कॉर्पोरेट्समध्ये मोठ्या प्रमाणावर एक्सपोजर असलेल्या फंडात असणे धोकादायक असू शकते, कारण त्यांचे पैसे काढणे मोठे असू शकते ज्यामुळे एकूण फंडाच्या कामगिरीवर परिणाम होऊ शकतो.
6. खर्चाचे प्रमाण
डेट फंडांमध्ये विचारात घेतलेला महत्त्वाचा घटक म्हणजे त्याचे खर्चाचे प्रमाण. उच्च खर्चाचे प्रमाण फंडाच्या कामगिरीवर मोठा प्रभाव निर्माण करते. उदाहरणार्थ, लिक्विड फंडांमध्ये सर्वात कमी खर्चाचे प्रमाण असते जे 50 bps पर्यंत असते (BPS हे व्याजदर मोजण्याचे एकक असते ज्यामध्ये एक bps 1% च्या 1/100 व्या बरोबर असते) तर इतर डेट फंड 150 bps पर्यंत आकारू शकतात. त्यामुळे एका डेट म्युच्युअल फंडामधून निवड करण्यासाठी, व्यवस्थापन शुल्क किंवा फंड चालविण्याचा खर्च विचारात घेणे महत्त्वाचे आहे.
7. कर आकारणी प्रभाव
डेट फंड इंडेक्सेशन लाभांसह दीर्घकालीन भांडवली नफ्याचा (3 वर्षांपेक्षा जास्त) लाभ देतात. आणि अल्पकालीन भांडवली नफ्यावर (3 वर्षांपेक्षा कमी) 30% कर आकारला जातो.
गुंतवणूकदार म्हणून विचारात घेण्यासारख्या गोष्टी
1. निधीची उद्दिष्टे
विविध प्रकारच्या सिक्युरिटीजचा वैविध्यपूर्ण पोर्टफोलिओ राखून इष्टतम परतावा मिळविण्याचे डेट फंडाचे उद्दिष्ट आहे. तुम्ही त्यांच्याकडून अंदाजानुसार कामगिरी करण्याची अपेक्षा करू शकता. या कारणास्तव, डेट फंड पुराणमतवादी गुंतवणूकदारांमध्ये लोकप्रिय आहेत.
2. निधीचे प्रकार
डेट फंड पुढे विविध श्रेणींमध्ये विभागले गेले आहेत जसे की लिक्विड फंड,मासिक उत्पन्न योजना (एमआयपी), निश्चित परिपक्वता योजना (एफएमपी),डायनॅमिक बाँड फंड, इन्कम फंड, क्रेडिट संधी फंड, GILT फंड, शॉर्ट टर्म फंड आणि अल्ट्रा शॉर्ट टर्म फंड.
3. जोखीम
डेट फंड मुळात व्याजदर जोखीम, क्रेडिट जोखीम आणितरलता धोका एकूण व्याजदराच्या हालचालींमुळे निधी मूल्यात चढ-उतार होऊ शकतात. जारीकर्त्याद्वारे व्याज आणि मुद्दल भरण्यात डिफॉल्ट होण्याचा धोका आहे. जेव्हा निधी व्यवस्थापक मागणीच्या अभावामुळे अंतर्निहित सुरक्षा विकू शकत नाही तेव्हा तरलतेचा धोका उद्भवतो.
4. खर्च
डेट फंड तुमचे पैसे व्यवस्थापित करण्यासाठी खर्चाचे प्रमाण आकारतात. आता पर्यंतसेबी खर्च गुणोत्तराची वरची मर्यादा 2.25% असणे अनिवार्य केले आहे (नियमानुसार वेळोवेळी बदलू शकते.).
5. गुंतवणूक होरायझन
लिक्विड फंडांसाठी 3 महिने ते 1 वर्षाची गुंतवणूक योग्य असेल. जर तुमच्याकडे 2 ते 3 वर्षांचा क्षितिज जास्त असेल, तर तुम्ही शॉर्ट टर्म बाँड फंडांसाठी जाऊ शकता.
6. आर्थिक उद्दिष्टे
अतिरिक्त उत्पन्न मिळवणे किंवा तरलतेच्या उद्देशाने विविध उद्दिष्टे साध्य करण्यासाठी डेट फंडाचा वापर केला जाऊ शकतो.
सर्वोत्तम डेट फंड्समध्ये ऑनलाइन गुंतवणूक कशी करावी?
Fincash.com वर आजीवन मोफत गुंतवणूक खाते उघडा.
तुमची नोंदणी आणि KYC प्रक्रिया पूर्ण करा
दस्तऐवज अपलोड करा (PAN, आधार इ.).आणि, तुम्ही गुंतवणूक करण्यास तयार आहात!
निष्कर्ष
डेट फंड हा तुमचा पैसा गुंतवण्याचा आणि तुमच्याशी जुळणारे संबंधित उत्पादन निवडून नियमितपणे उत्पन्न मिळवण्याचा सर्वोत्तम मार्ग आहे.जोखीम प्रोफाइल. त्यामुळे, स्थिर उत्पन्न मिळवू पाहणारे गुंतवणूकदार किंवा डेट मार्केटचा फायदा घेऊ पाहणारे, 2022 - 2023 साठी वरील सर्वोत्कृष्ट कर्ज निधीचा विचार करू शकतात आणि गुंतवणूक सुरू करू शकतात!_
येथे प्रदान केलेली माहिती अचूक असल्याची खात्री करण्यासाठी सर्व प्रयत्न केले गेले आहेत. तथापि, डेटाच्या अचूकतेबद्दल कोणतीही हमी दिली जात नाही. कृपया कोणतीही गुंतवणूक करण्यापूर्वी योजना माहिती दस्तऐवजासह सत्यापित करा.


AMFI Registration No. 112358 | CIN: U74999MH2016PTC282153
Shepard Technologies Pvt. Ltd. (with ARN code 112358) makes no warranties or representations, express or implied, on products offered through the platform. It accepts no liability for any damages or losses, however caused, in connection with the use of, or on the reliance of its product or related services. Terms and conditions of the website are applicable.
©2025 Shepard Technologies Private Limited. All Rights Reserved
The article is nice and informative but it could be in more simple words because lot of people have much less knowledge in such sector