SIPs Vs Lump Sum
SIPs Vs Lump sum Investing? There are various articles that say systematic investment plans(or SIPs) are the best route to be taken for investing in Mutual Funds. Various SIP calculators help you plan for that goal, many websites, and financial planners will also advocate the Top SIP plans to invest. Most will talk about rupee cost averaging & the benefits of SIPs, stating that getting into the stock market via lump sum investment may not be the best way. While one may get into the best mutual fund for SIP, can one expect better returns than lump sum investing by using SIP as the investing mode?
SIPs or Lump Sum: Invest for Time not Timing
Investing is always about the ability to generate returns. Whether it's a lump sum investment or a systematic Investment plan, one needs to be prudent and make the correct decisions. Investing in Mutual Funds is not always about selecting the best mutual funds or the Best SIP Plans. There is much more that needs to be considered. Especially, if one is thinking about investing in the equity markets, one needs to be even more careful. An analysis of the stock market (taking the BSE Sensex as the benchmark) yields that the chance of making returns increases if one stays invested for a long term. As one can see from the table below, if one just goes by numbers, there is a 30% chance that you may make a loss if you plan to stay invested in the stock market for only 1 year.
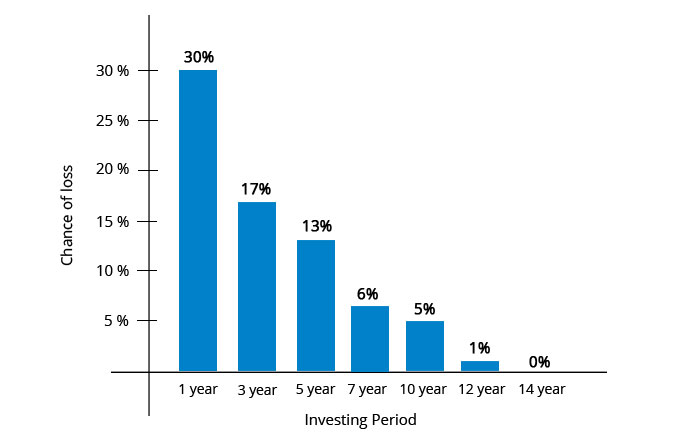
Hence most advisors when talking about equity investments would always relate to equities with "long term investing". If one plans to stay invested for 5 years the probability to make loss drops to 13%. And if one is truly long-term ( more than 10 years), than the ability to make a loss tends towards zero. Hence, if one is really interested in making money from the stock market, its all about spending time in the stock market. (rather than marking timing!)

SIPs or Lump Sum: An Analysis
It's quite clear that investing in the equity markets is a long-term game. A lot of people advocate that the benefits of SIPs extend from rupee cost averaging to disciplined investing, but there is a bigger question to be answered, do SIPs deliver better returns than lump sum investing?
We tried to get a deeper understanding of this question by looking at the equity markets since 1979 (since the inception of the BSE Sensex). The BSE Sensex is a composition of the top 30 companies in India and is a representation of the equity market. Analysing this data, we could get some insights to see if SIPs or lump sum, which is better.
Talk to our investment specialist
Worst Periods of Stock Market
The worst period to start investing was around September 1994 (this was the time when the stock market had peaked). In fact, if one looks at market data the investor who had invested a lump sum sat on negative returns for 59 months( nearly 5 years!). The investor broke even in about July of 1999. The next year though some returns were generated, these returns were short lived due to the 2000 stock market crash subsequently. After suffering for another 4 years (with negative returns) and the investor finally became positive in October 2003. This was possibly the worst time to have invested a lump sum.
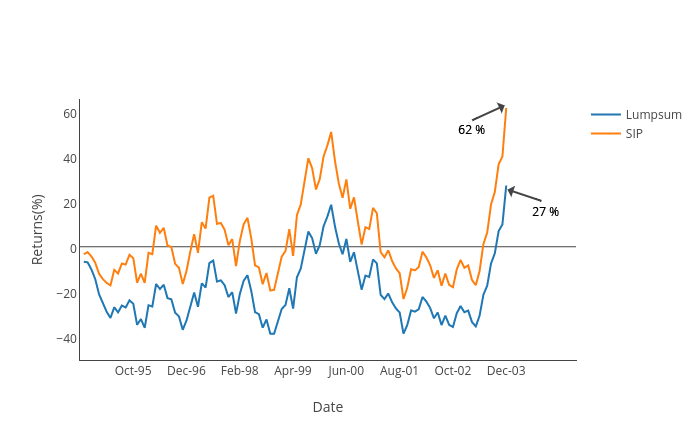
What happened to the SIP investor? The systematic Investment Plan investor was negative for only 19 months and started posting profits, however, these were short-lived. The SIP investors were up again by May 1999 after suffering interim losses. While the journey still continued to be shaky, SIP investors showed profits in the Portfolio much earlier. The maximum loss for the lump sum investor was nearly 40%, whereas for the SIP investor was 23%. The systematic investment plan investor had a faster recovery period as well as a lower loss in the portfolio.
Another very gloomy period to start investing was around March 2000 (this was the time when the stock market had peaked, again!). In fact, if one looks at market data the investor who had invested a lump sum sat on negative returns for 45 months straight( nearly 4 years!). The investor broke even in about of December of 2003. The next year though some returns were generated, these returns were short lived due to a slip again in 2004. After suffering for another 1 year, the investor finally became positive in September 2004. This was another bad time to have invested a lump sum.
What was the story of the SIP investor who started investing in March of 2000? If one invested monthly sums of equal amounts, the investor was positive in June 2003 and by September 2004, the portfolio was up 45% overall. (when the lump sum investor was breaking even). Another aspect to note is the maximum loss, the lump sum investor has suffered a nearly 50% loss by September 2001, comparatively, the SIP portfolio loss was 28% at the same time.
What we can get from the above is that when the stock market is in for a bad period, it's always better to be in a SIP since the recovery is faster and also one sees lower losses in the portfolio too.
Best Periods of the Stock Market
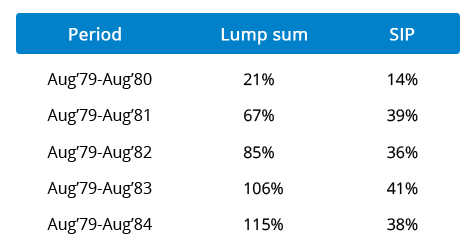
Looking at the last 37 years data of the stock market from 1979 to 2016, one deciphers that if one invested early on (1979 - inception time of the BSE Sensex), one hardly saw any negative returns in the portfolio.
A 5-year analysis from August 1979 shows that both the lump sum and Systematic Investment Plan portfolios posted hardly any loss in any time period from there. As one can see from the graph below, both portfolios posted handsome profits year-on-year. At the end of every year, the lump sum portfolio overtook the SIP portfolio and increased the lead margin too.
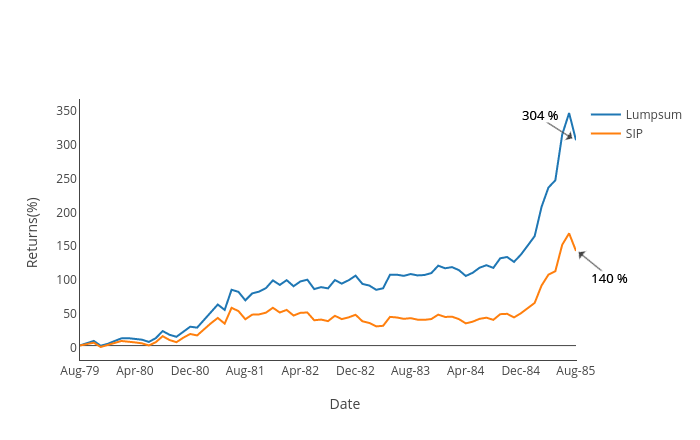
Hence, in case the market is expected to go one way up, the lump sum is always the better option.
Which is Better Investment Mode?
While we can analyse all periods of the stock market, can we really decide which is better? The answer to this varies from individual to individual, the cash flows, investing(or holding) periods, outgoing cash flows or requirements etc. SIPs are a great tool to inculcate the habit of savings, they channelize the investment of individuals into the stock market. One also has to plan for investing for the long term if you plan to invest in equities, where we clearly know that the ability to generate returns increases with time. Also, if one feels the markets may be choppy and not a straight line up, then SIPs are a great tool to enter the market. Additionally, data shows that SIPs also ensure that the investor suffers lower losses at any time.
In case there is feeling that the market would be secular (one way!) on the upside, in that situation, lump sum investing would be the way to go.
Fund Selection Methodology used to find 5 funds
Best Performing SIP Plans in India 2026
The primary investment objective of the Scheme is to seek capital appreciation by investing predominantly in the units of BlackRock Global Funds – World Mining Fund. The Scheme may, at the discretion of the Investment Manager, also invest in the units of other similar overseas mutual fund schemes, which may
constitute a significant part of its corpus. The Scheme may also invest a certain portion of its corpus in money market securities and/or money market/liquid schemes of DSP BlackRock Mutual Fund, in order to meet liquidity requirements from time to time. Below is the key information for DSP World Mining Fund Returns up to 1 year are on The primary investment objective of the Scheme is to seek to provide long term capital growth by investing predominantly in the JPMorgan Funds - Emerging Markets Opportunities Fund, an equity fund which invests primarily in an aggressively managed portfolio of emerging market companies Research Highlights for Edelweiss Emerging Markets Opportunities Equity Off-shore Fund Below is the key information for Edelweiss Emerging Markets Opportunities Equity Off-shore Fund Returns up to 1 year are on "The primary investment objective of the Scheme is to seek capital appreciation by investing predominantly in units of MLIIF - WGF. The Scheme may, at the discretion of the Investment Manager, also invest in the units of other similar overseas mutual fund schemes, which may constitute a significant part of its corpus. The Scheme may also invest a certain portion of its corpus in money market securities and/or units of money market/liquid schemes of DSP Merrill Lynch Mutual Fund, in order to meet liquidity requirements from time to time. However, there is no assurance that the investment objective of the Scheme will be realized." Research Highlights for DSP World Gold Fund Below is the key information for DSP World Gold Fund Returns up to 1 year are on The investment objective of the scheme is to provide long-term capital appreciation by investing in an overseas mutual fund scheme that invests in a diversified portfolio of securities as prescribed by SEBI from time to time in global emerging markets. Research Highlights for Kotak Global Emerging Market Fund Below is the key information for Kotak Global Emerging Market Fund Returns up to 1 year are on The primary investment objective of the Scheme is to seek capital appreciation by investing predominantly in units of BGF – USFEF. The Scheme may, at the discretion of the Investment Manager also invest in the units of other similar overseas mutual fund schemes, which may constitute a significant part of its corpus. The Scheme may also invest a certain portion of its corpus in money market securities and/or money market/liquid schemes of DSP BlackRock Mutual Fund, in order to meet liquidity requirements from time to time. However, there is no assurance that the investment objective of the Scheme will be realized. It shall be noted ‘similar overseas mutual fund schemes’ shall have investment objective, investment strategy and risk profile/consideration similar to those of BGF – USFEF. Research Highlights for DSP US Flexible Equity Fund Below is the key information for DSP US Flexible Equity Fund Returns up to 1 year are on 1. DSP World Mining Fund
DSP World Mining Fund
Growth Launch Date 29 Dec 09 NAV (23 Jul 26) ₹30.5179 ↓ -0.29 (-0.93 %) Net Assets (Cr) ₹164 on 30 Jun 26 Category Equity - Global AMC DSP BlackRock Invmt Managers Pvt. Ltd. Rating ☆☆☆ Risk High Expense Ratio 1.14 Sharpe Ratio 1.74 Information Ratio 0 Alpha Ratio 0 Min Investment 1,000 Min SIP Investment 500 Exit Load 0-12 Months (1%),12 Months and above(NIL) Growth of 10,000 investment over the years.
Date Value 30 Jun 21 ₹10,000 30 Jun 22 ₹9,282 30 Jun 23 ₹10,814 30 Jun 24 ₹11,032 30 Jun 25 ₹11,747 30 Jun 26 ₹20,331 Returns for DSP World Mining Fund
absolute basis & more than 1 year are on CAGR (Compound Annual Growth Rate) basis. as on 23 Jul 26 Duration Returns 1 Month -3.8% 3 Month -7.4% 6 Month -4.4% 1 Year 63.2% 3 Year 23.6% 5 Year 16.3% 10 Year 15 Year Since launch 7% Historical performance (Yearly) on absolute basis
Year Returns 2025 79% 2024 -8.1% 2023 0% 2022 12.2% 2021 18% 2020 34.9% 2019 21.5% 2018 -9.4% 2017 21.1% 2016 49.7% Fund Manager information for DSP World Mining Fund
Name Since Tenure Kaivalya Nadkarni 1 May 25 1.17 Yr. Data below for DSP World Mining Fund as on 30 Jun 26
Equity Sector Allocation
Sector Value Basic Materials 93.17% Energy 1.11% Asset Allocation
Asset Class Value Cash 5.71% Equity 94.28% Debt 0.01% Top Securities Holdings / Portfolio
Name Holding Value Quantity BGF World Mining I2
Investment Fund | -96% ₹180 Cr 141,035 Treps / Reverse Repo Investments
CBLO/Reverse Repo | -4% ₹7 Cr Net Receivables/Payables
Net Current Assets | -0% ₹0 Cr 2. Edelweiss Emerging Markets Opportunities Equity Off-shore Fund
Edelweiss Emerging Markets Opportunities Equity Off-shore Fund
Growth Launch Date 7 Jul 14 NAV (23 Jul 26) ₹28.3172 ↑ 0.23 (0.82 %) Net Assets (Cr) ₹259 on 30 Jun 26 Category Equity - Global AMC Edelweiss Asset Management Limited Rating ☆☆☆ Risk High Expense Ratio 1.04 Sharpe Ratio 2.2 Information Ratio -0.41 Alpha Ratio 6.3 Min Investment 5,000 Min SIP Investment 1,000 Exit Load 0-1 Years (1%),1 Years and above(NIL) Growth of 10,000 investment over the years.
Date Value 30 Jun 21 ₹10,000 30 Jun 22 ₹7,234 30 Jun 23 ₹7,605 30 Jun 24 ₹8,447 30 Jun 25 ₹9,445 30 Jun 26 ₹15,783 Returns for Edelweiss Emerging Markets Opportunities Equity Off-shore Fund
absolute basis & more than 1 year are on CAGR (Compound Annual Growth Rate) basis. as on 23 Jul 26 Duration Returns 1 Month -1.3% 3 Month 8.3% 6 Month 22.5% 1 Year 59.7% 3 Year 26.2% 5 Year 10.3% 10 Year 15 Year Since launch 9% Historical performance (Yearly) on absolute basis
Year Returns 2025 41.1% 2024 5.9% 2023 5.5% 2022 -16.8% 2021 -5.9% 2020 21.7% 2019 25.1% 2018 -7.2% 2017 30% 2016 9.8% Fund Manager information for Edelweiss Emerging Markets Opportunities Equity Off-shore Fund
Name Since Tenure Bhavesh Jain 9 Apr 18 8.23 Yr. Bharat Lahoti 1 Oct 21 4.75 Yr. Data below for Edelweiss Emerging Markets Opportunities Equity Off-shore Fund as on 30 Jun 26
Equity Sector Allocation
Sector Value Technology 35.88% Financial Services 20.6% Consumer Cyclical 10.01% Communication Services 7.79% Industrials 5.82% Energy 5.13% Basic Materials 2.8% Consumer Defensive 1.98% Utility 1.27% Health Care 0.52% Asset Allocation
Asset Class Value Cash 6.04% Equity 93.14% Debt 0.01% Other 0.49% Top Securities Holdings / Portfolio
Name Holding Value Quantity JPM Emerging Mkts Opps I acc USD
Investment Fund | -96% ₹241 Cr 102,137
↑ 3,897 Clearing Corporation Of India Ltd.
CBLO/Reverse Repo | -4% ₹10 Cr Net Receivables/(Payables)
CBLO | -0% -₹1 Cr Accrued Interest
CBLO | -0% ₹0 Cr 3. DSP World Gold Fund
DSP World Gold Fund
Growth Launch Date 14 Sep 07 NAV (23 Jul 26) ₹50.1271 ↓ -1.40 (-2.72 %) Net Assets (Cr) ₹1,433 on 30 Jun 26 Category Equity - Global AMC DSP BlackRock Invmt Managers Pvt. Ltd. Rating ☆☆☆ Risk High Expense Ratio 1.41 Sharpe Ratio 1.22 Information Ratio -0.5 Alpha Ratio 2.12 Min Investment 1,000 Min SIP Investment 500 Exit Load 0-12 Months (1%),12 Months and above(NIL) Growth of 10,000 investment over the years.
Date Value 30 Jun 21 ₹10,000 30 Jun 22 ₹8,181 30 Jun 23 ₹9,294 30 Jun 24 ₹10,640 30 Jun 25 ₹16,808 30 Jun 26 ₹27,693 Returns for DSP World Gold Fund
absolute basis & more than 1 year are on CAGR (Compound Annual Growth Rate) basis. as on 23 Jul 26 Duration Returns 1 Month -5.9% 3 Month -16.7% 6 Month -23.5% 1 Year 57.5% 3 Year 42.3% 5 Year 23.2% 10 Year 15 Year Since launch 8.9% Historical performance (Yearly) on absolute basis
Year Returns 2025 167.1% 2024 15.9% 2023 7% 2022 -7.7% 2021 -9% 2020 31.4% 2019 35.1% 2018 -10.7% 2017 -4% 2016 52.7% Fund Manager information for DSP World Gold Fund
Name Since Tenure Kaivalya Nadkarni 1 May 25 1.17 Yr. Data below for DSP World Gold Fund as on 30 Jun 26
Equity Sector Allocation
Sector Value Basic Materials 94.47% Asset Allocation
Asset Class Value Cash 3.62% Equity 94.47% Debt 0% Other 1.91% Top Securities Holdings / Portfolio
Name Holding Value Quantity BGF World Gold I2
Investment Fund | -68% ₹1,141 Cr 1,005,044 VanEck Gold Miners ETF
- | GDX29% ₹490 Cr 573,719 Treps / Reverse Repo Investments
CBLO/Reverse Repo | -3% ₹54 Cr Net Receivables/Payables
Net Current Assets | -0% -₹6 Cr 4. Kotak Global Emerging Market Fund
Kotak Global Emerging Market Fund
Growth Launch Date 26 Sep 07 NAV (23 Jul 26) ₹39.319 ↑ 0.38 (0.98 %) Net Assets (Cr) ₹1,767 on 30 Jun 26 Category Equity - Global AMC Kotak Mahindra Asset Management Co Ltd Rating ☆☆☆ Risk High Expense Ratio 1.64 Sharpe Ratio 1.88 Information Ratio -0.25 Alpha Ratio -1.76 Min Investment 5,000 Min SIP Investment 1,000 Exit Load 0-1 Years (1%),1 Years and above(NIL) Growth of 10,000 investment over the years.
Date Value 30 Jun 21 ₹10,000 30 Jun 22 ₹7,904 30 Jun 23 ₹8,130 30 Jun 24 ₹9,267 30 Jun 25 ₹10,468 30 Jun 26 ₹16,878 Returns for Kotak Global Emerging Market Fund
absolute basis & more than 1 year are on CAGR (Compound Annual Growth Rate) basis. as on 23 Jul 26 Duration Returns 1 Month -3.5% 3 Month 6.9% 6 Month 16.2% 1 Year 49.5% 3 Year 25.1% 5 Year 11.3% 10 Year 15 Year Since launch 7.5% Historical performance (Yearly) on absolute basis
Year Returns 2025 39.1% 2024 5.9% 2023 10.8% 2022 -15% 2021 -0.5% 2020 29.1% 2019 21.4% 2018 -14.4% 2017 30.4% 2016 -1.2% Fund Manager information for Kotak Global Emerging Market Fund
Name Since Tenure Arjun Khanna 9 May 19 7.15 Yr. Data below for Kotak Global Emerging Market Fund as on 30 Jun 26
Equity Sector Allocation
Sector Value Technology 43.42% Financial Services 19.61% Industrials 8.58% Consumer Cyclical 8.12% Basic Materials 6.67% Communication Services 5.05% Energy 4.51% Health Care 0.71% Asset Allocation
Asset Class Value Cash 3.32% Equity 96.68% Top Securities Holdings / Portfolio
Name Holding Value Quantity CI Emerging Markets Class A
Investment Fund | -98% ₹1,762 Cr 4,589,366
↑ 100,988 Triparty Repo
CBLO/Reverse Repo | -2% ₹33 Cr Net Current Assets/(Liabilities)
Net Current Assets | -0% -₹2 Cr 5. DSP US Flexible Equity Fund
DSP US Flexible Equity Fund
Growth Launch Date 3 Aug 12 NAV (23 Jul 26) ₹92.839 ↓ -1.09 (-1.16 %) Net Assets (Cr) ₹1,291 on 30 Jun 26 Category Equity - Global AMC DSP BlackRock Invmt Managers Pvt. Ltd. Rating ☆☆☆☆☆ Risk High Expense Ratio 1.55 Sharpe Ratio 1.93 Information Ratio 0.15 Alpha Ratio -4.1 Min Investment 1,000 Min SIP Investment 500 Exit Load 0-12 Months (1%),12 Months and above(NIL) Growth of 10,000 investment over the years.
Date Value 30 Jun 21 ₹10,000 30 Jun 22 ₹9,273 30 Jun 23 ₹11,265 30 Jun 24 ₹13,557 30 Jun 25 ₹15,785 30 Jun 26 ₹23,371 Returns for DSP US Flexible Equity Fund
absolute basis & more than 1 year are on CAGR (Compound Annual Growth Rate) basis. as on 23 Jul 26 Duration Returns 1 Month -1.3% 3 Month 7.5% 6 Month 16.8% 1 Year 44.5% 3 Year 26.4% 5 Year 18% 10 Year 15 Year Since launch 17.3% Historical performance (Yearly) on absolute basis
Year Returns 2025 33.8% 2024 17.8% 2023 22% 2022 -5.9% 2021 24.2% 2020 22.6% 2019 27.5% 2018 -1.1% 2017 15.5% 2016 9.8% Fund Manager information for DSP US Flexible Equity Fund
Name Since Tenure Kaivalya Nadkarni 1 May 25 1.17 Yr. Data below for DSP US Flexible Equity Fund as on 30 Jun 26
Equity Sector Allocation
Sector Value Technology 33.05% Industrials 13.62% Financial Services 12.17% Communication Services 12.05% Consumer Cyclical 9.62% Health Care 7.65% Basic Materials 2.45% Energy 2.43% Asset Allocation
Asset Class Value Cash 6.96% Equity 93.02% Debt 0.01% Top Securities Holdings / Portfolio
Name Holding Value Quantity BGF US Flexible Equity I2
Investment Fund | -96% ₹1,265 Cr 1,784,131
↓ -32,921 Treps / Reverse Repo Investments
CBLO/Reverse Repo | -4% ₹59 Cr Net Receivables/Payables
Net Current Assets | -0% -₹2 Cr
Conclusion
The final choice to invest via the lump sum route or SIPs would be a culmination of many factors, however, the investor needs to take into account all these and his/her risk appetite to choose the best route. Choose well, choose wisely, stay invested!
All efforts have been made to ensure the information provided here is accurate. However, no guarantees are made regarding correctness of data. Please verify with scheme information document before making any investment.


AMFI Registration No. 112358 | CIN: U74999MH2016PTC282153
Shepard Technologies Pvt. Ltd. (with ARN code 112358) makes no warranties or representations, express or implied, on products offered through the platform. It accepts no liability for any damages or losses, however caused, in connection with the use of, or on the reliance of its product or related services. Terms and conditions of the website are applicable.
©2026 Shepard Technologies Private Limited. All Rights Reserved
Research Highlights for DSP World Mining Fund