 +91-22-48913909
Table of Contents
لائف ٹائم فری میوچل فنڈز انویسٹمنٹ اکاؤنٹ
Fincash.com کی دنیا میں آپ کا استقبال ہے !!! سب سے پہلے ، ہم آپ کو اپنا میوچل فنڈ انویسٹمنٹ چینل منتخب کرنے پر آپ کا شکریہ ادا کرنا چاہتے ہیں۔
کیا آپ مبتدی ہیں؟ کیا آپ ایک تجربہ کار ہیںسرمایہ کار؟ پریشان نہ ہوں ، آپ کی ساری ضروریات پوری ہوجائیں گی۔ یقین دہانی کرو ، کیوں کہ ہم ہر قدم پر آپ کی رہنمائی کے لئے ہمہ وقت موجود ہیں خواہ سرمایہ کاری ، مصنوع کا انتخاب ، رجسٹریشن یا کسی بھی دوسرے سوال سے متعلق ہو۔ لہذا ، آئی ایس کی خصوصیات کی بہتر تفہیم حاصل کرنے کے لئے آگے بڑھیںلائف ٹائم فریباہمی چندہ انوسٹمنٹ اکاؤنٹ رجسٹریشن کے عمل کے ساتھ ساتھ.
Talk to our investment specialist
Fincash.com انویسٹمنٹ اکاؤنٹ کیوں؟
Fincash.com ہمیشہ "کسٹمر فرسٹ" پالیسی پر یقین رکھتا ہے۔ ہم ہمیشہ مؤکل کی ضروریات کو مدنظر رکھتے ہوئے اور کس حد تک مؤثر طریقے سے اس کی تکمیل کی جاسکتی ہیں کو مدنظر رکھتے ہوئے اعلی درجے کی کسٹمر سروس فراہم کرنا یقینی بناتے ہیں۔ ہمارا مقصد آپ کے پیسے کی قدر پیدا کرنا ہے تاکہ آپ مقررہ مدت کے اندر اپنے مقاصد حاصل کرسکیں۔ فنکاش ڈاٹ کام کی کچھ سرمایہ کار دوست خصوصیات میں شامل ہیں:
- صارف دوست ویب سائٹ تاکہ آپ کو کم سے کم کلکس میں زیادہ سے زیادہ معلومات حاصل ہوں
- لائف ٹائم ایکٹو اور فری اکاؤنٹ جہاں سرمایہ کاروں کو لین دین نہ کرنے کے باوجود کوئی رقم ادا کرنے کی ضرورت نہیں ہے۔
- آسان رجسٹریشن کا عمل جہاں لوگوں کو زیادہ وقت گزارنے کی ضرورت نہیں ہے۔
- KYC تعمیل جس کے ذریعے ہمارے فریم ورک کے اندر کام کیا جاسکتا ہےeKYC اور واقعی پہلے مرتبہ کے لئے مفید ہے۔
- حفاظت اور حفاظت ہماری ترجیح پر ہمیشہ ہیں جہاں؛ ہم اس بات کو یقینی بناتے ہیں کہ موکل کا ڈیٹا اور ان کے سارے لین دین کو راز میں رکھا جائے۔
- اسکیموں کی وسیع رینج جسے لوگ اپنی ضروریات کے مطابق منتخب کرسکتے ہیں۔
- حسب ضرورت حل فنکاش ڈاٹ کام کی جو سرمایہ کاروں کو زمرہ جات کے تحت اپنی مصنوعات کے انتخاب کے عمل کو آسان بنانے میں مدد کرتا ہےای ایل ایس ایس، ایس آئی پیز ، اورٹیکس کی بچت اسکیم.
Fincash.com کے لئے اندراج کا عمل
ٹھیک ہے ، آپ کا لائف ٹائم فری میوچل فنڈ انویسٹمنٹ اکاؤنٹ کھولنے کے لئے اندراج کا عمل کافی آسان ہے۔ اپنی رجسٹریشن مکمل کرنے کے ل you ، آپ کی ضرورت ہے:
- ایک فعال موبائل نمبر
- پین نمبر
- آدھار نمبر
- اسکین شدہ کاپی / ذاتی منسوخ چیک کی تصویر ، بینکبیان، پاس بک کا فرنٹ پیج
- اسکین شدہ کاپی / آپ کے دستخط کی تصویر
آئیے رجسٹریشن کے عمل کو دیکھیں:
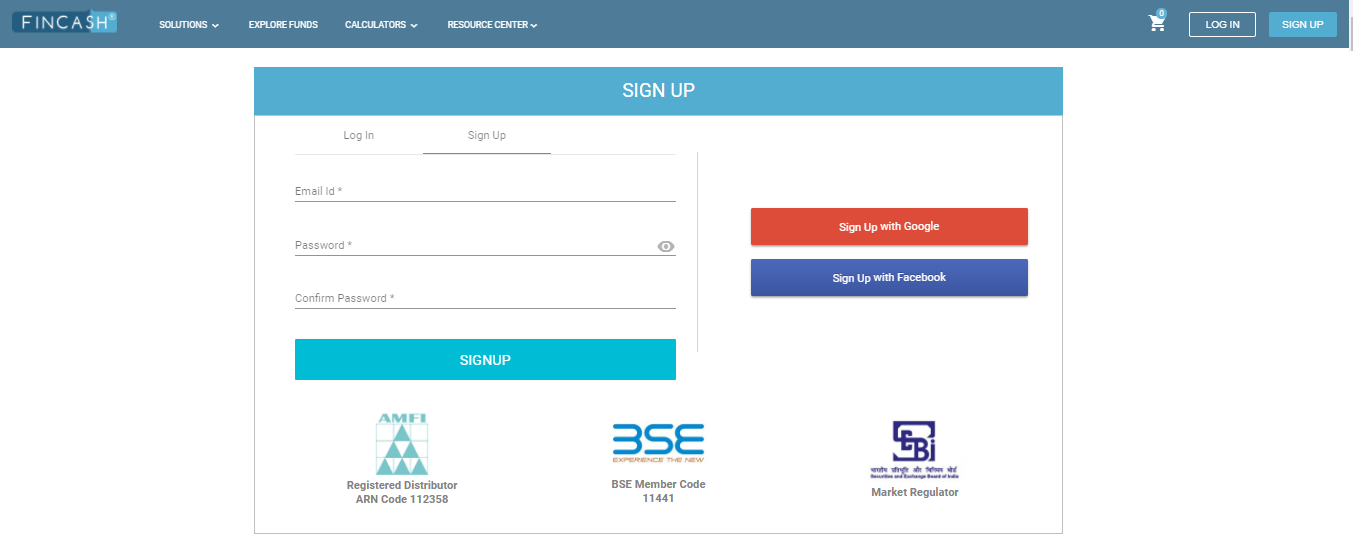
مرحلہ 1: اپنا لاگ ان بنائیں
پہلا قدم آپ کا لاگ ان بنانے کے ساتھ شروع ہوتا ہے۔ اپنا لاگ ان آئی ڈی بنانے کے ل. ، پہلے آپ کو ویب سائٹ دیکھنے کی ضرورت ہوگیwww.fincash.com اور پر کلک کریںسائن اپ اس بٹن پر کلک کرنے کے بعد ، آپ کو اپنا ای میل ایڈریس اور پاس ورڈ درج کرنے کی ضرورت ہے۔ جب بھی ٹرانزیکشن کرتے وقت یہ لاگ ان آئی ڈی آپ استعمال کریں گے۔ لہذا ، یقینی بنائیں کہ آپ اپنا درست اور درست ای میل پتہ دیتے ہیں۔ یہاں تک کہ آپ فیس بک یا جی میل آئی ڈی کا استعمال کرکے سوشل سائن اپ بھی کرسکتے ہیں۔ لاگ ان بٹن ٹیب اور لاگ ان اسکرین کو دکھا رہی تصویر نیچے دکھائی گئی ہے۔
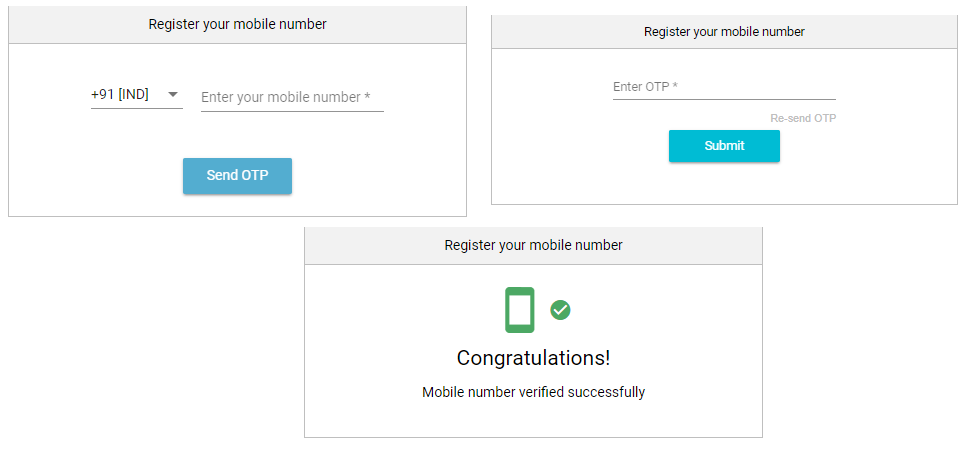
مرحلہ 2: موبائل کی توثیق
اپنا لاگ ان آئی ڈی بنانے کے بعد ، اگلا مرحلہ موبائل نمبر کی تصدیق سے متعلق ہے۔ دوسرے الفاظ میں ، لاگ ان ID کی تخلیق کے بعد ، اسکرین کو موبائل نمبر کی توثیق پر ری ڈائریکٹ کردیا جاتا ہے جہاں لوگوں کو اپنا موبائل نمبر داخل کرنے کی ضرورت ہوتی ہے۔ موبائل نمبر داخل کرنے پر ، انہیں ایس ایم ایس کے ذریعے ون ٹائم پاس ورڈ (OTP) موصول ہوتا ہے جس کو دوبارہ اسکرین پر داخل کرنے کی ضرورت ہے۔ لہذا ، محتاط رہیں کہ آپ اپنا صحیح اور فعال موبائل نمبر داخل کریں۔ نیز ، او ٹی پی میں داخل ہوتے وقت ، اس بات کو یقینی بنائیں کہ تمام حرف صحیح طور پر داخل ہوئے ہیں۔ دوسرے مرحلے کے لئے تصویر مندرجہ ذیل ہے۔
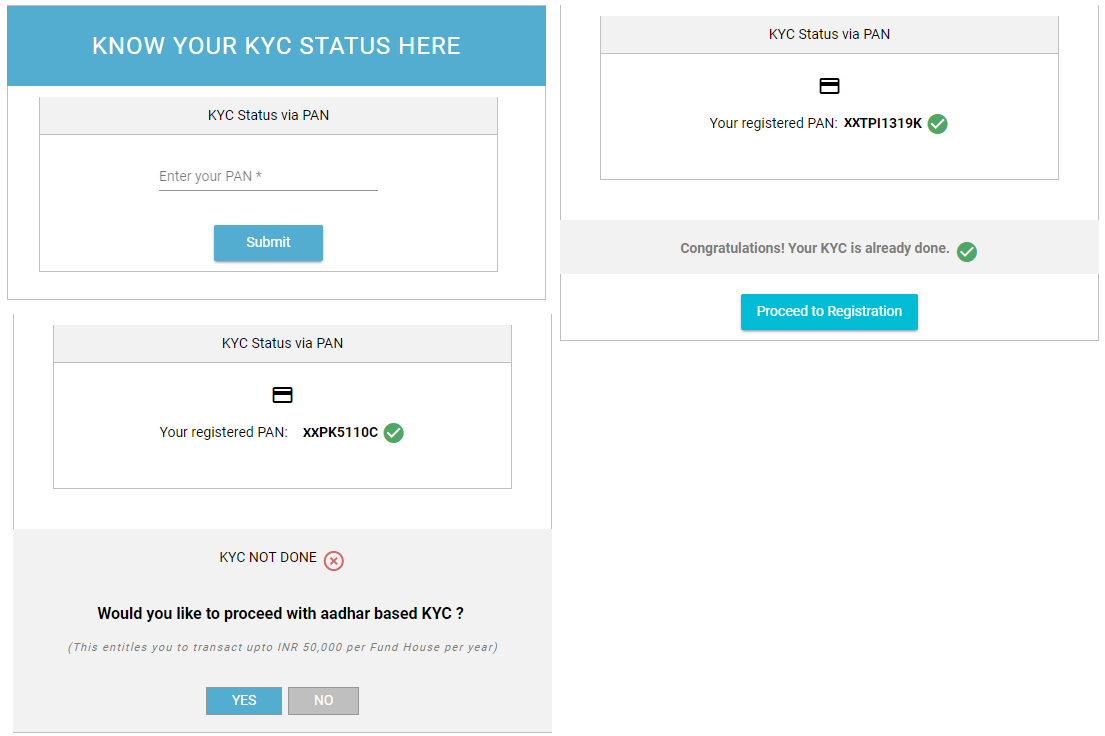
مرحلہ 3: پین ایم ایف کے وائی سی اسٹیٹس چیک
تیسرا مرحلہ یہ یقینی بناتا ہے کہ ، چاہے آپ کے وائی سی کے مطابق سرمایہ کار ہوں یا نہیں۔ ایم ایف کے وائی سی یا جانئے آپ کا صارف ایک وقت کا عمل ہے جسے آپ کو پہلے مکمل کرنا ہوگاسرمایہ کاری باہمی فنڈز میں رقمکے وائی سی کی حیثیت آپ کے پین کا استعمال کرتے ہوئے تصدیق شدہ ہے۔ اگر آپ نے پہلے ہی اپنے KYC عمل کو مکمل کرلیا ہے ، تو آپ کو اس کے لئے ایک پاپ اپ مل جائے گا اور اندراج کے عمل کے ساتھ آگے بڑھ سکتے ہیں۔ ان لوگوں کے لئے جنہوں نے آپ کے کے سی کے عمل کو مکمل نہیں کیا ہے ، پاپ اپ ہو گا "کیا آپ آدھار ای کے وائی سی کے ساتھ آگے بڑھنا پسند کریں گے؟" اس میں ، آپ کا انتخاب ہوگا کہ ای کے وائی سی عمل کے ساتھ آگے بڑھیں یا نہیں۔ نیچے دی گئی شبیہہ میں پین ایم ایف کے وائی سی اسٹیٹس چیک کے لئے اسکرین اسنیپ شاٹ دکھایا گیا ہے۔
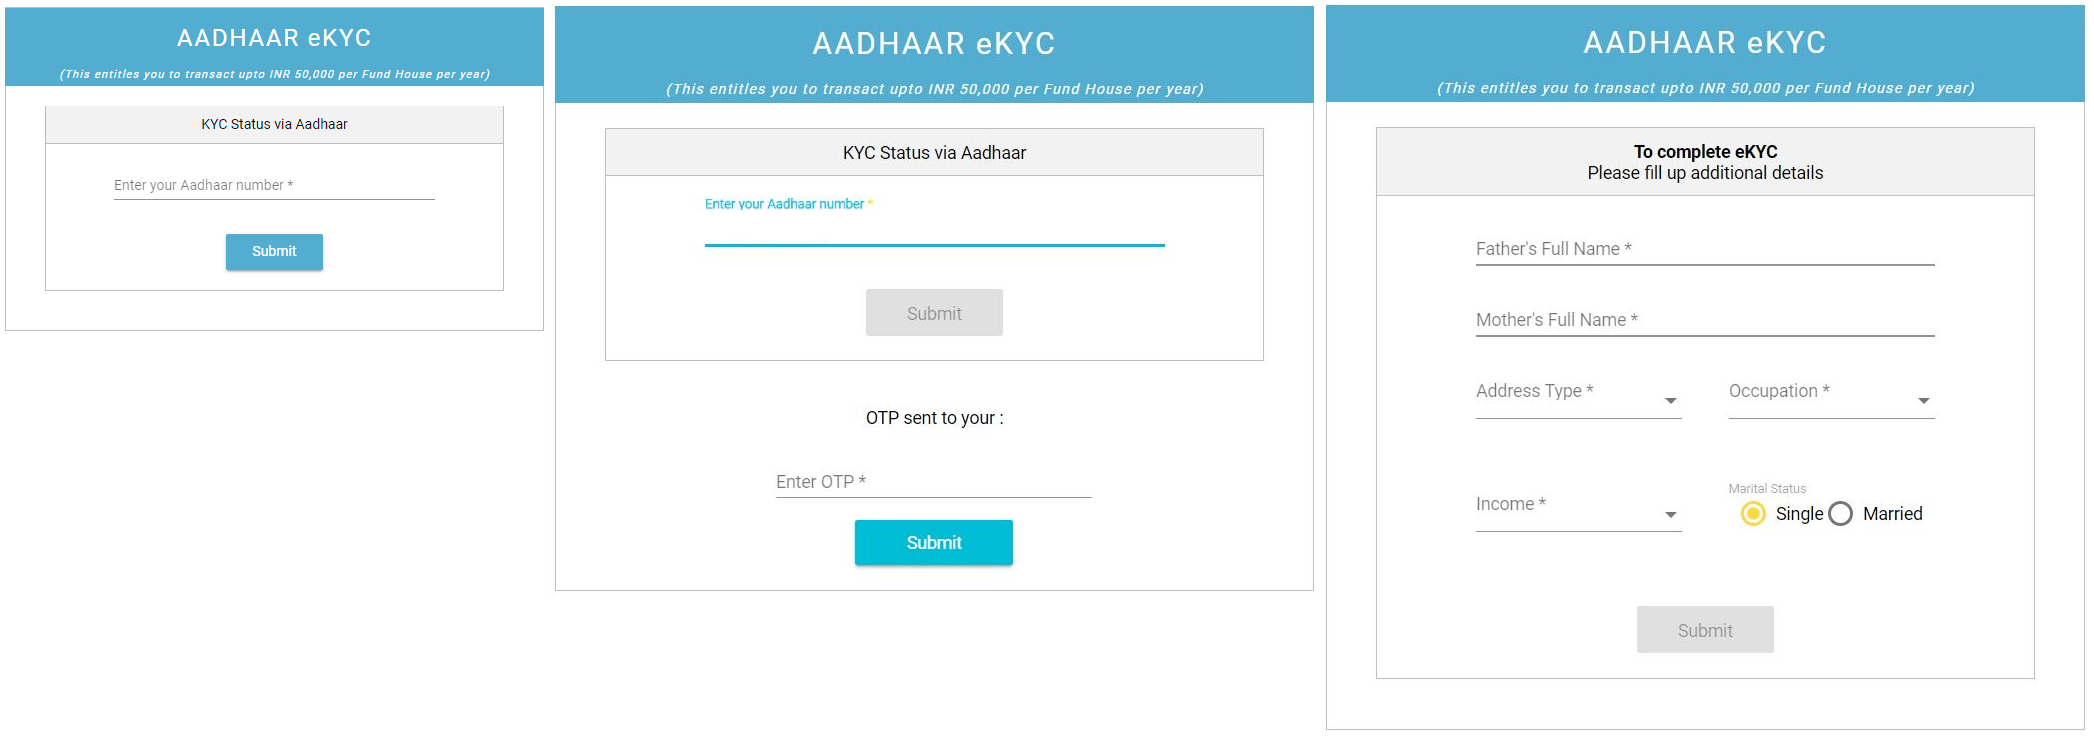
مرحلہ 4: ای کی وائی سی کی مکمل شکلیں
جیسا کہ پچھلے مرحلے میں بتایا گیا ہے ، آپ کے پاس آدھار پر مبنی KYC یعنی eKYC کو منتخب کرنے کا انتخاب ہے۔ لوگ اپنے آکے نمبر کے ذریعہ ای کے وائی سی عمل کو مکمل کرسکتے ہیں۔ تاہم ، ای وائی سی کے استعمال سے صرف ایک مالی سال میں 50،000 امریکی ڈالر تک کی سرمایہ کاری کی جاسکتی ہے۔ ایک بار جب آپ eKYC تکمیل کے لئے "ہاں" کے اختیار پر کلک کریں ، تو آپ کو ایک اسکرین پر بھیج دیا جائے گا۔ آپ کو اپنا آدھار نمبر درج کرنا ہوگا۔ آدھار نمبر داخل کرنے کے بعد ، آپ کو دوبارہ اپنے رجسٹرڈ موبائل نمبر پر ایک او ٹی پی ملے گا۔ آپ کو یہ او ٹی پی داخل کرنے اور اضافی تفصیلات کے فارم کو پُر کرنے کی ضرورت ہے۔ ای کے وائی سی عمل کی تکمیل کو ظاہر کرنے کے اقدام کے لئے تصویر مندرجہ ذیل ہے۔
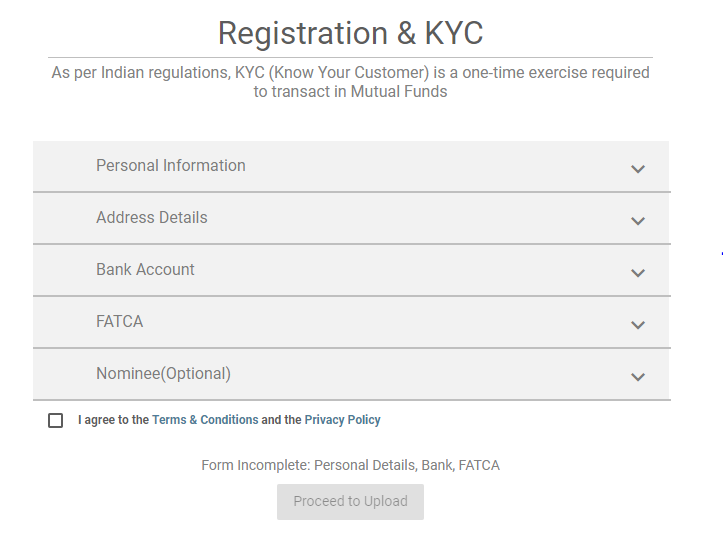
مرحلہ 5: رجسٹریشن فارم
یہ عمل تمام افراد کو مکمل کرنے کی ضرورت ہے۔ رجسٹریشن کے مقاصد کے ل. ، آپ کو فارم پُر کرنے کی ضرورت ہے ، جو 5 مختلف ٹیبز میں پھیلی ہوئی ہے۔ ان ٹیبز میں ذاتی معلومات ، پتہ کی تفصیلات ، بینک اکاؤنٹ ، ایف اے ٹی سی اے کی تفصیلات ، اور نمایندہ شامل ہیں۔ تمام ٹیبز کو پُر کرکے اور متعلقہ دستاویزات اپ لوڈ کرکے ، آپ مکمل KYC عمل مکمل کرتے ہیں اور کسی بھی رقم تک میوچل فنڈز میں سرمایہ کاری کرسکتے ہیں۔ تمام تفصیلات کو بھرنے کے بعد ، آپ کو اگلے مرحلے پر آگے بڑھنے کے لئے ، چیک باکس پر کلک کرنے کی ضرورت ہے۔ ذیل میں جیسا کہ چیک باکس کے ساتھ رجسٹریشن فارم کے مختلف ٹیبز دکھاتا ہے۔
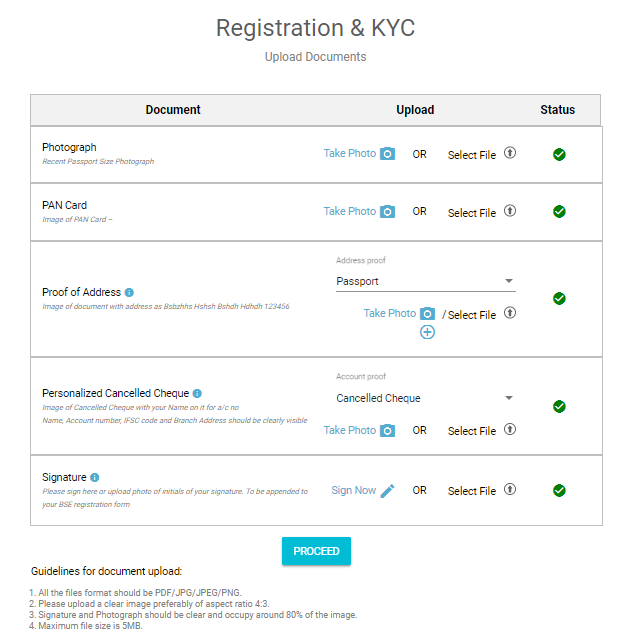
مرحلہ 6: دستاویزات اپ لوڈ کریں
یہ آپ کے اندراج کے عمل کا آخری مرحلہ ہے۔ اگر آپ نے کے وائی سی عمل مکمل کرلیا ہے ، تو آپ کو صرف اپ لوڈ کرنے کی ضرورت ہے۔
- اسکین شدہ کاپی / آپ کے دستخط کی تصویر اور
- اسکین شدہ کاپی / آپ کی ذاتی نوعیت کی جانچ کی تصویر۔
تاہم ، اگر آپ نے eKYC مکمل نہیں کیا ہے اور آپ KYC کے مطابق نہیں ہیں تو مذکورہ دستاویزات کے ساتھ ، آپ کو اپ لوڈ کرنے کی ضرورت ہے
- تصویر
- سکین شدہ کاپی / پین کارڈ کی تصویر اور
- ایڈریس پروف کی اسکین شدہ کاپی / امیج
دستاویزات اپ لوڈ کرنے کی صورت میں ، اسکرین کا ڈسپلے ذیل میں دیا گیا ہے۔
اس طرح ، ہم دیکھ سکتے ہیں کہ اندراج کا عمل کافی آسان ہے۔ اب حتمی حصہ جو Fincash.com کے حسب ضرورت حل ہیں۔ فینکاش ڈاٹ کام کا یو ایس پی اس کا تخصیص کردہ حل ہے جو مصنوعات کے انتخاب کے عمل کو آسان بنانے میں مدد کرتا ہے۔
Fincash حل
یہ تینوں حل عام سرمایہ کاری کی ضرورت کے لئے ہیں۔
بچت پلس
یہ حل ان لوگوں کے لئے موزوں ہے جو اپنے بچت بینک اکاؤنٹ میں بیکار رقم رکھتے ہیں اور زیادہ سے زیادہ آمدنی بڑھانے کے راستوں کی تلاش میں ہیں۔بچت سب سے اوپر تین کا ایک بنڈل ہےمائع فنڈ کے مقابلے میں زیادہ منافع کی پیش کش کرنے والی اسکیمیںبچت اکاونٹ. اضافی طور پر ، ان فنڈز کو ایک محفوظ سرمایہ کاری کے لئے سمجھا جاتا ہے۔ بچت پلس کی کچھ خصوصیات یہ ہیں:
- زیادہ منافع
- فوری چھٹکارا
- کوئی لاک ان یا ایگزٹ بوجھ نہیں ہے
- ایک کلک میں سرمایہ کاری اور چھڑانا
اسمارٹ ایس آئی پی
smartsip سب سے اوپر تین ایکوئٹی فنڈ اسکیموں کا ایک بنڈل ہے جو مستحکم سمجھا جاتا ہے اور اس نے وقتا فوقتا اچھی آمدنی حاصل کی ہے۔ یہ طویل مدتی سرمایہ کاری کی مدت رکھنے والے لوگوں کے لئے موزوں ہے۔ جیسا کہ نام سے پتہ چلتا ہےگھونٹ، لوگ اپنے مقاصد کو حاصل کرنے کے لئے اس اسکیموں میں تھوڑی مقدار میں سرمایہ کاری کرسکتے ہیں۔ اسمارٹ ایس آئی پی کی خصوصیات میں شامل ہیں:
- پہلے سے منتخب کردہ ٹاپ 3 ایس آئی پی اسکیمیں
- 20،000 سکیموں کے تجزیہ کے بعد اسکیموں کا انتخاب کیا گیا
- صحت مند واپسی کمائیں
اسمارٹ ایس آئی پی چیک آؤٹ کریں
ٹیکس سیور
تیسرا حلٹیکس بچانے والا دو کا بنڈل ہےایکویٹی باہمی فنڈز کہ دےسرمایہ کاری کے فوائد اور ٹیکس کے فوائد ٹیکس سیور کے ذریعہ ، لوگ 1،50،000 سے کم تک کے ٹیکس میں کٹوتی کا دعوی کرسکتے ہیںسیکشن 80 سی کےانکم ٹیکس ایک مخصوص مالیاتی سال کے لئے ایکٹ ، 1961۔ ہونے کی وجہ سےٹیکس کی بچت کی سرمایہ کاری، ان کے پاس تین سال کا عرصہ ہے۔ ان کی خصوصیات میں شامل ہیں:
- ELSS زمرے میں تجزیہ کے بعد منتخب کیا گیا
- پہلے سے منتخب ٹاپ 2 بہترین ایکویٹی لنکڈ سیونگ اسکیمز (ELSS)
- ٹیکس کی بچت کریں اور صحتمند منافع کمائیں
سرمایہ کاری شروع کرنے کے ل Best بہترین باہمی فنڈز
ذیل میں فہرست ہےبہترین باہمی فنڈز ایک بار مذکورہ بالا اثاثوں / اے یو ایم میں سرمایہ کاری کرسکتا ہے500 کروڑ.
The objective of the scheme would be to provide investors with opportunities for long-term growth in capital along with the liquidity of an open-ended scheme through an active management of investments in a diversified basket of equity stocks of domestic Public Sector Undertakings and in debt and money market instruments issued by PSUs AND others. SBI PSU Fund is a Equity - Sectoral fund was launched on 7 Jul 10. It is a fund with High risk and has given a Below is the key information for SBI PSU Fund Returns up to 1 year are on The investment objective of Franklin India Opportunities Fund (FIOF) is to generate capital appreciation by capitalizing on the long-term growth opportunities in the Indian economy. Franklin India Opportunities Fund is a Equity - Sectoral fund was launched on 21 Feb 00. It is a fund with Moderately High risk and has given a Below is the key information for Franklin India Opportunities Fund Returns up to 1 year are on To generate capital appreciation by investing in Equity and Equity Related Instruments of companies where the Central / State Government(s) has majority shareholding or management control or has powers to appoint majority of directors. However, there is no assurance or guarantee that the investment objective of the Scheme will be achieved. The Scheme does not assure or guarantee any returns. Invesco India PSU Equity Fund is a Equity - Sectoral fund was launched on 18 Nov 09. It is a fund with High risk and has given a Below is the key information for Invesco India PSU Equity Fund Returns up to 1 year are on To seek long-term capital appreciation by investing predominantly in equity and equity related securities of companies engaged in or expected to benefit from growth and development of infrastructure. HDFC Infrastructure Fund is a Equity - Sectoral fund was launched on 10 Mar 08. It is a fund with High risk and has given a Below is the key information for HDFC Infrastructure Fund Returns up to 1 year are on To generate capital appreciation and income distribution to unit holders by investing predominantly in equity/equity related securities of the companies belonging to the infrastructure development and balance in debt securities and money market instruments. ICICI Prudential Infrastructure Fund is a Equity - Sectoral fund was launched on 31 Aug 05. It is a fund with High risk and has given a Below is the key information for ICICI Prudential Infrastructure Fund Returns up to 1 year are on 1. SBI PSU Fund
CAGR/Annualized return of 8% since its launch. Ranked 31 in Sectoral category. Return for 2024 was 23.5% , 2023 was 54% and 2022 was 29% . SBI PSU Fund
Growth Launch Date 7 Jul 10 NAV (21 Apr 25) ₹31.2713 ↑ 0.66 (2.15 %) Net Assets (Cr) ₹4,789 on 31 Mar 25 Category Equity - Sectoral AMC SBI Funds Management Private Limited Rating ☆☆ Risk High Expense Ratio 2.3 Sharpe Ratio 0.07 Information Ratio -0.23 Alpha Ratio 3.14 Min Investment 5,000 Min SIP Investment 500 Exit Load 0-1 Years (1%),1 Years and above(NIL) Growth of 10,000 investment over the years.
Date Value 31 Mar 20 ₹10,000 31 Mar 21 ₹13,883 31 Mar 22 ₹17,382 31 Mar 23 ₹19,831 31 Mar 24 ₹37,078 31 Mar 25 ₹39,285 Returns for SBI PSU Fund
absolute basis & more than 1 year are on CAGR (Compound Annual Growth Rate) basis. as on 21 Apr 25 Duration Returns 1 Month 5.8% 3 Month 5% 6 Month -4% 1 Year 6.1% 3 Year 30% 5 Year 31.2% 10 Year 15 Year Since launch 8% Historical performance (Yearly) on absolute basis
Year Returns 2023 23.5% 2022 54% 2021 29% 2020 32.4% 2019 -10% 2018 6% 2017 -23.8% 2016 21.9% 2015 16.2% 2014 -11.1% Fund Manager information for SBI PSU Fund
Name Since Tenure Rohit Shimpi 1 Jun 24 0.75 Yr. Data below for SBI PSU Fund as on 31 Mar 25
Equity Sector Allocation
Sector Value Financial Services 35.9% Utility 24.13% Energy 17.02% Industrials 10.67% Basic Materials 6.34% Asset Allocation
Asset Class Value Cash 5.81% Equity 94.07% Debt 0.12% Top Securities Holdings / Portfolio
Name Holding Value Quantity State Bank of India (Financial Services)
Equity, Since 31 Jul 10 | SBIN14% ₹591 Cr 8,577,500 GAIL (India) Ltd (Utilities)
Equity, Since 31 May 24 | 5321559% ₹380 Cr 24,350,000 Power Grid Corp Of India Ltd (Utilities)
Equity, Since 31 Jul 10 | 5328989% ₹380 Cr 15,135,554
↑ 950,000 Bharat Electronics Ltd (Industrials)
Equity, Since 30 Jun 24 | BEL8% ₹334 Cr 13,575,000
↑ 800,000 Bharat Petroleum Corp Ltd (Energy)
Equity, Since 31 Aug 24 | 5005476% ₹230 Cr 9,700,000 NMDC Ltd (Basic Materials)
Equity, Since 31 Oct 23 | 5263714% ₹174 Cr 27,900,000 NTPC Ltd (Utilities)
Equity, Since 31 Jul 10 | 5325554% ₹170 Cr 5,443,244 Bank of Baroda (Financial Services)
Equity, Since 31 Aug 24 | 5321344% ₹154 Cr 7,800,000 General Insurance Corp of India (Financial Services)
Equity, Since 31 May 24 | GICRE4% ₹153 Cr 4,150,000
↑ 550,000 SBI Cards and Payment Services Ltd Ordinary Shares (Financial Services)
Equity, Since 31 Oct 24 | SBICARD3% ₹138 Cr 1,650,000 2. Franklin India Opportunities Fund
CAGR/Annualized return of 13.4% since its launch. Ranked 47 in Sectoral category. Return for 2024 was 37.3% , 2023 was 53.6% and 2022 was -1.9% . Franklin India Opportunities Fund
Growth Launch Date 21 Feb 00 NAV (21 Apr 25) ₹236.995 ↑ 3.38 (1.45 %) Net Assets (Cr) ₹6,047 on 31 Mar 25 Category Equity - Sectoral AMC Franklin Templeton Asst Mgmt(IND)Pvt Ltd Rating ☆☆☆ Risk Moderately High Expense Ratio 2.12 Sharpe Ratio 0.46 Information Ratio 1.68 Alpha Ratio 8.45 Min Investment 5,000 Min SIP Investment 500 Exit Load 0-1 Years (1%),1 Years and above(NIL) Growth of 10,000 investment over the years.
Date Value 31 Mar 20 ₹10,000 31 Mar 21 ₹18,903 31 Mar 22 ₹21,132 31 Mar 23 ₹23,026 31 Mar 24 ₹37,539 31 Mar 25 ₹43,201 Returns for Franklin India Opportunities Fund
absolute basis & more than 1 year are on CAGR (Compound Annual Growth Rate) basis. as on 21 Apr 25 Duration Returns 1 Month 4% 3 Month 0% 6 Month -5.6% 1 Year 14.5% 3 Year 28.5% 5 Year 32.9% 10 Year 15 Year Since launch 13.4% Historical performance (Yearly) on absolute basis
Year Returns 2023 37.3% 2022 53.6% 2021 -1.9% 2020 29.7% 2019 27.3% 2018 5.4% 2017 -10.1% 2016 35.6% 2015 4.2% 2014 2.3% Fund Manager information for Franklin India Opportunities Fund
Name Since Tenure Kiran Sebastian 7 Feb 22 3.06 Yr. R. Janakiraman 1 Apr 13 11.92 Yr. Sandeep Manam 18 Oct 21 3.37 Yr. Data below for Franklin India Opportunities Fund as on 31 Mar 25
Equity Sector Allocation
Sector Value Consumer Cyclical 19.47% Financial Services 13.37% Health Care 11.56% Communication Services 9.09% Basic Materials 8.49% Technology 7.97% Industrials 6.9% Energy 4.32% Consumer Defensive 3.74% Real Estate 2.22% Utility 1.37% Asset Allocation
Asset Class Value Cash 8.98% Equity 91.02% Top Securities Holdings / Portfolio
Name Holding Value Quantity HDFC Bank Ltd (Financial Services)
Equity, Since 31 May 24 | HDFCBANK5% ₹301 Cr 1,735,296
↑ 676,365 Reliance Industries Ltd (Energy)
Equity, Since 30 Apr 22 | RELIANCE4% ₹238 Cr 1,987,098 Bharti Airtel Ltd (Communication Services)
Equity, Since 31 Jan 24 | BHARTIARTL4% ₹211 Cr 1,342,233 Mahindra & Mahindra Ltd (Consumer Cyclical)
Equity, Since 31 May 24 | M&M3% ₹165 Cr 637,966 Mphasis Ltd (Technology)
Equity, Since 30 Nov 24 | 5262993% ₹160 Cr 710,533 Lemon Tree Hotels Ltd (Consumer Cyclical)
Equity, Since 31 Aug 24 | LEMONTREE3% ₹156 Cr 12,833,401 Info Edge (India) Ltd (Communication Services)
Equity, Since 31 Jul 24 | NAUKRI3% ₹151 Cr 216,138 APL Apollo Tubes Ltd (Basic Materials)
Equity, Since 31 Oct 24 | APLAPOLLO3% ₹144 Cr 998,385 Zomato Ltd (Consumer Cyclical)
Equity, Since 31 Aug 23 | 5433203% ₹142 Cr 6,398,413 CE Info Systems Ltd (Technology)
Equity, Since 31 Mar 24 | 5434253% ₹139 Cr 835,883
↑ 76,164 3. Invesco India PSU Equity Fund
CAGR/Annualized return of 12.3% since its launch. Ranked 33 in Sectoral category. Return for 2024 was 25.6% , 2023 was 54.5% and 2022 was 20.5% . Invesco India PSU Equity Fund
Growth Launch Date 18 Nov 09 NAV (21 Apr 25) ₹60.06 ↑ 1.19 (2.02 %) Net Assets (Cr) ₹1,217 on 31 Mar 25 Category Equity - Sectoral AMC Invesco Asset Management (India) Private Ltd Rating ☆☆☆ Risk High Expense Ratio 2.39 Sharpe Ratio 0.06 Information Ratio -0.47 Alpha Ratio 3.27 Min Investment 5,000 Min SIP Investment 500 Exit Load 0-1 Years (1%),1 Years and above(NIL) Growth of 10,000 investment over the years.
Date Value 31 Mar 20 ₹10,000 31 Mar 21 ₹14,149 31 Mar 22 ₹17,370 31 Mar 23 ₹19,711 31 Mar 24 ₹36,141 31 Mar 25 ₹37,811 Returns for Invesco India PSU Equity Fund
absolute basis & more than 1 year are on CAGR (Compound Annual Growth Rate) basis. as on 21 Apr 25 Duration Returns 1 Month 6.2% 3 Month 3.4% 6 Month -7.2% 1 Year 5.9% 3 Year 28.3% 5 Year 29.3% 10 Year 15 Year Since launch 12.3% Historical performance (Yearly) on absolute basis
Year Returns 2023 25.6% 2022 54.5% 2021 20.5% 2020 31.1% 2019 6.1% 2018 10.1% 2017 -16.9% 2016 24.3% 2015 17.9% 2014 2.5% Fund Manager information for Invesco India PSU Equity Fund
Name Since Tenure Dhimant Kothari 19 May 20 4.79 Yr. Data below for Invesco India PSU Equity Fund as on 31 Mar 25
Equity Sector Allocation
Sector Value Industrials 27.81% Utility 24.59% Financial Services 21.69% Energy 18.38% Basic Materials 6.48% Asset Allocation
Asset Class Value Cash 1.06% Equity 98.94% Top Securities Holdings / Portfolio
Name Holding Value Quantity Bharat Electronics Ltd (Industrials)
Equity, Since 31 Mar 17 | BEL9% ₹96 Cr 3,894,619 Power Grid Corp Of India Ltd (Utilities)
Equity, Since 28 Feb 22 | 5328989% ₹90 Cr 3,599,413 State Bank of India (Financial Services)
Equity, Since 28 Feb 21 | SBIN8% ₹86 Cr 1,251,543 Bharat Petroleum Corp Ltd (Energy)
Equity, Since 30 Sep 18 | 5005478% ₹82 Cr 3,445,961 Oil & Natural Gas Corp Ltd (Energy)
Equity, Since 31 Aug 24 | 5003126% ₹65 Cr 2,868,783 Hindustan Aeronautics Ltd Ordinary Shares (Industrials)
Equity, Since 31 May 22 | HAL5% ₹54 Cr 175,355
↑ 22,180 NTPC Green Energy Ltd (Utilities)
Equity, Since 30 Nov 24 | NTPCGREEN5% ₹52 Cr 5,911,723 NTPC Ltd (Utilities)
Equity, Since 31 May 19 | 5325555% ₹49 Cr 1,570,631 National Aluminium Co Ltd (Basic Materials)
Equity, Since 31 Aug 24 | 5322344% ₹46 Cr 2,604,332 Hindustan Petroleum Corp Ltd (Energy)
Equity, Since 30 Nov 23 | HINDPETRO4% ₹46 Cr 1,564,169 4. HDFC Infrastructure Fund
CAGR/Annualized return of since its launch. Ranked 26 in Sectoral category. Return for 2024 was 23% , 2023 was 55.4% and 2022 was 19.3% . HDFC Infrastructure Fund
Growth Launch Date 10 Mar 08 NAV (21 Apr 25) ₹45.192 ↑ 0.66 (1.49 %) Net Assets (Cr) ₹2,329 on 31 Mar 25 Category Equity - Sectoral AMC HDFC Asset Management Company Limited Rating ☆☆☆ Risk High Expense Ratio 2.31 Sharpe Ratio -0.01 Information Ratio 0 Alpha Ratio 0 Min Investment 5,000 Min SIP Investment 300 Exit Load 0-1 Years (1%),1 Years and above(NIL) Growth of 10,000 investment over the years.
Date Value 31 Mar 20 ₹10,000 31 Mar 21 ₹17,356 31 Mar 22 ₹21,727 31 Mar 23 ₹25,279 31 Mar 24 ₹45,346 31 Mar 25 ₹47,548 Returns for HDFC Infrastructure Fund
absolute basis & more than 1 year are on CAGR (Compound Annual Growth Rate) basis. as on 21 Apr 25 Duration Returns 1 Month 5% 3 Month 2.3% 6 Month -6.3% 1 Year 6.1% 3 Year 28.2% 5 Year 35.3% 10 Year 15 Year Since launch Historical performance (Yearly) on absolute basis
Year Returns 2023 23% 2022 55.4% 2021 19.3% 2020 43.2% 2019 -7.5% 2018 -3.4% 2017 -29% 2016 43.3% 2015 -1.9% 2014 -2.5% Fund Manager information for HDFC Infrastructure Fund
Name Since Tenure Srinivasan Ramamurthy 12 Jan 24 1.13 Yr. Dhruv Muchhal 22 Jun 23 1.69 Yr. Data below for HDFC Infrastructure Fund as on 31 Mar 25
Equity Sector Allocation
Sector Value Industrials 38.42% Financial Services 20.62% Basic Materials 10.93% Utility 7.4% Energy 6.96% Communication Services 3.76% Health Care 1.73% Technology 0.98% Real Estate 0.94% Consumer Cyclical 0.58% Asset Allocation
Asset Class Value Cash 6.48% Equity 92.31% Debt 1.21% Top Securities Holdings / Portfolio
Name Holding Value Quantity ICICI Bank Ltd (Financial Services)
Equity, Since 31 Oct 09 | ICICIBANK7% ₹157 Cr 1,300,000 HDFC Bank Ltd (Financial Services)
Equity, Since 31 Aug 23 | HDFCBANK6% ₹121 Cr 700,000 Larsen & Toubro Ltd (Industrials)
Equity, Since 30 Jun 12 | LT6% ₹120 Cr 380,000
↑ 30,000 J Kumar Infraprojects Ltd (Industrials)
Equity, Since 31 Oct 15 | JKIL5% ₹98 Cr 1,450,000
↓ -50,000 NTPC Ltd (Utilities)
Equity, Since 31 Dec 17 | 5325553% ₹69 Cr 2,200,000 InterGlobe Aviation Ltd (Industrials)
Equity, Since 31 Dec 21 | INDIGO3% ₹67 Cr 150,000 Kalpataru Projects International Ltd (Industrials)
Equity, Since 31 Jan 23 | KPIL3% ₹67 Cr 758,285 Coal India Ltd (Energy)
Equity, Since 31 Oct 18 | COALINDIA3% ₹63 Cr 1,700,000 Reliance Industries Ltd (Energy)
Equity, Since 31 May 24 | RELIANCE3% ₹60 Cr 500,000 Bharti Airtel Ltd (Communication Services)
Equity, Since 30 Sep 20 | BHARTIARTL3% ₹55 Cr 350,000
↓ -50,000 5. ICICI Prudential Infrastructure Fund
CAGR/Annualized return of 15.9% since its launch. Ranked 27 in Sectoral category. Return for 2024 was 27.4% , 2023 was 44.6% and 2022 was 28.8% . ICICI Prudential Infrastructure Fund
Growth Launch Date 31 Aug 05 NAV (21 Apr 25) ₹182.49 ↑ 2.65 (1.47 %) Net Assets (Cr) ₹7,214 on 31 Mar 25 Category Equity - Sectoral AMC ICICI Prudential Asset Management Company Limited Rating ☆☆☆ Risk High Expense Ratio 2.22 Sharpe Ratio 0.14 Information Ratio 0 Alpha Ratio 0 Min Investment 5,000 Min SIP Investment 100 Exit Load 0-1 Years (1%),1 Years and above(NIL) Growth of 10,000 investment over the years.
Date Value 31 Mar 20 ₹10,000 31 Mar 21 ₹18,670 31 Mar 22 ₹25,304 31 Mar 23 ₹30,899 31 Mar 24 ₹50,465 31 Mar 25 ₹54,540 Returns for ICICI Prudential Infrastructure Fund
absolute basis & more than 1 year are on CAGR (Compound Annual Growth Rate) basis. as on 21 Apr 25 Duration Returns 1 Month 3% 3 Month 2.4% 6 Month -6.3% 1 Year 8.3% 3 Year 27.8% 5 Year 38.9% 10 Year 15 Year Since launch 15.9% Historical performance (Yearly) on absolute basis
Year Returns 2023 27.4% 2022 44.6% 2021 28.8% 2020 50.1% 2019 3.6% 2018 2.6% 2017 -14% 2016 40.8% 2015 2% 2014 -3.4% Fund Manager information for ICICI Prudential Infrastructure Fund
Name Since Tenure Ihab Dalwai 3 Jun 17 7.75 Yr. Sharmila D’mello 30 Jun 22 2.67 Yr. Data below for ICICI Prudential Infrastructure Fund as on 31 Mar 25
Equity Sector Allocation
Sector Value Industrials 36.49% Basic Materials 21.39% Financial Services 16.91% Utility 8.65% Energy 7.09% Communication Services 1.63% Consumer Cyclical 0.89% Real Estate 0.35% Asset Allocation
Asset Class Value Cash 5.98% Equity 93.39% Debt 0.62% Top Securities Holdings / Portfolio
Name Holding Value Quantity Larsen & Toubro Ltd (Industrials)
Equity, Since 30 Nov 09 | LT9% ₹649 Cr 2,052,790
↑ 126,940 Adani Ports & Special Economic Zone Ltd (Industrials)
Equity, Since 31 May 24 | ADANIPORTS4% ₹288 Cr 2,695,324 Shree Cement Ltd (Basic Materials)
Equity, Since 30 Apr 24 | 5003874% ₹268 Cr 98,408
↓ -10,339 ICICI Bank Ltd (Financial Services)
Equity, Since 31 Dec 16 | ICICIBANK3% ₹240 Cr 1,990,000 NTPC Ltd (Utilities)
Equity, Since 29 Feb 16 | 5325553% ₹226 Cr 7,260,775 HDFC Bank Ltd (Financial Services)
Equity, Since 31 Jan 22 | HDFCBANK3% ₹212 Cr 1,225,000 NCC Ltd (Industrials)
Equity, Since 31 Aug 21 | NCC3% ₹210 Cr 12,006,117
↑ 1,500,000 Reliance Industries Ltd (Energy)
Equity, Since 31 Jul 23 | RELIANCE3% ₹205 Cr 1,709,486
↑ 100,000 Vedanta Ltd (Basic Materials)
Equity, Since 31 Jul 24 | 5002953% ₹194 Cr 4,923,662
↑ 100,000 Cummins India Ltd (Industrials)
Equity, Since 31 May 17 | 5004803% ₹173 Cr 635,000
تو ، کیا آپ ایک زبردست سرمایہ کار بننا اور پیسہ کمانا چاہتے ہیں؟ Fincash.com کے ساتھ رجسٹر اور سرمایہ کاری کریں اور اپنے مستقبل کے لئے دولت بنائیں۔
یہاں فراہم کردہ معلومات کو درست بنانے کے لئے تمام کوششیں کی گئیں ہیں۔ تاہم ، اعداد و شمار کی درستگی کے بارے میں کوئی ضمانت نہیں دی گئی ہے۔ براہ کرم کوئی سرمایہ کاری کرنے سے پہلے اسکیم سے متعلق معلومات کے دستاویز کی تصدیق کریں۔


")
AMFI Registration No. 112358 | CIN: U74999MH2016PTC282153
Shepard Technologies Pvt. Ltd. (with ARN code 112358) makes no warranties or representations, express or implied, on products offered through the platform. It accepts no liability for any damages or losses, however caused, in connection with the use of, or on the reliance of its product or related services. Terms and conditions of the website are applicable.
©2025 Shepard Technologies Private Limited. All Rights Reserved