 +91-22-48913909
Table of Contents
- Background of International Mutual Funds in India
- How to Pick an International Mutual Fund?
- Best International Mutual Funds to Invest in FY 25 - 26
- Types of International Mutual Funds
- Why to Invest in International Mutual Funds?
- Taxation of International Mutual Funds
- How to Invest in International Mutual Fund Online?
- FAQs
- 1. What are the benefits of investing in international mutual funds?
- 2. Can I invest in companies that post lower growth than India?
- 3. What is the Franklin India Feeder?
- 4. What is the BlackRock World Mining Fund?
- 5. Are earnings from international mutual funds taxed?
- 6. What is the main risk of the international mutual fund?
- 7. Who should invest in a foreign mutual fund?
Top 8 Equity - Global Funds
- DSP BlackRock World Gold Fund
- Principal Global Opportunities Fund
- Invesco India Feeder- Invesco Global Equity Income Fund
- Edelweiss Europe Dynamic Equity Off-shore Fund
- Aditya Birla Sun Life International Equity Fund - Plan B
- Aditya Birla Sun Life International Equity Fund - Plan A
- Franklin India Feeder - Franklin European Growth Fund
- Edelweiss ASEAN Equity Off-shore Fund
8 Best International Mutual Funds 2025
International Mutual Funds are funds that invest in foreign markets except for the investor’s country of residence. On the other hand, global fund invest in foreign markets as well as the investor’s country of residence. International Mutual Funds are also known as “foreign fund” and are a form of the ‘fund of funds’ strategy.
International Mutual Funds have become an attractive investment option for investors in the past few years due to the volatile local markets and an Economy going through its ups and downs.
Background of International Mutual Funds in India
With the permission of Reserve Bank of India (RBI), International Mutual Funds opened up in India in 2007. Each fund is allowed to get a corpus of USD 500 million.
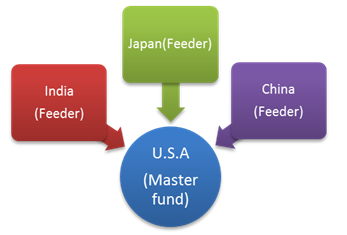
Master-Feeder Structure of International Mutual Funds
International Mutual Funds follow a master-feeder structure. A master-feeder structure is a three-tier structure where investors place their money in the feeder fund which then invests in the master fund. The master fund then invests the money in the Market. A feeder fund is based on-shore i.e. in India, whereas, the master fund is based off-shore (in a foreign geography like Luxembourg etc).
A master fund can have multiple feeder funds. For example,
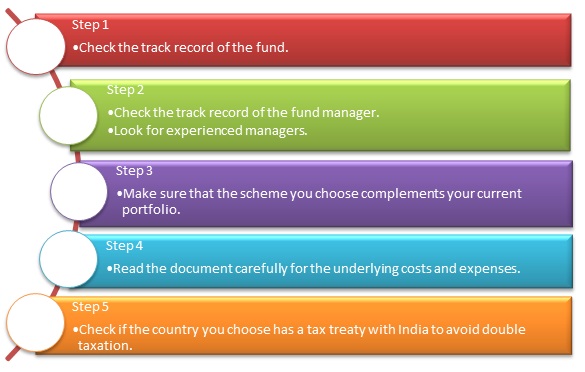
How to Pick an International Mutual Fund?
There are certain things to be kept in mind while choosing a suitable fund.
Best International Mutual Funds to Invest in FY 25 - 26
"The primary investment objective of the Scheme is to seek capital appreciation by investing predominantly in units of MLIIF - WGF. The Scheme may, at the discretion of the Investment Manager, also invest in the units of other similar overseas mutual fund schemes, which may constitute a significant part of its corpus. The Scheme may also invest a certain portion of its corpus in money market securities and/or units of money market/liquid schemes of DSP Merrill Lynch Mutual Fund, in order to meet liquidity requirements from time to time. However, there is no assurance that the investment objective of the Scheme will be realized." DSP BlackRock World Gold Fund is a Equity - Global fund was launched on 14 Sep 07. It is a fund with High risk and has given a Below is the key information for DSP BlackRock World Gold Fund Returns up to 1 year are on The investment objective of the Scheme is to provide long term capital appreciation by predominantly investing in overseas mutual fund schemes, and a certain portion of its corpus in Money Market Securities and/or units of Money Market / Liquid Schemes of Principal Mutual Fund. Principal Global Opportunities Fund is a Equity - Global fund was launched on 29 Mar 04. It is a fund with High risk and has given a Below is the key information for Principal Global Opportunities Fund Returns up to 1 year are on (Erstwhile Invesco India Global Equity Income Fund) To provide capital appreciation and/or income by investing predominantly
in units of Invesco Global Equity Income Fund, an overseas equity fund which invests primarily in equities of companies worldwide. The Scheme may, at the discretion of Fund Manager, also invest in units of other similar Overseas Mutual Funds with similar objectives, strategy and attributes which may constitute a significant portion of its net assets. Invesco India Feeder- Invesco Global Equity Income Fund is a Equity - Global fund was launched on 5 May 14. It is a fund with High risk and has given a Below is the key information for Invesco India Feeder- Invesco Global Equity Income Fund Returns up to 1 year are on The primary investment objective of the Scheme is to seek to provide long term capital growth by investing predominantly in the JPMorgan Funds - Europe Dynamic Fund, an equity fund which invests primarily in an aggressively managed portfolio of European companies. Edelweiss Europe Dynamic Equity Off-shore Fund is a Equity - Global fund was launched on 7 Feb 14. It is a fund with High risk and has given a Below is the key information for Edelweiss Europe Dynamic Equity Off-shore Fund Returns up to 1 year are on An Open-ended diversified equity scheme with an objective to generate long-term growth of capital, by investing predominantly in a diversified portfolio of equity and equity related securities in the domestic and international markets. Aditya Birla Sun Life International Equity Fund - Plan B is a Equity - Global fund was launched on 31 Oct 07. It is a fund with High risk and has given a Below is the key information for Aditya Birla Sun Life International Equity Fund - Plan B Returns up to 1 year are on An Open-ended diversified equity scheme with an objective to generate long-term growth of capital, by investing predominantly in a diversified portfolio of equity and equity related securities in the international markets Aditya Birla Sun Life International Equity Fund - Plan A is a Equity - Global fund was launched on 31 Oct 07. It is a fund with High risk and has given a Below is the key information for Aditya Birla Sun Life International Equity Fund - Plan A Returns up to 1 year are on The fund seeks to provide regular income through a portfolio of debt and money market instruments consisting predominantly of securities issued by entities such as Banks and Public Sector Undertakings (PSUs). However, there is no assurance or guarantee that the objective of the scheme will be achieved. Franklin India Feeder - Franklin European Growth Fund is a Equity - Global fund was launched on 16 May 14. It is a fund with High risk and has given a Below is the key information for Franklin India Feeder - Franklin European Growth Fund Returns up to 1 year are on The primary investment objective of the Scheme is to provide long term capital growth by investing predominantly in JPMorgan Funds – JF ASEAN Equity Fund, an equity fund which invests primarily in companies of countries which are members of the Association of South East Asian Nations (ASEAN). However, there can be no assurance that the investment objective of the Scheme will be realized. Edelweiss ASEAN Equity Off-shore Fund is a Equity - Global fund was launched on 1 Jul 11. It is a fund with High risk and has given a Below is the key information for Edelweiss ASEAN Equity Off-shore Fund Returns up to 1 year are on Fund NAV Net Assets (Cr) Min SIP Investment 3 MO (%) 6 MO (%) 1 YR (%) 3 YR (%) 5 YR (%) 2023 (%) DSP BlackRock World Gold Fund Growth ₹25.2945
↑ 0.78 ₹1,089 500 19.2 12.2 51.3 9.7 16.4 15.9 Principal Global Opportunities Fund Growth ₹47.4362
↓ -0.04 ₹38 2,000 2.9 3.1 25.8 24.8 16.5 Invesco India Feeder- Invesco Global Equity Income Fund Growth ₹27.1605
↓ -0.22 ₹29 500 2.1 5.1 15.4 17.6 20.1 13.7 Edelweiss Europe Dynamic Equity Off-shore Fund Growth ₹21.3642
↓ -0.12 ₹78 1,000 12.8 8 14.6 15.9 18.8 5.4 Aditya Birla Sun Life International Equity Fund - Plan B Growth ₹28.8036
↑ 0.07 ₹93 1,000 10.3 10 13.8 18.9 9 Aditya Birla Sun Life International Equity Fund - Plan A Growth ₹37.4613
↓ -0.26 ₹192 1,000 5.7 6 12.7 9.4 14.9 7.4 Franklin India Feeder - Franklin European Growth Fund Growth ₹10.8579
↓ -0.17 ₹15 6.4 0.2 11.9 6.9 8.2 -0.6 Edelweiss ASEAN Equity Off-shore Fund Growth ₹27.44
↓ -0.04 ₹97 1,000 -3.2 -2.2 11.2 5.2 9.9 14.5 Note: Returns up to 1 year are on absolute basis & more than 1 year are on CAGR basis. as on 13 Mar 25 10 crore of more and sorted on last one year return.
1. DSP BlackRock World Gold Fund
CAGR/Annualized return of 5.4% since its launch. Ranked 11 in Global category. Return for 2024 was 15.9% , 2023 was 7% and 2022 was -7.7% . DSP BlackRock World Gold Fund
Growth Launch Date 14 Sep 07 NAV (13 Mar 25) ₹25.2945 ↑ 0.78 (3.20 %) Net Assets (Cr) ₹1,089 on 31 Jan 25 Category Equity - Global AMC DSP BlackRock Invmt Managers Pvt. Ltd. Rating ☆☆☆ Risk High Expense Ratio 1.35 Sharpe Ratio 1.22 Information Ratio -0.38 Alpha Ratio 1.81 Min Investment 1,000 Min SIP Investment 500 Exit Load 0-12 Months (1%),12 Months and above(NIL) Growth of 10,000 investment over the years.
Date Value 29 Feb 20 ₹10,000 28 Feb 21 ₹12,203 28 Feb 22 ₹13,232 28 Feb 23 ₹11,277 29 Feb 24 ₹10,712 28 Feb 25 ₹16,975 Returns for DSP BlackRock World Gold Fund
absolute basis & more than 1 year are on CAGR (Compound Annual Growth Rate) basis. as on 13 Mar 25 Duration Returns 1 Month 2.2% 3 Month 19.2% 6 Month 12.2% 1 Year 51.3% 3 Year 9.7% 5 Year 16.4% 10 Year 15 Year Since launch 5.4% Historical performance (Yearly) on absolute basis
Year Returns 2023 15.9% 2022 7% 2021 -7.7% 2020 -9% 2019 31.4% 2018 35.1% 2017 -10.7% 2016 -4% 2015 52.7% 2014 -18.5% Fund Manager information for DSP BlackRock World Gold Fund
Name Since Tenure Jay Kothari 1 Mar 13 12.01 Yr. Data below for DSP BlackRock World Gold Fund as on 31 Jan 25
Equity Sector Allocation
Sector Value Basic Materials 93.3% Asset Allocation
Asset Class Value Cash 2.64% Equity 93.34% Debt 0.03% Other 4% Top Securities Holdings / Portfolio
Name Holding Value Quantity BGF World Gold I2
Investment Fund | -81% ₹879 Cr 1,953,700
↓ -46,242 VanEck Gold Miners ETF
- | GDX18% ₹194 Cr 573,719 Treps / Reverse Repo Investments
CBLO/Reverse Repo | -1% ₹11 Cr Net Receivables/Payables
Net Current Assets | -0% ₹5 Cr 2. Principal Global Opportunities Fund
CAGR/Annualized return of 9.2% since its launch. Ranked 8 in Global category. . Principal Global Opportunities Fund
Growth Launch Date 29 Mar 04 NAV (31 Dec 21) ₹47.4362 ↓ -0.04 (-0.09 %) Net Assets (Cr) ₹38 on 30 Nov 21 Category Equity - Global AMC Principal Pnb Asset Mgmt. Co. Priv. Ltd. Rating ☆☆☆☆ Risk High Expense Ratio 2.1 Sharpe Ratio 2.31 Information Ratio 0 Alpha Ratio 0 Min Investment 10,000 Min SIP Investment 2,000 Exit Load 0-1 Years (1%),1 Years and above(NIL) Growth of 10,000 investment over the years.
Date Value 29 Feb 20 ₹10,000 28 Feb 21 ₹13,917 Returns for Principal Global Opportunities Fund
absolute basis & more than 1 year are on CAGR (Compound Annual Growth Rate) basis. as on 13 Mar 25 Duration Returns 1 Month 0% 3 Month 2.9% 6 Month 3.1% 1 Year 25.8% 3 Year 24.8% 5 Year 16.5% 10 Year 15 Year Since launch 9.2% Historical performance (Yearly) on absolute basis
Year Returns 2023 2022 2021 2020 2019 2018 2017 2016 2015 2014 Fund Manager information for Principal Global Opportunities Fund
Name Since Tenure Data below for Principal Global Opportunities Fund as on 30 Nov 21
Equity Sector Allocation
Sector Value Asset Allocation
Asset Class Value Top Securities Holdings / Portfolio
Name Holding Value Quantity 3. Invesco India Feeder- Invesco Global Equity Income Fund
CAGR/Annualized return of 9.6% since its launch. Ranked 12 in Global category. Return for 2024 was 13.7% , 2023 was 27% and 2022 was -2.1% . Invesco India Feeder- Invesco Global Equity Income Fund
Growth Launch Date 5 May 14 NAV (13 Mar 25) ₹27.1605 ↓ -0.22 (-0.81 %) Net Assets (Cr) ₹29 on 31 Jan 25 Category Equity - Global AMC Invesco Asset Management (India) Private Ltd Rating ☆☆☆ Risk High Expense Ratio 1.4 Sharpe Ratio 1.77 Information Ratio 0 Alpha Ratio 0 Min Investment 5,000 Min SIP Investment 500 Exit Load 0-1 Years (1%),1 Years and above(NIL) Growth of 10,000 investment over the years.
Date Value 29 Feb 20 ₹10,000 28 Feb 21 ₹12,577 28 Feb 22 ₹13,676 28 Feb 23 ₹15,367 29 Feb 24 ₹18,388 28 Feb 25 ₹22,279 Returns for Invesco India Feeder- Invesco Global Equity Income Fund
absolute basis & more than 1 year are on CAGR (Compound Annual Growth Rate) basis. as on 13 Mar 25 Duration Returns 1 Month -2% 3 Month 2.1% 6 Month 5.1% 1 Year 15.4% 3 Year 17.6% 5 Year 20.1% 10 Year 15 Year Since launch 9.6% Historical performance (Yearly) on absolute basis
Year Returns 2023 13.7% 2022 27% 2021 -2.1% 2020 21% 2019 7.3% 2018 24.7% 2017 -7.5% 2016 13.2% 2015 2.6% 2014 4% Fund Manager information for Invesco India Feeder- Invesco Global Equity Income Fund
Name Since Tenure Herin Shah 1 Aug 24 0.58 Yr. Data below for Invesco India Feeder- Invesco Global Equity Income Fund as on 31 Jan 25
Equity Sector Allocation
Sector Value Financial Services 18.35% Technology 16.87% Industrials 16.75% Health Care 11.16% Consumer Cyclical 8.43% Consumer Defensive 7.8% Real Estate 4.22% Basic Materials 2.9% Communication Services 2.36% Energy 1.7% Asset Allocation
Asset Class Value Cash 4.17% Equity 90.54% Other 5.29% Top Securities Holdings / Portfolio
Name Holding Value Quantity Invesco Global Equity Income C USD Acc
Investment Fund | -96% ₹28 Cr 21,026 Triparty Repo
CBLO/Reverse Repo | -5% ₹2 Cr Net Receivables / (Payables)
Net Current Assets | -1% ₹0 Cr 4. Edelweiss Europe Dynamic Equity Off-shore Fund
CAGR/Annualized return of 7.1% since its launch. Ranked 22 in Global category. Return for 2024 was 5.4% , 2023 was 17.3% and 2022 was -6% . Edelweiss Europe Dynamic Equity Off-shore Fund
Growth Launch Date 7 Feb 14 NAV (13 Mar 25) ₹21.3642 ↓ -0.12 (-0.58 %) Net Assets (Cr) ₹78 on 31 Jan 25 Category Equity - Global AMC Edelweiss Asset Management Limited Rating ☆☆☆ Risk High Expense Ratio 1.38 Sharpe Ratio 0.54 Information Ratio 0 Alpha Ratio 0 Min Investment 5,000 Min SIP Investment 1,000 Exit Load 0-12 Months (1%),12 Months and above(NIL) Growth of 10,000 investment over the years.
Date Value 29 Feb 20 ₹10,000 28 Feb 21 ₹12,916 28 Feb 22 ₹13,376 28 Feb 23 ₹15,018 29 Feb 24 ₹16,707 28 Feb 25 ₹19,543 Returns for Edelweiss Europe Dynamic Equity Off-shore Fund
absolute basis & more than 1 year are on CAGR (Compound Annual Growth Rate) basis. as on 13 Mar 25 Duration Returns 1 Month 3.5% 3 Month 12.8% 6 Month 8% 1 Year 14.6% 3 Year 15.9% 5 Year 18.8% 10 Year 15 Year Since launch 7.1% Historical performance (Yearly) on absolute basis
Year Returns 2023 5.4% 2022 17.3% 2021 -6% 2020 17% 2019 13.5% 2018 22.9% 2017 -12.2% 2016 12.5% 2015 -3.9% 2014 5.4% Fund Manager information for Edelweiss Europe Dynamic Equity Off-shore Fund
Name Since Tenure Bhavesh Jain 9 Apr 18 6.9 Yr. Bharat Lahoti 1 Oct 21 3.42 Yr. Data below for Edelweiss Europe Dynamic Equity Off-shore Fund as on 31 Jan 25
Equity Sector Allocation
Sector Value Financial Services 22.18% Industrials 16.05% Consumer Cyclical 9.51% Health Care 9.3% Consumer Defensive 8.61% Communication Services 7.74% Energy 6.82% Technology 5.44% Basic Materials 5.03% Utility 3% Real Estate 2.51% Asset Allocation
Asset Class Value Cash 2.19% Equity 96.19% Debt 0.02% Other 1.61% Top Securities Holdings / Portfolio
Name Holding Value Quantity JPM Europe Dynamic I (acc) EUR
Investment Fund | -100% ₹78 Cr 174,857 Clearing Corporation Of India Ltd.
CBLO/Reverse Repo | -1% ₹0 Cr Net Receivables/(Payables)
CBLO | -0% ₹0 Cr Accrued Interest
CBLO | -0% ₹0 Cr 5. Aditya Birla Sun Life International Equity Fund - Plan B
CAGR/Annualized return of 7% since its launch. Ranked 39 in Global category. . Aditya Birla Sun Life International Equity Fund - Plan B
Growth Launch Date 31 Oct 07 NAV (28 Jul 23) ₹28.8036 ↑ 0.07 (0.23 %) Net Assets (Cr) ₹93 on 30 Jun 23 Category Equity - Global AMC Birla Sun Life Asset Management Co Ltd Rating ☆ Risk High Expense Ratio 2.6 Sharpe Ratio 0.85 Information Ratio 0 Alpha Ratio 0 Min Investment 1,000 Min SIP Investment 1,000 Exit Load 0-365 Days (1%),365 Days and above(NIL) Growth of 10,000 investment over the years.
Date Value 29 Feb 20 ₹10,000 28 Feb 21 ₹12,976 28 Feb 22 ₹14,432 28 Feb 23 ₹14,252 Returns for Aditya Birla Sun Life International Equity Fund - Plan B
absolute basis & more than 1 year are on CAGR (Compound Annual Growth Rate) basis. as on 13 Mar 25 Duration Returns 1 Month 4.2% 3 Month 10.3% 6 Month 10% 1 Year 13.8% 3 Year 18.9% 5 Year 9% 10 Year 15 Year Since launch 7% Historical performance (Yearly) on absolute basis
Year Returns 2023 2022 2021 2020 2019 2018 2017 2016 2015 2014 Fund Manager information for Aditya Birla Sun Life International Equity Fund - Plan B
Name Since Tenure Data below for Aditya Birla Sun Life International Equity Fund - Plan B as on 30 Jun 23
Equity Sector Allocation
Sector Value Asset Allocation
Asset Class Value Top Securities Holdings / Portfolio
Name Holding Value Quantity 6. Aditya Birla Sun Life International Equity Fund - Plan A
CAGR/Annualized return of 7.9% since its launch. Ranked 36 in Global category. Return for 2024 was 7.4% , 2023 was 8.6% and 2022 was -2.1% . Aditya Birla Sun Life International Equity Fund - Plan A
Growth Launch Date 31 Oct 07 NAV (13 Mar 25) ₹37.4613 ↓ -0.26 (-0.70 %) Net Assets (Cr) ₹192 on 31 Jan 25 Category Equity - Global AMC Birla Sun Life Asset Management Co Ltd Rating ☆☆ Risk High Expense Ratio 2.5 Sharpe Ratio 0.8 Information Ratio -1.16 Alpha Ratio -10.22 Min Investment 1,000 Min SIP Investment 1,000 Exit Load 0-365 Days (1%),365 Days and above(NIL) Growth of 10,000 investment over the years.
Date Value 29 Feb 20 ₹10,000 28 Feb 21 ₹12,430 28 Feb 22 ₹13,358 28 Feb 23 ₹13,645 29 Feb 24 ₹14,573 28 Feb 25 ₹17,099 Returns for Aditya Birla Sun Life International Equity Fund - Plan A
absolute basis & more than 1 year are on CAGR (Compound Annual Growth Rate) basis. as on 13 Mar 25 Duration Returns 1 Month -0.2% 3 Month 5.7% 6 Month 6% 1 Year 12.7% 3 Year 9.4% 5 Year 14.9% 10 Year 15 Year Since launch 7.9% Historical performance (Yearly) on absolute basis
Year Returns 2023 7.4% 2022 8.6% 2021 -2.1% 2020 13.5% 2019 13.2% 2018 24.7% 2017 4.1% 2016 13.5% 2015 -2.1% 2014 0% Fund Manager information for Aditya Birla Sun Life International Equity Fund - Plan A
Name Since Tenure Dhaval Joshi 21 Nov 22 2.28 Yr. Data below for Aditya Birla Sun Life International Equity Fund - Plan A as on 31 Jan 25
Equity Sector Allocation
Sector Value Industrials 28.42% Financial Services 16.71% Technology 13.33% Health Care 11.28% Consumer Defensive 11.08% Consumer Cyclical 7.13% Communication Services 6.68% Basic Materials 4.66% Asset Allocation
Asset Class Value Cash 0.72% Equity 99.28% Top Securities Holdings / Portfolio
Name Holding Value Quantity Allegro.EU SA Ordinary Shares (Consumer Cyclical)
Equity, Since 31 Aug 24 | ALE3% ₹5 Cr 80,700 Rheinmetall AG (Industrials)
Equity, Since 31 Aug 24 | RHM2% ₹5 Cr 700 Compagnie Financiere Richemont SA Class A (Consumer Cyclical)
Equity, Since 29 Feb 24 | CFR2% ₹5 Cr 2,700 British American Tobacco PLC (Consumer Defensive)
Equity, Since 31 Jul 24 | BATS2% ₹4 Cr 12,900 Imperial Brands PLC (Consumer Defensive)
Equity, Since 31 Oct 21 | IMB2% ₹4 Cr 14,600 Taiwan Semiconductor Manufacturing Co Ltd ADR (Technology)
Equity, Since 31 Dec 21 | TSM2% ₹4 Cr 2,300 Brambles Ltd (Industrials)
Equity, Since 31 Aug 24 | BXB2% ₹4 Cr 38,800 Corteva Inc (Basic Materials)
Equity, Since 31 Aug 24 | CTVA2% ₹4 Cr 7,300 TransUnion (Financial Services)
Equity, Since 29 Feb 24 | TRU2% ₹4 Cr 4,800 Singapore Exchange Ltd (Financial Services)
Equity, Since 31 Jul 23 | S682% ₹4 Cr 51,000 7. Franklin India Feeder - Franklin European Growth Fund
CAGR/Annualized return of 0.8% since its launch. Ranked 21 in Global category. Return for 2024 was -0.6% , 2023 was 11.6% and 2022 was -5% . Franklin India Feeder - Franklin European Growth Fund
Growth Launch Date 16 May 14 NAV (13 Mar 25) ₹10.8579 ↓ -0.17 (-1.55 %) Net Assets (Cr) ₹15 on 31 Jan 25 Category Equity - Global AMC Franklin Templeton Asst Mgmt(IND)Pvt Ltd Rating ☆☆☆ Risk High Expense Ratio 1.38 Sharpe Ratio 0.02 Information Ratio -0.88 Alpha Ratio -5.95 Min Investment 5,000 Min SIP Investment Exit Load 0-3 Years (1%),3 Years and above(NIL) Growth of 10,000 investment over the years.
Date Value 29 Feb 20 ₹10,000 28 Feb 21 ₹10,618 28 Feb 22 ₹10,683 28 Feb 23 ₹10,912 29 Feb 24 ₹11,066 28 Feb 25 ₹12,525 Returns for Franklin India Feeder - Franklin European Growth Fund
absolute basis & more than 1 year are on CAGR (Compound Annual Growth Rate) basis. as on 13 Mar 25 Duration Returns 1 Month 4.2% 3 Month 6.4% 6 Month 0.2% 1 Year 11.9% 3 Year 6.9% 5 Year 8.2% 10 Year 15 Year Since launch 0.8% Historical performance (Yearly) on absolute basis
Year Returns 2023 -0.6% 2022 11.6% 2021 -5% 2020 4.2% 2019 -9.1% 2018 15.6% 2017 -13.8% 2016 12.8% 2015 2.5% 2014 -0.5% Fund Manager information for Franklin India Feeder - Franklin European Growth Fund
Name Since Tenure Sandeep Manam 18 Oct 21 3.29 Yr. Data below for Franklin India Feeder - Franklin European Growth Fund as on 31 Jan 25
Equity Sector Allocation
Sector Value Consumer Cyclical 24.11% Industrials 21.03% Technology 15.31% Communication Services 8.15% Real Estate 7.17% Health Care 4.81% Financial Services 4.36% Consumer Defensive 3.26% Energy 2.06% Utility 1.92% Asset Allocation
Asset Class Value Cash 6.35% Equity 92.18% Top Securities Holdings / Portfolio
Name Holding Value Quantity Templeton European Opps I(acc)EUR
Investment Fund | -98% ₹15 Cr 51,358
↓ -2,586 Call, Cash & Other Assets
CBLO | -2% ₹0 Cr 8. Edelweiss ASEAN Equity Off-shore Fund
CAGR/Annualized return of 7.6% since its launch. Ranked 18 in Global category. Return for 2024 was 14.5% , 2023 was -1.4% and 2022 was 4.8% . Edelweiss ASEAN Equity Off-shore Fund
Growth Launch Date 1 Jul 11 NAV (13 Mar 25) ₹27.44 ↓ -0.04 (-0.15 %) Net Assets (Cr) ₹97 on 31 Jan 25 Category Equity - Global AMC Edelweiss Asset Management Limited Rating ☆☆☆ Risk High Expense Ratio 1.42 Sharpe Ratio 1.07 Information Ratio 0 Alpha Ratio 0 Min Investment 5,000 Min SIP Investment 1,000 Exit Load 0-12 Months (1%),12 Months and above(NIL) Growth of 10,000 investment over the years.
Date Value 29 Feb 20 ₹10,000 28 Feb 21 ₹11,855 28 Feb 22 ₹12,847 28 Feb 23 ₹12,906 29 Feb 24 ₹12,781 28 Feb 25 ₹14,538 Returns for Edelweiss ASEAN Equity Off-shore Fund
absolute basis & more than 1 year are on CAGR (Compound Annual Growth Rate) basis. as on 13 Mar 25 Duration Returns 1 Month -2.4% 3 Month -3.2% 6 Month -2.2% 1 Year 11.2% 3 Year 5.2% 5 Year 9.9% 10 Year 15 Year Since launch 7.6% Historical performance (Yearly) on absolute basis
Year Returns 2023 14.5% 2022 -1.4% 2021 4.8% 2020 6.3% 2019 2.3% 2018 12% 2017 -2.1% 2016 21.9% 2015 9.6% 2014 -11.1% Fund Manager information for Edelweiss ASEAN Equity Off-shore Fund
Name Since Tenure Bhavesh Jain 27 Sep 19 5.43 Yr. Bharat Lahoti 1 Oct 21 3.41 Yr. Data below for Edelweiss ASEAN Equity Off-shore Fund as on 31 Jan 25
Equity Sector Allocation
Sector Value Financial Services 46.42% Industrials 10.13% Consumer Cyclical 9.44% Communication Services 9.17% Real Estate 6.25% Consumer Defensive 3.89% Utility 3.7% Technology 3.18% Health Care 2.43% Basic Materials 1.96% Energy 1.82% Asset Allocation
Asset Class Value Cash 1.61% Equity 98.39% Top Securities Holdings / Portfolio
Name Holding Value Quantity JPM ASEAN Equity I (acc) USD
Investment Fund | -100% ₹97 Cr 58,774 Net Receivables/(Payables)
CBLO | -0% ₹0 Cr Clearing Corporation Of India Ltd.
CBLO/Reverse Repo | -0% ₹0 Cr Accrued Interest
CBLO | -0% ₹0 Cr
Types of International Mutual Funds
1. Emerging Market Funds
This type of mutual fund invests in emerging markets like India, China, Russia, Brazil etc. China has surpassed the USA to be the world’s largest car manufacturer. Russia is a big player in natural gas. India has a fast-growing service economy base. These countries are expected to grow tremendously in the coming years making them a hot choice for investors.
Some of the best international mutual fund schemes that invest in emerging markets are Birla Sun Life International Equity Plan A, Kotak Global Emerging Market Fund and Principal Global Opportunities Fund.
Talk to our investment specialist
2. Developed Market Funds
Developed market funds are an attractive option because it is generally seen that mature markets are more stable. Also, they do not have the problems associated with emerging markets like an economy or currency risk in the economy, political instability, etc. making them less risky. Some schemes that invest in developed markets are DWS Global Thematic Offshore Fund etc.
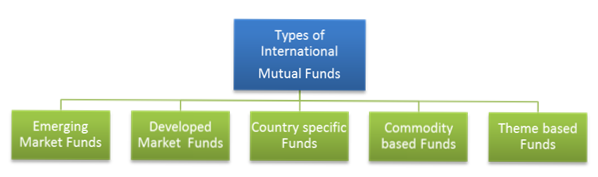
3. Country Specific Funds
As the name suggests, this type invests only in a specific country or part of the globe. But, country-specific funds defeat the entire purpose of diversifying the Portfolio since it lays all eggs in one basket. However, when there are opportunities in specific countries due to various reasons, these funds become a good choice.
Reliance Japan Equity Fund, Kotak US Equities Fund and Mirae Asset China Advantage Fund are some country-specific schemes.
4. Commodity Based Funds
These funds invest in commodities like gold, precious metals, crude oil, wheat, etc. Commodities offer diversification and also act as an Inflation hedge, thus protecting the investors. Also, these funds could be multi-commodity or focused on a single commodity.
Best commodity based international mutual funds are DSP Black Rock World Gold Fund, ING OptiMix Global Commodities, Mirae Asset Global Commodity Stocks, Birla Sun Life Commodity Equities - Global Agri Fund, etc.
5. Theme Based Funds
Theme based funds or thematic funds invest in a particular theme. For example, if the theme is infrastructure, it would invest in infrastructure construction companies as well as companies related to the infrastructure business like cement, steel, etc.
They are often confused with sectoral funds which focus only on a specific Industry. For example, pharmaceutical sectoral funds would only invest in pharma companies. Compared to sector funds, thematic funds are a broader concept. This offers more diversification and less risk since the investment is spread across various industries.
Some theme based funds are DSPBR World Energy Fund, L&T Global Real Assets Fund etc.
Why to Invest in International Mutual Funds?
1. Diversification
The main motive of Investing in International Mutual Funds is diversification. Diversification helps in optimising the returns and reducing the overall risks of a portfolio. Low or negative correlations between investments make sure that the returns are not dependent on only one sector or economy. Thus, balancing the portfolio and protecting the investor.
2. Ease in Investing
You can give a global edge to your portfolio by making a direct investment in foreign markets through equities, commodities, Real Estate, and exchange-traded funds (ETFs) as well. Buying units of an international mutual fund are much easier and they also provide the expertise of the fund manager which is not available in the other investing avenues.
3. International Exposure
International mutual funds help in expanding the investor horizons beyond the domestic boundaries. Also, investing internationally helps set-off any losses that the investor may have incurred in the domestic market.
4. Currency Fluctuations
International Mutual Fund schemes determine the NAV (Net Asset Value) of the fund by using the prevailing exchange rate. The exchange rates fluctuate every day, or more so, every minute.
This means that for a scheme investing in US Dollars, the NAV of the scheme would be impacted as per the dollar-rupee movement. It is observed that the more the rupee depreciates, the higher are the gains. This makes international mutual funds even more attractive since the rupee is going downhill now.
5. Country Specific Exposures
If the investor wants to take complete advantage of another country’s growth, international mutual funds are the way to go. But the Flip side of this would be that the portfolio is dependent solely on one economy. Hence, increasing the risk Factor.
Taxation of International Mutual Funds
Tax treatment of international mutual funds in India is similar to that of Debt fund. If the investor holds the investments short term i.e. less than 36 months, they will be included in his total Income and will be taxed as per the applicable slab rate.
If the investments are held for more than 36 months, the investor is then eligible for indexation benefits. Any gains arising from the schemes will be taxed @ 10% without indexation or 20% with indexation.
How to Invest in International Mutual Fund Online?
Open Free Investment Account for Lifetime at Fincash.com.
Complete your Registration and KYC Process
Upload Documents (PAN, Aadhaar, etc.). And, You are Ready to Invest!
According to experts, an investor should have around 10-12% of the portfolio invested in international mutual funds. So with the basics covered now, start building up that portfolio with international mutual funds today.
FAQs
1. What are the benefits of investing in international mutual funds?
A: It diversifies your portfolio of investment, which tends to give you better & diversified returns. It also keeps your portfolio balanced. As these companies have foreign funds, you can expect your investment to produce good returns.
2. Can I invest in companies that post lower growth than India?
A: Yes, you can, but it will depend on the financial institution you are investing in. You cannot directly invest in the securities of a foreign company. You will need a broker or a financial institute to help you invest in the particular security.
3. What is the Franklin India Feeder?
A: The Franklin India Feeder or the Franklin US Opportunities Fund is one of the most successful international mutual funds. This fund allows you to invest in multiple securities of companies in the United States involved in fields like technology, healthcare, consumer cyclical, financial services, and many more such industrial sectors. These mutual funds allow you to diversify your portfolio of investments, making it easy to invest in multiple securities through a single investment. Since its launch, the Franklin India Feeder has produced returns of 19.9%.
4. What is the BlackRock World Mining Fund?
A: This is different from Franklin as it has an equity sector only in necessary materials and financial services. This is considered to be a high-risk mutual fund, but has been known to produce excellent returns. The DSP BlackRock World Mining has produced returns of nearly 34.9% for the 3- year investment period.
5. Are earnings from international mutual funds taxed?
A: Yes, Earnings from international mutual funds are taxed. Dividends that you earn from these funds are liable for Tax Deducted at Source or TDS at 7.5% till March 31, 2021, and the mutual fund house deducts it. If you have invested for 3 years, it will fall under the short-term investment, and if for more, you will have to categorize it under long-term investment. The taxation slab will also depend on the time for which the investment has been made.
6. What is the main risk of the international mutual fund?
A: The primary risk of the international mutual fund is the fluctuating nature of the foreign exchange rate. If the foreign exchange rates fluctuate compared to the rupee, it can adversely affect your investment.
7. Who should invest in a foreign mutual fund?
A: If you are looking to diversify your investment portfolio and looking to add a geographical diversification, then you could consider investing in a foreign mutual fund.
All efforts have been made to ensure the information provided here is accurate. However, no guarantees are made regarding correctness of data. Please verify with scheme information document before making any investment.


AMFI Registration No. 112358 | CIN: U74999MH2016PTC282153
Shepard Technologies Pvt. Ltd. (with ARN code 112358) makes no warranties or representations, express or implied, on products offered through the platform. It accepts no liability for any damages or losses, however caused, in connection with the use of, or on the reliance of its product or related services. Terms and conditions of the website are applicable.
©2025 Shepard Technologies Private Limited. All Rights Reserved
Very good article I got all the required information.