 +91-22-48913909
Table of Contents
- What are Fund of Funds?
- What are the Types of Fund of Funds?
- Who should Invest in Fund of Funds?
- Advantages of Investing in Fund of Funds
- Limitations of Fund of Funds
- Best Performing Fund of Funds to Invest 2025
- Advantages of Fund of Funds
- How Does a Fund of Fund Works?
- Why Choose Fund of Funds?
- How to Invest in FOF Mutual Funds Online?
- FAQs
- 1. What is the most significant advantage of FOFs?
- 2. What are the different types of FOFs?
- 3. What are the parameters to consider while investing in FOFs?
- 4. Which FOF has shown the best returns?
- 5. Is there any commonest FOFs?
- 6. What is one of the most critical limitations of FOF?
- 7. Do FOFs have a long lock-in period?
Top 7 Funds
7 Best Fund of Funds in India 2025
fund of funds is one of the Top Mutual Funds for investors whose investment amounts are not too large and it is easier to manage one fund (a fund of funds) rather than a number of Mutual Funds. In this form of mutual fund investment strategy, investors get to hold a number of funds under the umbrella of a single fund, hence the name funds of funds.
Often going by the name of multi-manager investment; it is considered as one of the mutual fund categories. One of the key advantages of multi-manager investments is that at a lower ticket size, the investor can diversify themselves across a gamut of mutual fund schemes. So let us go through the numerous aspects of fund of funds like why to invest in a fund of funds, advantages of fund of funds, fund of funds in India, the performance of fund of funds, and other important aspects.
What are Fund of Funds?
In simple words, a Mutual Fund Investing its collected pool of money in another mutual fund (one or maybe more) is referred to as fund of funds. Investors in their portfolios take exposure to different funds and keep track of them separately. However, by Investing in multi-manager mutual funds this process gets more simplified as investors need to track only one fund, which in turn holds numerous mutual funds within it. Assume an individual has invested in 10 different funds having exposure in various financial assets like stocks, Bonds, government securities, gold, etc. However, he finds it difficult in managing those funds as he needs to keep a track of each fund separately. Therefore, to avoid such hassles, the investor invests money in a multi-management investment (or a single funds of funds strategy) which has its stakes in different Mutual Funds.
What are the Types of Fund of Funds?
1. Asset allocation funds
These funds consist of a diverse asset pool – with securities comprising of equity, debt instruments, precious metals, etc. This allows Asset Allocation funds to generate high returns through the best performing instrument, at a reduced risk level guaranteed by the relatively stable securities present in the portfolio.
2. Gold funds
Investing in different Mutual Funds, primarily trading in gold securities are gold funds. Fund of funds belonging to this category can have a portfolio of Mutual Funds or the gold trading companies themselves, depending upon the concerned asset management company.
3. International fund of funds
Mutual Funds operating in foreign countries are targeted by the international fund of funds. This allows investors to potentially yield higher returns through the best-performing stocks and bonds of the respective country.
4. Multi-manager fund of funds
This is the most common type of fund of funds Mutual Funds available in the Market. The asset base of such a fund comprises of various professionally managed Mutual Funds, all of which have a different portfolio concentration. A multi-manager fund of funds usually has multiple portfolio managers, each dealing with a specific asset present in the Mutual Fund.
Talk to our investment specialist
5. ETF Fund of Funds
Fund of funds comprising Exchange Traded Fund in their portfolio is a popular investment tool in the country. Investing in an ETF through fund of funds is more accessible than a direct investment in this instrument. This is because ETFs require the a Demat Trading Account while investing in ETF fund of funds have no such limitations.
However, ETFs have a slightly higher risk Factor associated with them as they are traded like shares in the stock market, making these fund of funds more susceptible to the volatility of the market.
Who should Invest in Fund of Funds?
The main aim of the top fund of funds is to maximise returns by investing in a varied portfolio posing minimal risk. Individuals with access to a small pool of financial resources which they can spare for a more extended period of time can choose such a Mutual Fund. Since the portfolio of such funds consists of varying Types of Mutual Funds, it ensures access to high-value funds as well.
Ideally, investors with relatively fewer resources and low liquidity needs can choose to invest in the top fund of funds available in the market. This enables them to earn maximum returns at minimal risk.
Advantages of Investing in Fund of Funds
There are various benefits of investing in a fund of funds Mutual Fund –
1. Diversification
Fund of funds target various Best Performing Mutual Funds in the market, each specialising in a particular asset or sector of fund. This ensures gains through diversification, as both returns and risks are optimised due to underlying portfolio variety.
2. Professionally trained managers
Fund of funds is managed by highly trained people with years of experience. Proper analysis and calculated market predictions made by such portfolio managers ensure high yields through intricate investment strategies.
3. Low resource requirements
An individual with limited financial resources can easily invest in the top fund of funds available to earn higher profits. Monthly investment schemes can also be availed while choosing a fund of funds to invest in.
Limitations of Fund of Funds
1. Expense ratio
Expense ratios to manage a fund of funds Mutual Funds are higher than standard Mutual Funds, as it has a higher managing expense. Added expenses include primarily choosing the right asset to invest in, which keeps on fluctuating periodically.
2. Tax
Tax levied on a fund of funds are payable by an investor, only during Redemption of the principal amount. However, during recovery, both short-term and long-term Capital gains are subjected to tax deductions, depending upon the annual Income of the investor and the time period of investment.
Best Performing Fund of Funds to Invest 2025
Fund NAV Net Assets (Cr) 3 MO (%) 6 MO (%) 1 YR (%) 3 YR (%) 5 YR (%) 2023 (%) IDBI Nifty Index Fund Growth ₹36.2111
↓ -0.02 ₹208 9.1 11.9 16.2 20.3 11.7 ICICI Prudential Advisor Series - Hybrid Fund Growth ₹61.1697
↑ 0.02 ₹263 1.4 1.7 10.2 10.9 13 12.3 ICICI Prudential Advisor Series - Debt Management Fund Growth ₹44.293
↑ 0.06 ₹112 3 4.6 9.3 7.6 7.1 8.1 IDFC All Seasons Bond Fund Growth ₹43.0795
↑ 0.03 ₹134 2.5 4.1 8.5 6.6 6.5 7.8 ICICI Prudential Advisor Series - Conservative Fund Growth ₹111.653
↓ -0.21 ₹23,317 -1.1 -2 6.2 11.9 17.2 13.5 ICICI Prudential Advisor Series - Passive Strategy Fund Growth ₹149.566
↑ 2.19 ₹168 -1.4 -7.2 4.9 14.9 24.1 15.9 Franklin India Dynamic PE Ratio Fund of Funds Growth ₹154.107
↓ -0.41 ₹1,229 -2.4 -3.7 4.5 11.4 16.2 12.9 Note: Returns up to 1 year are on absolute basis & more than 1 year are on CAGR basis. as on 28 Jul 23 Assets >= 50 Crore & Sorted based on 1 year Return.
The investment objective of the scheme is to invest in the stocks and equity related instruments comprising the S&P CNX Nifty Index in the same weights as these stocks represented in the Index with the intent to replicate the performance of the Total Returns Index of S&P CNX Nifty index. The scheme will adopt a passive investment strategy and will seek to achieve the investment objective by minimizing the tracking error between the S&P CNX Nifty index (Total Returns Index) and the scheme. IDBI Nifty Index Fund is a Others - Index Fund fund was launched on 25 Jun 10. It is a fund with Moderately High risk and has given a Below is the key information for IDBI Nifty Index Fund Returns up to 1 year are on (Erstwhile ICICI Prudential Advisor Series - Cautious Plan) The primary investment objective of this Plan is to seek to generate regular income primarily through investments in the schemes of domestic or offshore Mutual Fund(s) having asset allocation: • Primarily to fixed income securities • To a lesser extent (maximum 35%) in equity and equity related securities so as to generate long-term capital appreciation. However, there can be no assurance that the investment objectives of the Plan/s will be realized. ICICI Prudential Advisor Series - Hybrid Fund is a Others - Fund of Fund fund was launched on 18 Dec 03. It is a fund with Moderately High risk and has given a Below is the key information for ICICI Prudential Advisor Series - Hybrid Fund Returns up to 1 year are on (Erstwhile ICICI Prudential Advisor Series - Dynamic Accrual Plan) The primary investment objective of this Plan is to seek to provide reasonable returns, commensurate with low risk while providing a high level of liquidity, through investments made primarily in the schemes of domestic or offshore Mutual Fund(s) having asset allocation to: • Money market and debt securities. This Plan may be considered to be ideal for investors having a low risk appetite and a shorter duration of investment. However, there can be no assurance that the investment objectives of the Plan/s will be realized. ICICI Prudential Advisor Series - Debt Management Fund is a Others - Fund of Fund fund was launched on 18 Dec 03. It is a fund with Moderate risk and has given a Below is the key information for ICICI Prudential Advisor Series - Debt Management Fund Returns up to 1 year are on Seek to generate optimal returns with high liquidity by active management of
the portfolio by investing predominantly in debt oriented mutual fund schemes and money market instruments. However, there can be no assurance that the investment objectives of the Scheme will be realized. IDFC All Seasons Bond Fund is a Others - Fund of Fund fund was launched on 13 Sep 04. It is a fund with Moderately Low risk and has given a Below is the key information for IDFC All Seasons Bond Fund Returns up to 1 year are on (Erstwhile ICICI Prudential Advisor Series - Moderate Plan) The primary investment objective of this Plan is to seek to generate long term capital appreciation and current income by creating a portfolio that is invested in the schemes of domestic or offshore Mutual Fund(s) mainly having asset allocation to: • Equity and equity related securities as well as • Fixed income securities. However, there can be no assurance that the investment objectives of the Plan/s will be realized. ICICI Prudential Advisor Series - Conservative Fund is a Others - Fund of Fund fund was launched on 18 Dec 03. It is a fund with Moderately High risk and has given a Below is the key information for ICICI Prudential Advisor Series - Conservative Fund Returns up to 1 year are on (Erstwhile ICICI Prudential Advisor Series - Long Term Savings Plan) The primary investment objective of this Plan is to seek to generate long term capital appreciation from a portfolio that is invested predominantly in the schemes of domestic or offshore Mutual Fund(s) mainly having asset allocation to: • Equity and equity related securities and • A small portion in debt and money market instruments. However, there can be no assurance that the investment objective of the Scheme will be realized. ICICI Prudential Advisor Series - Passive Strategy Fund is a Others - Fund of Fund fund was launched on 18 Dec 03. It is a fund with Moderately High risk and has given a Below is the key information for ICICI Prudential Advisor Series - Passive Strategy Fund Returns up to 1 year are on To provide long term capital appreciation with relatively lower volatility through a dynamically balanced portfolio of equity and income funds Franklin India Dynamic PE Ratio Fund of Funds is a Others - Fund of Fund fund was launched on 31 Oct 03. It is a fund with Moderately High risk and has given a Below is the key information for Franklin India Dynamic PE Ratio Fund of Funds Returns up to 1 year are on 1. IDBI Nifty Index Fund
CAGR/Annualized return of 10.3% since its launch. Ranked 83 in Index Fund category. . IDBI Nifty Index Fund
Growth Launch Date 25 Jun 10 NAV (28 Jul 23) ₹36.2111 ↓ -0.02 (-0.06 %) Net Assets (Cr) ₹208 on 30 Jun 23 Category Others - Index Fund AMC IDBI Asset Management Limited Rating ☆ Risk Moderately High Expense Ratio 0.9 Sharpe Ratio 1.04 Information Ratio -3.93 Alpha Ratio -1.03 Min Investment 5,000 Min SIP Investment 500 Exit Load NIL Growth of 10,000 investment over the years.
Date Value 31 Mar 20 ₹10,000 31 Mar 21 ₹17,049 31 Mar 22 ₹20,178 31 Mar 23 ₹20,108 Returns for IDBI Nifty Index Fund
absolute basis & more than 1 year are on CAGR (Compound Annual Growth Rate) basis. as on 28 Jul 23 Duration Returns 1 Month 3.7% 3 Month 9.1% 6 Month 11.9% 1 Year 16.2% 3 Year 20.3% 5 Year 11.7% 10 Year 15 Year Since launch 10.3% Historical performance (Yearly) on absolute basis
Year Returns 2023 2022 2021 2020 2019 2018 2017 2016 2015 2014 Fund Manager information for IDBI Nifty Index Fund
Name Since Tenure Data below for IDBI Nifty Index Fund as on 30 Jun 23
Asset Allocation
Asset Class Value Top Securities Holdings / Portfolio
Name Holding Value Quantity 2. ICICI Prudential Advisor Series - Hybrid Fund
CAGR/Annualized return of 8.9% since its launch. Return for 2024 was 12.3% , 2023 was 14.4% and 2022 was 6.7% . ICICI Prudential Advisor Series - Hybrid Fund
Growth Launch Date 18 Dec 03 NAV (09 Apr 25) ₹61.1697 ↑ 0.02 (0.03 %) Net Assets (Cr) ₹263 on 28 Feb 25 Category Others - Fund of Fund AMC ICICI Prudential Asset Management Company Limited Rating ☆☆☆ Risk Moderately High Expense Ratio 1.06 Sharpe Ratio 0.77 Information Ratio 0 Alpha Ratio 0 Min Investment 5,000 Min SIP Investment 1,000 Exit Load 0-1 Months (0.25%),1 Months and above(NIL) Growth of 10,000 investment over the years.
Date Value 31 Mar 20 ₹10,000 31 Mar 21 ₹12,326 31 Mar 22 ₹13,495 31 Mar 23 ₹14,384 31 Mar 24 ₹16,692 31 Mar 25 ₹18,551 Returns for ICICI Prudential Advisor Series - Hybrid Fund
absolute basis & more than 1 year are on CAGR (Compound Annual Growth Rate) basis. as on 28 Jul 23 Duration Returns 1 Month 1.3% 3 Month 1.4% 6 Month 1.7% 1 Year 10.2% 3 Year 10.9% 5 Year 13% 10 Year 15 Year Since launch 8.9% Historical performance (Yearly) on absolute basis
Year Returns 2023 12.3% 2022 14.4% 2021 6.7% 2020 10.8% 2019 9.2% 2018 8.6% 2017 6.4% 2016 5.8% 2015 9.6% 2014 3% Fund Manager information for ICICI Prudential Advisor Series - Hybrid Fund
Name Since Tenure Manish Banthia 16 Jun 17 7.8 Yr. Ritesh Lunawat 29 Dec 20 4.26 Yr. Dharmesh Kakkad 28 May 18 6.85 Yr. Sharmila D’mello 13 May 24 0.88 Yr. Masoomi Jhurmarvala 4 Nov 24 0.4 Yr. Data below for ICICI Prudential Advisor Series - Hybrid Fund as on 28 Feb 25
Asset Allocation
Asset Class Value Cash 23.56% Equity 16.58% Debt 59.69% Other 0.16% Top Securities Holdings / Portfolio
Name Holding Value Quantity ICICI Pru Short Term Dir Gr
Investment Fund | -58% ₹154 Cr 24,284,437 ICICI Pru Equity Savings Dir Gr
Investment Fund | -29% ₹76 Cr 33,123,018
↓ -1,130,938 ICICI Prudential Eq Min Var Dir Gr
Investment Fund | -6% ₹17 Cr 18,161,560
↑ 2,933,895 ICICI Pru Exports and Services Dir Gr
Investment Fund | -5% ₹14 Cr 913,829
↑ 78,309 Net Current Assets
Net Current Assets | -1% ₹2 Cr Treps
CBLO/Reverse Repo | -0% ₹0 Cr 3. ICICI Prudential Advisor Series - Debt Management Fund
CAGR/Annualized return of 7.2% since its launch. Ranked 8 in Fund of Fund category. Return for 2024 was 8.1% , 2023 was 7.5% and 2022 was 4% . ICICI Prudential Advisor Series - Debt Management Fund
Growth Launch Date 18 Dec 03 NAV (09 Apr 25) ₹44.293 ↑ 0.06 (0.13 %) Net Assets (Cr) ₹112 on 28 Feb 25 Category Others - Fund of Fund AMC ICICI Prudential Asset Management Company Limited Rating ☆☆☆☆ Risk Moderate Expense Ratio 0.67 Sharpe Ratio 1.34 Information Ratio 0 Alpha Ratio 0 Min Investment 5,000 Min SIP Investment 100 Exit Load 0-6 Months (0.5%),6 Months and above(NIL) Growth of 10,000 investment over the years.
Date Value 31 Mar 20 ₹10,000 31 Mar 21 ₹10,863 31 Mar 22 ₹11,250 31 Mar 23 ₹11,888 31 Mar 24 ₹12,820 31 Mar 25 ₹13,909 Returns for ICICI Prudential Advisor Series - Debt Management Fund
absolute basis & more than 1 year are on CAGR (Compound Annual Growth Rate) basis. as on 28 Jul 23 Duration Returns 1 Month 1.8% 3 Month 3% 6 Month 4.6% 1 Year 9.3% 3 Year 7.6% 5 Year 7.1% 10 Year 15 Year Since launch 7.2% Historical performance (Yearly) on absolute basis
Year Returns 2023 8.1% 2022 7.5% 2021 4% 2020 4.2% 2019 9.7% 2018 8.7% 2017 6.2% 2016 6.5% 2015 11.2% 2014 11.1% Fund Manager information for ICICI Prudential Advisor Series - Debt Management Fund
Name Since Tenure Manish Banthia 16 Jun 17 7.79 Yr. Ritesh Lunawat 29 Dec 20 4.26 Yr. Data below for ICICI Prudential Advisor Series - Debt Management Fund as on 28 Feb 25
Asset Allocation
Asset Class Value Cash 5.96% Equity 0.14% Debt 93.64% Other 0.26% Top Securities Holdings / Portfolio
Name Holding Value Quantity ICICI Pru All Seasons Bond Dir Gr
Investment Fund | -40% ₹44 Cr 11,489,378 ICICI Pru Short Term Dir Gr
Investment Fund | -33% ₹37 Cr 5,832,596 ICICI Pru Medium Term Bond Dir Gr
Investment Fund | -13% ₹14 Cr 3,054,781 ICICI Pru Floating Interest Dir Gr
Investment Fund | -6% ₹6 Cr 139,373 ICICI Pru Const Mat Gilt Dir Gr
Investment Fund | -5% ₹6 Cr 2,428,656 HDFC Nifty G- Sec Jun 2027 Index Dir Gr
Investment Fund | -2% ₹2 Cr 1,759,375 HDFC Ultra S/T Fund Dir Gr
Investment Fund | -1% ₹1 Cr 524,400 Treps
CBLO/Reverse Repo | -1% ₹1 Cr Net Current Assets
Net Current Assets | -0% ₹0 Cr 4. IDFC All Seasons Bond Fund
CAGR/Annualized return of 7.4% since its launch. Ranked 36 in Fund of Fund category. Return for 2024 was 7.8% , 2023 was 6.8% and 2022 was 3.2% . IDFC All Seasons Bond Fund
Growth Launch Date 13 Sep 04 NAV (11 Apr 25) ₹43.0795 ↑ 0.03 (0.06 %) Net Assets (Cr) ₹134 on 28 Feb 25 Category Others - Fund of Fund AMC IDFC Asset Management Company Limited Rating ☆☆☆ Risk Moderately Low Expense Ratio 0.51 Sharpe Ratio 0.97 Information Ratio 0 Alpha Ratio 0 Min Investment 5,000 Min SIP Investment 1,000 Exit Load 0-3 Months (0.5%),3 Months and above(NIL) Growth of 10,000 investment over the years.
Date Value 31 Mar 20 ₹10,000 31 Mar 21 ₹10,810 31 Mar 22 ₹11,239 31 Mar 23 ₹11,682 31 Mar 24 ₹12,499 31 Mar 25 ₹13,506 Returns for IDFC All Seasons Bond Fund
absolute basis & more than 1 year are on CAGR (Compound Annual Growth Rate) basis. as on 28 Jul 23 Duration Returns 1 Month 1.4% 3 Month 2.5% 6 Month 4.1% 1 Year 8.5% 3 Year 6.6% 5 Year 6.5% 10 Year 15 Year Since launch 7.4% Historical performance (Yearly) on absolute basis
Year Returns 2023 7.8% 2022 6.8% 2021 3.2% 2020 3.3% 2019 10.5% 2018 10.4% 2017 6.3% 2016 5.9% 2015 8.9% 2014 8.3% Fund Manager information for IDFC All Seasons Bond Fund
Name Since Tenure Harshal Joshi 15 Jul 16 8.63 Yr. Data below for IDFC All Seasons Bond Fund as on 28 Feb 25
Asset Allocation
Asset Class Value Cash 36.57% Debt 63.32% Other 0.21% Top Securities Holdings / Portfolio
Name Holding Value Quantity Bandhan Corporate Bond Dir Gr
Investment Fund | -62% ₹83 Cr 43,437,363
↑ 6,857,620 Bandhan Arbitrage Dir Gr
Investment Fund | -38% ₹51 Cr 14,781,964
↑ 2,894,046 Triparty Repo Trp_030325
CBLO/Reverse Repo | -0% ₹0 Cr Net Current Assets
Net Current Assets | -0% ₹0 Cr Cash Margin - Ccil
CBLO/Reverse Repo | -0% ₹0 Cr 5. ICICI Prudential Advisor Series - Conservative Fund
CAGR/Annualized return of 12% since its launch. Return for 2024 was 13.5% , 2023 was 18.2% and 2022 was 8.2% . ICICI Prudential Advisor Series - Conservative Fund
Growth Launch Date 18 Dec 03 NAV (09 Apr 25) ₹111.653 ↓ -0.21 (-0.19 %) Net Assets (Cr) ₹23,317 on 28 Feb 25 Category Others - Fund of Fund AMC ICICI Prudential Asset Management Company Limited Rating ☆☆ Risk Moderately High Expense Ratio 1.35 Sharpe Ratio 0.01 Information Ratio 0 Alpha Ratio 0 Min Investment 5,000 Min SIP Investment 1,000 Exit Load 0-1 Years (1%),1 Years and above(NIL) Growth of 10,000 investment over the years.
Date Value 31 Mar 20 ₹10,000 31 Mar 21 ₹14,584 31 Mar 22 ₹16,622 31 Mar 23 ₹17,888 31 Mar 24 ₹21,806 31 Mar 25 ₹23,881 Returns for ICICI Prudential Advisor Series - Conservative Fund
absolute basis & more than 1 year are on CAGR (Compound Annual Growth Rate) basis. as on 28 Jul 23 Duration Returns 1 Month 0.7% 3 Month -1.1% 6 Month -2% 1 Year 6.2% 3 Year 11.9% 5 Year 17.2% 10 Year 15 Year Since launch 12% Historical performance (Yearly) on absolute basis
Year Returns 2023 13.5% 2022 18.2% 2021 8.2% 2020 16.6% 2019 13.4% 2018 9.7% 2017 8.6% 2016 15.3% 2015 12.8% 2014 2.3% Fund Manager information for ICICI Prudential Advisor Series - Conservative Fund
Name Since Tenure Sankaran Naren 5 Sep 18 6.49 Yr. Manish Banthia 16 Jun 17 7.71 Yr. Ritesh Lunawat 12 Jun 23 1.72 Yr. Dharmesh Kakkad 28 May 18 6.76 Yr. Data below for ICICI Prudential Advisor Series - Conservative Fund as on 28 Feb 25
Asset Allocation
Asset Class Value Cash 11.1% Equity 50.13% Debt 35.36% Other 3.41% Top Securities Holdings / Portfolio
Name Holding Value Quantity ICICI Pru All Seasons Bond Dir Gr
Investment Fund | -12% ₹2,901 Cr 754,316,852 ICICI Pru Banking & Fin Svcs Dir Gr
Investment Fund | -8% ₹1,964 Cr 151,219,737 ICICI Pru Short Term Dir Gr
Investment Fund | -7% ₹1,659 Cr 262,025,065 ICICI Prudential Energy Opps Dir Gr
Investment Fund | -7% ₹1,543 Cr 1,815,385,602
↑ 803,898,073 ICICI Pru Infrastructure Dir Gr
Investment Fund | -6% ₹1,496 Cr 84,556,992
↑ 2,763,056 ICICI Pru Technology Dir Gr
Investment Fund | -5% ₹1,264 Cr 61,116,206
↑ 5,202,150 ICICI Pru Focused Equity Dir Gr
Investment Fund | -5% ₹1,109 Cr 126,175,849 ICICI Pru Innovt Dir Gr
Investment Fund | -5% ₹1,066 Cr 667,022,314 ICICI Pru Banking & PSU Debt Dir Gr
Investment Fund | -4% ₹1,015 Cr 307,857,485 ICICI Pru Savings Dir Gr
Investment Fund | -4% ₹919 Cr 17,183,792
↓ -10,268,883 6. ICICI Prudential Advisor Series - Passive Strategy Fund
CAGR/Annualized return of 13.5% since its launch. Return for 2024 was 15.9% , 2023 was 29.3% and 2022 was 4.2% . ICICI Prudential Advisor Series - Passive Strategy Fund
Growth Launch Date 18 Dec 03 NAV (11 Apr 25) ₹149.566 ↑ 2.19 (1.48 %) Net Assets (Cr) ₹168 on 28 Feb 25 Category Others - Fund of Fund AMC ICICI Prudential Asset Management Company Limited Rating Risk Moderately High Expense Ratio 0.35 Sharpe Ratio -0.21 Information Ratio 0.7 Alpha Ratio 1.82 Min Investment 5,000 Min SIP Investment 1,000 Exit Load 0-3 Years (1%),3 Years and above(NIL) Growth of 10,000 investment over the years.
Date Value 31 Mar 20 ₹10,000 31 Mar 21 ₹16,722 31 Mar 22 ₹19,475 31 Mar 23 ₹20,515 31 Mar 24 ₹28,252 31 Mar 25 ₹30,879 Returns for ICICI Prudential Advisor Series - Passive Strategy Fund
absolute basis & more than 1 year are on CAGR (Compound Annual Growth Rate) basis. as on 28 Jul 23 Duration Returns 1 Month 3.6% 3 Month -1.4% 6 Month -7.2% 1 Year 4.9% 3 Year 14.9% 5 Year 24.1% 10 Year 15 Year Since launch 13.5% Historical performance (Yearly) on absolute basis
Year Returns 2023 15.9% 2022 29.3% 2021 4.2% 2020 30.3% 2019 10.7% 2018 6.7% 2017 4% 2016 19.2% 2015 11.2% 2014 1.2% Fund Manager information for ICICI Prudential Advisor Series - Passive Strategy Fund
Name Since Tenure Sankaran Naren 5 Sep 18 6.57 Yr. Dharmesh Kakkad 28 May 18 6.85 Yr. Sharmila D’mello 13 May 24 0.88 Yr. Masoomi Jhurmarvala 4 Nov 24 0.4 Yr. Data below for ICICI Prudential Advisor Series - Passive Strategy Fund as on 28 Feb 25
Asset Allocation
Asset Class Value Cash 2.28% Equity 97.72% Top Securities Holdings / Portfolio
Name Holding Value Quantity ICICI Pru Nifty Private Banks ETF
- | -21% ₹35 Cr 14,540,963
↑ 347,000 ICICI Pru Nifty Bank ETF
- | -17% ₹29 Cr 5,929,440 ICICI Pru Nifty FMCG ETF
- | -10% ₹17 Cr 3,156,300 ICICI Pru Nifty India Consumption ETF
- | -9% ₹15 Cr 1,450,930 ICICI Pru Nifty Healthcare ETF
- | -9% ₹15 Cr 1,136,801 ICICI Prudential Nifty Oil & Gas ETF
- | -8% ₹13 Cr 13,306,960
↑ 430,000 ICICI Pru Nifty IT ETF
- | -7% ₹11 Cr 2,831,290
↑ 197,000 CPSE ETF
- | -5% ₹9 Cr 1,198,200
↑ 440,000 ICICI Prudential Nifty Infra ETF
- | -5% ₹8 Cr 1,068,642 ICICI Prudential Nifty Commodities ETF
- | -4% ₹6 Cr 820,000 7. Franklin India Dynamic PE Ratio Fund of Funds
CAGR/Annualized return of 13.6% since its launch. Ranked 24 in Fund of Fund category. Return for 2024 was 12.9% , 2023 was 21.6% and 2022 was 7.1% . Franklin India Dynamic PE Ratio Fund of Funds
Growth Launch Date 31 Oct 03 NAV (09 Apr 25) ₹154.107 ↓ -0.41 (-0.27 %) Net Assets (Cr) ₹1,229 on 28 Feb 25 Category Others - Fund of Fund AMC Franklin Templeton Asst Mgmt(IND)Pvt Ltd Rating ☆☆☆ Risk Moderately High Expense Ratio 1.37 Sharpe Ratio -0.36 Information Ratio 0 Alpha Ratio 0 Min Investment 5,000 Min SIP Investment 500 Exit Load 0-1 Years (1%),1 Years and above(NIL) Growth of 10,000 investment over the years.
Date Value 31 Mar 20 ₹10,000 31 Mar 21 ₹12,308 31 Mar 22 ₹15,670 31 Mar 23 ₹16,356 31 Mar 24 ₹20,901 31 Mar 25 ₹22,466 Returns for Franklin India Dynamic PE Ratio Fund of Funds
absolute basis & more than 1 year are on CAGR (Compound Annual Growth Rate) basis. as on 28 Jul 23 Duration Returns 1 Month 1.1% 3 Month -2.4% 6 Month -3.7% 1 Year 4.5% 3 Year 11.4% 5 Year 16.2% 10 Year 15 Year Since launch 13.6% Historical performance (Yearly) on absolute basis
Year Returns 2023 12.9% 2022 21.6% 2021 7.1% 2020 36.3% 2019 -7.7% 2018 5.8% 2017 4.9% 2016 15.5% 2015 7.7% 2014 5.2% Fund Manager information for Franklin India Dynamic PE Ratio Fund of Funds
Name Since Tenure Venkatesh Sanjeevi 4 Oct 24 0.49 Yr. Rajasa Kakulavarapu 7 Feb 22 3.15 Yr. Data below for Franklin India Dynamic PE Ratio Fund of Funds as on 28 Feb 25
Asset Allocation
Asset Class Value Cash 5.79% Equity 44.85% Debt 49.22% Other 0.14% Top Securities Holdings / Portfolio
Name Holding Value Quantity Franklin India Flexi Cap Dir Gr
Investment Fund | -47% ₹577 Cr 3,638,898
↑ 175,422 ICICI Pru Short Term Dir Gr
Investment Fund | -26% ₹322 Cr 50,859,270
↓ -2,536,100 SBI Short Term Debt Dir Gr
Investment Fund | -26% ₹321 Cr 97,577,174
↓ -4,873,012 Franklin India S/T Income Dir Gr
Investment Fund | -0% ₹0 Cr 1,211 Franklin India Dynamic Accrual Fund- Segregated Portfolio 3- 9.50% Yes Bank
- | -0% ₹0 Cr 1,483,903 Franklin India S/T Inc Sgtd Ptf3DirRetGr
Investment Fund | -0% ₹0 Cr 1,370,528 Call, Cash & Other Assets
CBLO | -1% ₹8 Cr
Advantages of Fund of Funds
Like every mutual fund, fund of funds also has numerous advantages. Some of them are:
1. Portfolio Diversification and Fund Allocation
One of the key primary benefits is portfolio diversification. Here, despite investing in one single fund, the investment is made in several mutual fund schemes, where the fund is allocated in an optimal manner with the aim to earn maximum returns at a given level of risk.
2. Gateway for Diversified Assets
Multi-management investment helps retail investors to get access to funds that are not easily available for investments. A single fund of fund can take exposure in turn to Equity Funds, Debt fund or even commodity based mutual funds. This ensures diversification for the retail investor by just getting into one Mutual fund.
3. Due Diligence Process
All the funds under this category are expected to follow a due diligence process conducted by the fund manager where they need to check the background and credentials of the underlying fund managers before making an investment to ensure the strategy is in-line with expectations.
4. Less Investment Amount
This is a good option for retail investors who wish to venture into this investment avenue with a lower ticket size.
How Does a Fund of Fund Works?
For understanding the modalities of how multi-manager investment functions, it is important to understand the concepts of fettered and unfettered management. Fettered management is a situation when the mutual fund invests its money in a portfolio containing assets and funds managed by its own company. In other words, the money is invested in the funds of the same asset management company. In contrast, unfettered management is a situation where the mutual fund invests in external funds managed by other Asset Management Companies. Unfettered funds have an advantage over fettered funds as they can exploit opportunities from numerous funds and other schemes instead of limiting themselves to the same family funds.
Why Choose Fund of Funds?
The following image gives clarity on how multi-management investment can help an individual instead of a simple mutual fund to achieve their objectives.
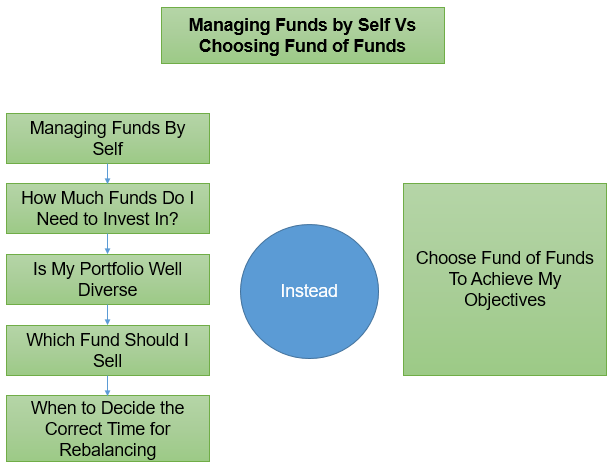
Though multi-management investment has a lot of benefits associated with it, one of the important factors that one needs to be aware of is the fee associated with it. Investors should be aware of any charges or expenses that a mutual fund will attract and make their investments accordingly. Therefore, in a nutshell, it can be concluded fund of funds is an ideal investment option for investors who seek to enjoy a hassle free investment in mutual funds.
How to Invest in FOF Mutual Funds Online?
Open Free Investment Account for Lifetime at Fincash.com.
Complete your Registration and KYC Process
Upload Documents (PAN, Aadhaar, etc.). And, You are Ready to Invest!
FAQs
1. What is the most significant advantage of FOFs?
A: The most significant advantage of FOFs is that it diversifies your investment and ensures good returns. If you are planning to diversify your investment portfolio, it is good to invest in FOFs. It reduces your risk and ensures that you enjoy good returns on your investments.
2. What are the different types of FOFs?
A: There are five different types of FOFs, and these are as follows:
- Asset Allocation funds
- Gold funds
- International FOFs
- ETF FOFs
- Multi-manager FOFs
Each of the FOF has unique features. For example, in gold funds you will invest in gold ETF and in multi-managers FOFs you will invest in different types of mutual funds.
3. What are the parameters to consider while investing in FOFs?
A: FOFs are mutual funds, hence, when you invest you should consider your risk taking capacity and the amount of money you want to invest. The percentage of returns you expect in the given time will give you an idea of your capacity to take risks. Based on that, you should evaluate the money you want to invest. Your financial condition should also help you decide how much money you should invest in FOFs.
Once you have assessed these two factors, select a particular FOF and start investing.
4. Which FOF has shown the best returns?
A: Gold FOFs are considered one of the most secure investments. These are like gold ETFs, and when you invest in gold FOF, it is like investing in physical gold without the added issues like paying GST, Sales Tax, or wealth tax. This investment is secure as gold price never falls extensively compared to the market and hence, produces good returns. Thus, often gold FOF is considered one of the best and safest investments.
5. Is there any commonest FOFs?
A: The Exchange Traded Funds or the ETFs are the most popular FOFs as investing in these funds is the easiest. All you need to do is open a Demat account to trade in ETFs, and there are no limitations as to the amount of money you can invest in ETFs.
6. What is one of the most critical limitations of FOF?
A: It is taxable. As an investor, you will have to pay tax on the principal amount when you redeem your investment. If you invest in FOF for the short-term, you will have to pay Taxes on the principal and the returns. However, dividend earned is not taxable as the fund house bears the taxes.
7. Do FOFs have a long lock-in period?
A: Different FOFs have different investment periods. However, if you want to earn maximum returns, you must invest in FOFs for a reasonably long time.
All efforts have been made to ensure the information provided here is accurate. However, no guarantees are made regarding correctness of data. Please verify with scheme information document before making any investment.


AMFI Registration No. 112358 | CIN: U74999MH2016PTC282153
Shepard Technologies Pvt. Ltd. (with ARN code 112358) makes no warranties or representations, express or implied, on products offered through the platform. It accepts no liability for any damages or losses, however caused, in connection with the use of, or on the reliance of its product or related services. Terms and conditions of the website are applicable.
©2025 Shepard Technologies Private Limited. All Rights Reserved