भारत में 7 सर्वश्रेष्ठ फंड ऑफ फंड्स 2022
निधि का कोष उसमे से एकशीर्ष म्युचुअल फंड उन निवेशकों के लिए जिनकी निवेश राशि बहुत बड़ी नहीं है और एक फंड (फंड का एक फंड) का प्रबंधन करना आसान है, न कि कई फंडों के लिए।म्यूचुअल फंड्स. म्यूचुअल फंड निवेश रणनीति के इस रूप में, निवेशकों को एक ही फंड की छतरी के नीचे कई फंड रखने को मिलते हैं, इसलिए फंड का नाम।
अक्सर बहु-प्रबंधक निवेश के नाम से जाना जाता है; इसे म्यूचुअल फंड श्रेणियों में से एक माना जाता है। बहु-प्रबंधक निवेश के प्रमुख लाभों में से एक यह है कि कम टिकट आकार पर,इन्वेस्टर म्यूचुअल फंड योजनाओं की एक श्रृंखला में खुद को विविधता प्रदान कर सकते हैं। तो आइए हम फंड ऑफ फंड्स के कई पहलुओं जैसे कि फंड ऑफ फंड में निवेश क्यों करें, फंड ऑफ फंड्स के फायदे, भारत में फंड ऑफ फंड्स, फंड ऑफ फंड्स का प्रदर्शन और अन्य महत्वपूर्ण पहलुओं के बारे में जानें।
फंड ऑफ फंड्स क्या हैं?
सरल शब्दों में, एम्यूचुअल फंड निवेश किसी अन्य म्यूचुअल फंड (एक या शायद अधिक) में इसके एकत्रित धन को फंड ऑफ फंड के रूप में संदर्भित किया जाता है। निवेशक अपने पोर्टफोलियो में अलग-अलग फंड में निवेश करते हैं और उन पर अलग से नजर रखते हैं। हालांकि, द्वारानिवेश मल्टी-मैनेजर म्यूचुअल फंड में यह प्रक्रिया और अधिक सरल हो जाती है क्योंकि निवेशकों को केवल एक फंड को ट्रैक करने की आवश्यकता होती है, जो बदले में इसके भीतर कई म्यूचुअल फंड रखता है। मान लें कि किसी व्यक्ति ने 10 अलग-अलग फंडों में निवेश किया है, जो विभिन्न वित्तीय परिसंपत्तियों जैसे स्टॉक में निवेश करते हैं,बांड, सरकारी प्रतिभूतियां, सोना, आदि। हालांकि, उन्हें उन फंडों का प्रबंधन करने में मुश्किल होती है क्योंकि उन्हें प्रत्येक फंड का अलग से ट्रैक रखने की आवश्यकता होती है। इसलिए, इस तरह की परेशानियों से बचने के लिए, निवेशक एक बहु-प्रबंधन निवेश (या फंड की रणनीति के एक एकल फंड) में पैसा निवेश करता है, जिसका अलग-अलग म्यूचुअल फंड में दांव होता है।
फंड ऑफ फंड्स के प्रकार क्या हैं?
1. एसेट एलोकेशन फंड्स
इन फंडों में एक विविध परिसंपत्ति पूल होता है - जिसमें इक्विटी, डेट इंस्ट्रूमेंट, कीमती धातु आदि शामिल होती हैं। यह अनुमति देता हैपरिसंपत्ति आवंटन पोर्टफोलियो में मौजूद अपेक्षाकृत स्थिर प्रतिभूतियों द्वारा गारंटीकृत कम जोखिम स्तर पर सर्वोत्तम प्रदर्शन करने वाले साधन के माध्यम से उच्च रिटर्न उत्पन्न करने के लिए फंड।
2. गोल्ड फंड
विभिन्न म्युचुअल फंडों में निवेश करना, मुख्य रूप से सोने की प्रतिभूतियों में व्यापार करना गोल्ड फंड हैं। संबंधित परिसंपत्ति प्रबंधन कंपनी के आधार पर, इस श्रेणी से संबंधित फंडों के फंड में म्यूचुअल फंड या स्वयं गोल्ड ट्रेडिंग कंपनियों का एक पोर्टफोलियो हो सकता है।
3. इंटरनेशनल फंड ऑफ फंड्स
विदेशों में कार्यरत म्युचुअल फंड किसके द्वारा लक्षित होते हैं?अंतरराष्ट्रीय कोष धन की। यह निवेशकों को संबंधित देश के सर्वश्रेष्ठ प्रदर्शन करने वाले स्टॉक और बॉन्ड के माध्यम से संभावित रूप से उच्च रिटर्न प्राप्त करने की अनुमति देता है।
4. मल्टी-मैनेजर फंड ऑफ फंड्स
यह म्युचुअल फंड में उपलब्ध फंडों का सबसे सामान्य प्रकार का फंड हैमंडी. ऐसे फंड के एसेट बेस में विभिन्न पेशेवर रूप से प्रबंधित म्युचुअल फंड शामिल होते हैं, जिनमें से सभी में एक अलग पोर्टफोलियो एकाग्रता होती है। एक मल्टी-मैनेजर फंड ऑफ फंड्स में आमतौर पर कई पोर्टफोलियो मैनेजर होते हैं, जिनमें से प्रत्येक म्यूचुअल फंड में मौजूद एक विशिष्ट एसेट से संबंधित होता है।
Talk to our investment specialist
5. ईटीएफ फंड ऑफ फंड्स
निधियों का कोष जिसमें शामिल हैंविनिमय व्यापार फंड उनके पोर्टफोलियो में देश में एक लोकप्रिय निवेश उपकरण है। इस साधन में प्रत्यक्ष निवेश की तुलना में फंड ऑफ फंड्स के माध्यम से ईटीएफ में निवेश करना अधिक सुलभ है। ऐसा इसलिए है क्योंकि ईटीएफ को डीमैट की आवश्यकता होती हैट्रेडिंग खाते जबकि ईटीएफ फंड ऑफ फंड्स में निवेश करने की ऐसी कोई सीमा नहीं है।
हालांकि, ईटीएफ में थोड़ा अधिक जोखिम होता हैफ़ैक्टर उनके साथ जुड़ा हुआ है क्योंकि उनका शेयर बाजार में शेयरों की तरह कारोबार होता है, जिससे ये फंड ऑफ फंड्स बाजार की अस्थिरता के प्रति अधिक संवेदनशील हो जाते हैं।
फंड ऑफ फंड्स में किसे निवेश करना चाहिए?
फंड के शीर्ष फंड का मुख्य उद्देश्य न्यूनतम जोखिम वाले विविध पोर्टफोलियो में निवेश करके अधिकतम रिटर्न प्राप्त करना है। वित्तीय संसाधनों के एक छोटे से पूल तक पहुंच वाले व्यक्ति, जिसे वे अधिक विस्तारित अवधि के लिए छोड़ सकते हैं, ऐसा म्यूचुअल फंड चुन सकते हैं। चूंकि ऐसे फंडों के पोर्टफोलियो में अलग-अलग होते हैंम्यूचुअल फंड के प्रकार, यह उच्च तक पहुंच सुनिश्चित करता है-मूल्य निधि भी।
आदर्श रूप से, अपेक्षाकृत कम संसाधनों वाले निवेशक और कमलिक्विडिटी जरूरतें बाजार में उपलब्ध फंडों के शीर्ष फंड में निवेश करना चुन सकती हैं। यह उन्हें न्यूनतम जोखिम पर अधिकतम रिटर्न अर्जित करने में सक्षम बनाता है।
फंड ऑफ फंड्स में निवेश के फायदे
विभिन्न हैंनिवेश के लाभ निधियों के एक कोष में म्युचुअल फंड -
1. विविधीकरण
फंड ऑफ फंड्स टारगेट विभिन्नसर्वश्रेष्ठ प्रदर्शन करने वाले म्युचुअल फंड बाजार में, प्रत्येक एक विशेष संपत्ति या फंड के क्षेत्र में विशेषज्ञता। यह विविधीकरण के माध्यम से लाभ सुनिश्चित करता है, क्योंकि अंतर्निहित पोर्टफोलियो विविधता के कारण रिटर्न और जोखिम दोनों को अनुकूलित किया जाता है।
2. व्यावसायिक रूप से प्रशिक्षित प्रबंधक
फंड ऑफ फंड्स का प्रबंधन उच्च प्रशिक्षित लोगों द्वारा किया जाता है जिनके पास वर्षों का अनुभव है। ऐसे पोर्टफोलियो प्रबंधकों द्वारा किए गए उचित विश्लेषण और परिकलित बाजार पूर्वानुमान जटिल निवेश रणनीतियों के माध्यम से उच्च प्रतिफल सुनिश्चित करते हैं।
3. कम संसाधन आवश्यकताएं
सीमित वित्तीय संसाधनों वाला व्यक्ति उच्च लाभ अर्जित करने के लिए उपलब्ध फंड के शीर्ष फंड में आसानी से निवेश कर सकता है। निवेश करने के लिए फंड का फंड चुनते समय मासिक निवेश योजनाओं का भी लाभ उठाया जा सकता है।
निधियों की निधि की सीमाएं
1. व्यय अनुपात
फंड के फंड का प्रबंधन करने के लिए व्यय अनुपातम्यूचुअल फंड मानक म्यूचुअल फंड से अधिक हैं, क्योंकि इसका प्रबंधन व्यय अधिक है। अतिरिक्त खर्चों में मुख्य रूप से निवेश करने के लिए सही संपत्ति का चयन करना शामिल है, जिसमें समय-समय पर उतार-चढ़ाव होता रहता है।
2. टैक्स
किसी फंड ऑफ फंड पर लगाया गया कर एक निवेशक द्वारा देय होता है, केवल के दौरानमोचन मूल राशि का। हालांकि, वसूली के दौरान, अल्पकालिक और दीर्घकालिक दोनोंराजधानी वार्षिक के आधार पर लाभ कर कटौती के अधीन हैंआय निवेशक की और निवेश की समय अवधि।
2022 में निवेश करने के लिए फंड का सर्वश्रेष्ठ प्रदर्शन करने वाला फंड
Fund NAV Net Assets (Cr) 3 MO (%) 6 MO (%) 1 YR (%) 3 YR (%) 5 YR (%) 2024 (%) PGIM India Euro Equity Fund Growth ₹19.83
↓ -0.31 ₹1,263 9.4 8.5 23.9 21 2.8 18.3 IDBI Nifty Index Fund Growth ₹36.2111
↓ -0.02 ₹208 9.1 11.9 16.2 20.3 11.7 PGIM India Global Agribusiness Offshore Fund Growth ₹43.8
↑ 1.00 ₹1,511 -6.8 -9 9.9 15.4 5.9 7.9 Kotak Asset Allocator Fund - FOF Growth ₹233.629
↓ -9.53 ₹2,448 -8.9 -3.7 8.4 16.2 15.4 15.4 Bandhan All Seasons Bond Fund Growth ₹45.3431
↓ -0.02 ₹1,614 1 2.4 6.2 7 5.8 7.1 ICICI Prudential Advisor Series - Hybrid Fund Growth ₹64.8813
↓ -0.02 ₹2,825 1.1 2.6 6.1 11.3 9.9 6.6 HDFC Dynamic PE Ratio Fund of Funds Growth ₹40.1795
↓ -0.01 ₹2,346 0.7 2.2 5.9 12.5 12 1.3 Note: Returns up to 1 year are on absolute basis & more than 1 year are on CAGR basis. as on 23 Mar 26 Research Highlights & Commentary of 7 Funds showcased
Commentary PGIM India Euro Equity Fund IDBI Nifty Index Fund PGIM India Global Agribusiness Offshore Fund Kotak Asset Allocator Fund - FOF Bandhan All Seasons Bond Fund ICICI Prudential Advisor Series - Hybrid Fund HDFC Dynamic PE Ratio Fund of Funds Point 1 Bottom quartile AUM (₹1,263 Cr). Bottom quartile AUM (₹208 Cr). Lower mid AUM (₹1,511 Cr). Upper mid AUM (₹2,448 Cr). Lower mid AUM (₹1,614 Cr). Highest AUM (₹2,825 Cr). Upper mid AUM (₹2,346 Cr). Point 2 Established history (18+ yrs). Established history (15+ yrs). Established history (15+ yrs). Established history (21+ yrs). Established history (21+ yrs). Oldest track record among peers (22 yrs). Established history (14+ yrs). Point 3 Rating: 2★ (lower mid). Rating: 1★ (bottom quartile). Rating: 1★ (bottom quartile). Top rated. Rating: 3★ (upper mid). Rating: 3★ (upper mid). Rating: 3★ (lower mid). Point 4 Risk profile: High. Risk profile: Moderately High. Risk profile: High. Risk profile: Moderately High. Risk profile: Moderately Low. Risk profile: Moderately High. Risk profile: Moderately High. Point 5 5Y return: 2.77% (bottom quartile). 5Y return: 11.74% (upper mid). 5Y return: 5.86% (lower mid). 5Y return: 15.38% (top quartile). 5Y return: 5.79% (bottom quartile). 5Y return: 9.85% (lower mid). 5Y return: 12.03% (upper mid). Point 6 3Y return: 21.01% (top quartile). 3Y return: 20.28% (upper mid). 3Y return: 15.44% (lower mid). 3Y return: 16.24% (upper mid). 3Y return: 7.02% (bottom quartile). 3Y return: 11.26% (bottom quartile). 3Y return: 12.54% (lower mid). Point 7 1Y return: 23.94% (top quartile). 1Y return: 16.16% (upper mid). 1Y return: 9.91% (upper mid). 1Y return: 8.39% (lower mid). 1Y return: 6.24% (lower mid). 1Y return: 6.12% (bottom quartile). 1Y return: 5.86% (bottom quartile). Point 8 1M return: -7.34% (bottom quartile). 1M return: 3.68% (top quartile). 1M return: -1.64% (lower mid). 1M return: -11.24% (bottom quartile). 1M return: 0.22% (upper mid). 1M return: 0.16% (upper mid). 1M return: -0.05% (lower mid). Point 9 Alpha: -14.64 (bottom quartile). Alpha: -1.03 (lower mid). Alpha: -25.56 (bottom quartile). Alpha: 0.00 (top quartile). Alpha: 0.00 (upper mid). Alpha: 0.00 (upper mid). Alpha: 0.00 (lower mid). Point 10 Sharpe: 1.82 (upper mid). Sharpe: 1.04 (lower mid). Sharpe: -0.04 (bottom quartile). Sharpe: 2.72 (top quartile). Sharpe: 0.91 (bottom quartile). Sharpe: 1.46 (upper mid). Sharpe: 1.01 (lower mid). PGIM India Euro Equity Fund
IDBI Nifty Index Fund
PGIM India Global Agribusiness Offshore Fund
Kotak Asset Allocator Fund - FOF
Bandhan All Seasons Bond Fund
ICICI Prudential Advisor Series - Hybrid Fund
HDFC Dynamic PE Ratio Fund of Funds
संपत्ति>= 50 करोड़ के आधार पर छाँटे गए1 साल का रिटर्न.
(Erstwhile DHFL Pramerica Top Euroland Offshore Fund) The primary investment objective of the scheme is to generate long-term capital growth from a diversified portfolio of units of overseas mutual funds. Below is the key information for PGIM India Euro Equity Fund Returns up to 1 year are on The investment objective of the scheme is to invest in the stocks and equity related instruments comprising the S&P CNX Nifty Index in the same weights as these stocks represented in the Index with the intent to replicate the performance of the Total Returns Index of S&P CNX Nifty index. The scheme will adopt a passive investment strategy and will seek to achieve the investment objective by minimizing the tracking error between the S&P CNX Nifty index (Total Returns Index) and the scheme. Research Highlights for IDBI Nifty Index Fund Below is the key information for IDBI Nifty Index Fund Returns up to 1 year are on The primary investment objective of the scheme is to generate long-term capital growth by investing predominantly in units of overseas mutual funds, focusing on
agriculture and/or would be direct and indirect beneficiaries of the anticipated growth in the agriculture and/or affiliated/allied sectors. Research Highlights for PGIM India Global Agribusiness Offshore Fund Below is the key information for PGIM India Global Agribusiness Offshore Fund Returns up to 1 year are on The investment objective of the scheme is to generate long-term capital appreciation from a portfolio created by investing in
specified open-ended equity, and debt schemes of Kotak Mahindra Mutual Fund. However, there is no assurance that the investment objective of the Scheme will be realized Research Highlights for Kotak Asset Allocator Fund - FOF Below is the key information for Kotak Asset Allocator Fund - FOF Returns up to 1 year are on Seek to generate optimal returns with high liquidity by active management of
the portfolio by investing predominantly in debt oriented mutual fund schemes and money market instruments. However, there can be no assurance that the investment objectives of the Scheme will be realized. Research Highlights for Bandhan All Seasons Bond Fund Below is the key information for Bandhan All Seasons Bond Fund Returns up to 1 year are on (Erstwhile ICICI Prudential Advisor Series - Cautious Plan) The primary investment objective of this Plan is to seek to generate regular income primarily through investments in the schemes of domestic or offshore Mutual Fund(s) having asset allocation: • Primarily to fixed income securities • To a lesser extent (maximum 35%) in equity and equity related securities so as to generate long-term capital appreciation. However, there can be no assurance that the investment objectives of the Plan/s will be realized. Research Highlights for ICICI Prudential Advisor Series - Hybrid Fund Below is the key information for ICICI Prudential Advisor Series - Hybrid Fund Returns up to 1 year are on The Scheme seeks to generate regular income through investments in debt & money market instruments, along with capital appreciation through limited exposure to equity and equity related instruments. Research Highlights for HDFC Dynamic PE Ratio Fund of Funds Below is the key information for HDFC Dynamic PE Ratio Fund of Funds Returns up to 1 year are on 1. PGIM India Euro Equity Fund
PGIM India Euro Equity Fund
Growth Launch Date 11 Sep 07 NAV (23 Mar 26) ₹19.83 ↓ -0.31 (-1.54 %) Net Assets (Cr) ₹1,263 on 28 Feb 26 Category Others - Fund of Fund AMC Pramerica Asset Managers Private Limited Rating ☆☆ Risk High Expense Ratio 1.63 Sharpe Ratio 1.82 Information Ratio -0.15 Alpha Ratio -14.64 Min Investment 5,000 Min SIP Investment 1,000 Exit Load 0-12 Months (1%),12 Months and above(NIL) Growth of 10,000 investment over the years.
Date Value 28 Feb 21 ₹10,000 28 Feb 22 ₹7,917 28 Feb 23 ₹5,992 29 Feb 24 ₹6,936 28 Feb 25 ₹8,216 28 Feb 26 ₹11,448 Returns for PGIM India Euro Equity Fund
absolute basis & more than 1 year are on CAGR (Compound Annual Growth Rate) basis. as on 23 Mar 26 Duration Returns 1 Month -7.3% 3 Month 9.4% 6 Month 8.5% 1 Year 23.9% 3 Year 21% 5 Year 2.8% 10 Year 15 Year Since launch 3.8% Historical performance (Yearly) on absolute basis
Year Returns 2024 18.3% 2023 20.6% 2022 14.6% 2021 -35.6% 2020 -1.9% 2019 20.5% 2018 21.4% 2017 -10.3% 2016 14.6% 2015 -6.7% Fund Manager information for PGIM India Euro Equity Fund
Name Since Tenure Anandha Padmanabhan Anjeneyan 15 Feb 25 1.04 Yr. Vivek Sharma 15 Feb 25 1.04 Yr. Data below for PGIM India Euro Equity Fund as on 28 Feb 26
Asset Allocation
Asset Class Value Cash 4.53% Equity 95.47% Top Securities Holdings / Portfolio
Name Holding Value Quantity PGIM Jennison Emerging Mkts Eq USD W Acc
Investment Fund | -97% ₹1,220 Cr 924,825
↓ -10,050 Clearing Corporation Of India Ltd.
CBLO/Reverse Repo | -4% ₹46 Cr Net Receivables / (Payables)
Net Current Assets | -0% -₹3 Cr 2. IDBI Nifty Index Fund
IDBI Nifty Index Fund
Growth Launch Date 25 Jun 10 NAV (28 Jul 23) ₹36.2111 ↓ -0.02 (-0.06 %) Net Assets (Cr) ₹208 on 30 Jun 23 Category Others - Index Fund AMC IDBI Asset Management Limited Rating ☆ Risk Moderately High Expense Ratio 0.9 Sharpe Ratio 1.04 Information Ratio -3.93 Alpha Ratio -1.03 Min Investment 5,000 Min SIP Investment 500 Exit Load NIL Growth of 10,000 investment over the years.
Date Value 28 Feb 21 ₹10,000 28 Feb 22 ₹11,512 28 Feb 23 ₹11,889 Returns for IDBI Nifty Index Fund
absolute basis & more than 1 year are on CAGR (Compound Annual Growth Rate) basis. as on 23 Mar 26 Duration Returns 1 Month 3.7% 3 Month 9.1% 6 Month 11.9% 1 Year 16.2% 3 Year 20.3% 5 Year 11.7% 10 Year 15 Year Since launch 10.3% Historical performance (Yearly) on absolute basis
Year Returns 2024 2023 2022 2021 2020 2019 2018 2017 2016 2015 Fund Manager information for IDBI Nifty Index Fund
Name Since Tenure Data below for IDBI Nifty Index Fund as on 30 Jun 23
Asset Allocation
Asset Class Value Top Securities Holdings / Portfolio
Name Holding Value Quantity 3. PGIM India Global Agribusiness Offshore Fund
PGIM India Global Agribusiness Offshore Fund
Growth Launch Date 14 May 10 NAV (23 Mar 26) ₹43.8 ↑ 1.00 (2.34 %) Net Assets (Cr) ₹1,511 on 28 Feb 26 Category Others - Fund of Fund AMC Pramerica Asset Managers Private Limited Rating ☆ Risk High Expense Ratio 1.56 Sharpe Ratio -0.04 Information Ratio -0.65 Alpha Ratio -25.56 Min Investment 5,000 Min SIP Investment 1,000 Exit Load 0-12 Months (1%),12 Months and above(NIL) Growth of 10,000 investment over the years.
Date Value 28 Feb 21 ₹10,000 28 Feb 22 ₹8,981 28 Feb 23 ₹7,926 29 Feb 24 ₹11,439 28 Feb 25 ₹12,450 28 Feb 26 ₹12,893 Returns for PGIM India Global Agribusiness Offshore Fund
absolute basis & more than 1 year are on CAGR (Compound Annual Growth Rate) basis. as on 23 Mar 26 Duration Returns 1 Month -1.6% 3 Month -6.8% 6 Month -9% 1 Year 9.9% 3 Year 15.4% 5 Year 5.9% 10 Year 15 Year Since launch 9.8% Historical performance (Yearly) on absolute basis
Year Returns 2024 7.9% 2023 24% 2022 39.5% 2021 -33.8% 2020 7% 2019 72.4% 2018 30.9% 2017 0.3% 2016 11.9% 2015 0.8% Fund Manager information for PGIM India Global Agribusiness Offshore Fund
Name Since Tenure Anandha Padmanabhan Anjeneyan 15 Feb 25 1.04 Yr. Vivek Sharma 15 Feb 25 1.04 Yr. Data below for PGIM India Global Agribusiness Offshore Fund as on 28 Feb 26
Asset Allocation
Asset Class Value Cash 3.34% Equity 96.66% Top Securities Holdings / Portfolio
Name Holding Value Quantity PGIM Jennison Global Eq Opps USD I Acc
Investment Fund | -99% ₹1,490 Cr 527,147
↓ -1,610 Clearing Corporation Of India Ltd.
CBLO/Reverse Repo | -2% ₹23 Cr Net Receivables / (Payables)
Net Current Assets | -0% -₹2 Cr 4. Kotak Asset Allocator Fund - FOF
Kotak Asset Allocator Fund - FOF
Growth Launch Date 9 Aug 04 NAV (23 Mar 26) ₹233.629 ↓ -9.53 (-3.92 %) Net Assets (Cr) ₹2,448 on 28 Feb 26 Category Others - Fund of Fund AMC Kotak Mahindra Asset Management Co Ltd Rating ☆☆☆☆ Risk Moderately High Expense Ratio 1 Sharpe Ratio 2.72 Information Ratio 0 Alpha Ratio 0 Min Investment 5,000 Min SIP Investment 1,000 Exit Load 0-1 Years (1%),1 Years and above(NIL) Growth of 10,000 investment over the years.
Date Value 28 Feb 21 ₹10,000 28 Feb 22 ₹11,656 28 Feb 23 ₹13,006 29 Feb 24 ₹17,084 28 Feb 25 ₹18,281 28 Feb 26 ₹23,152 Returns for Kotak Asset Allocator Fund - FOF
absolute basis & more than 1 year are on CAGR (Compound Annual Growth Rate) basis. as on 23 Mar 26 Duration Returns 1 Month -11.2% 3 Month -8.9% 6 Month -3.7% 1 Year 8.4% 3 Year 16.2% 5 Year 15.4% 10 Year 15 Year Since launch 15.7% Historical performance (Yearly) on absolute basis
Year Returns 2024 15.4% 2023 19% 2022 23.4% 2021 11.3% 2020 25% 2019 25% 2018 10.3% 2017 4.4% 2016 13.7% 2015 8.8% Fund Manager information for Kotak Asset Allocator Fund - FOF
Name Since Tenure Abhishek Bisen 15 Nov 21 4.29 Yr. Devender Singhal 9 May 19 6.81 Yr. Data below for Kotak Asset Allocator Fund - FOF as on 28 Feb 26
Asset Allocation
Asset Class Value Cash 2.06% Equity 59.21% Debt 12.11% Other 26.62% Top Securities Holdings / Portfolio
Name Holding Value Quantity Kotak Gold ETF
- | -20% ₹479 Cr 36,077,481 Kotak Nifty PSU Bank ETF
- | -10% ₹245 Cr 2,497,000 Kotak Infra & Econ Reform Dir Gr
Investment Fund | -9% ₹223 Cr 28,411,378 Kotak Consumption Dir Gr
Investment Fund | -8% ₹204 Cr 146,659,548 Kotak Manufacture in India Dir Gr
Investment Fund | -8% ₹187 Cr 86,883,716
↑ 45,802,034 Kotak Silver ETF
- | -7% ₹180 Cr 70,000,000 Kotak Nifty IT ETF
- | -7% ₹170 Cr 50,200,000 Kotak Gilt Inv Growth - Direct
Investment Fund | -6% ₹138 Cr 12,634,309 Kotak Bond Dir Gr
Investment Fund | -5% ₹114 Cr 12,869,186 Kotak Trsptn & Lgstcs Dir Gr
Investment Fund | -5% ₹112 Cr 95,899,303 5. Bandhan All Seasons Bond Fund
Bandhan All Seasons Bond Fund
Growth Launch Date 13 Sep 04 NAV (24 Mar 26) ₹45.3431 ↓ -0.02 (-0.05 %) Net Assets (Cr) ₹1,614 on 28 Feb 26 Category Others - Fund of Fund AMC IDFC Asset Management Company Limited Rating ☆☆☆ Risk Moderately Low Expense Ratio 0.46 Sharpe Ratio 0.91 Information Ratio 0 Alpha Ratio 0 Min Investment 5,000 Min SIP Investment 1,000 Exit Load 0-3 Months (0.5%),3 Months and above(NIL) Growth of 10,000 investment over the years.
Date Value 28 Feb 21 ₹10,000 28 Feb 22 ₹10,445 28 Feb 23 ₹10,783 29 Feb 24 ₹11,580 28 Feb 25 ₹12,466 28 Feb 26 ₹13,317 Returns for Bandhan All Seasons Bond Fund
absolute basis & more than 1 year are on CAGR (Compound Annual Growth Rate) basis. as on 23 Mar 26 Duration Returns 1 Month 0.2% 3 Month 1% 6 Month 2.4% 1 Year 6.2% 3 Year 7% 5 Year 5.8% 10 Year 15 Year Since launch 7.3% Historical performance (Yearly) on absolute basis
Year Returns 2024 7.1% 2023 7.8% 2022 6.8% 2021 3.2% 2020 3.3% 2019 10.5% 2018 10.4% 2017 6.3% 2016 5.9% 2015 8.9% Fund Manager information for Bandhan All Seasons Bond Fund
Name Since Tenure Harshal Joshi 15 Jul 16 9.63 Yr. Data below for Bandhan All Seasons Bond Fund as on 28 Feb 26
Asset Allocation
Asset Class Value Cash 51.08% Debt 48.8% Other 0.16% Top Securities Holdings / Portfolio
Name Holding Value Quantity Bandhan Corporate Bond Dir Gr
Investment Fund | -59% ₹954 Cr 465,357,253 Bandhan Arbitrage Dir Gr
Investment Fund | -41% ₹659 Cr 180,017,399 Triparty Repo Trp_020326_val
CBLO/Reverse Repo | -0% ₹3 Cr Net Current Assets
Net Current Assets | -0% -₹2 Cr Cash Margin - Ccil
CBLO/Reverse Repo | -0% ₹0 Cr 6. ICICI Prudential Advisor Series - Hybrid Fund
ICICI Prudential Advisor Series - Hybrid Fund
Growth Launch Date 18 Dec 03 NAV (24 Mar 26) ₹64.8813 ↓ -0.02 (-0.03 %) Net Assets (Cr) ₹2,825 on 28 Feb 26 Category Others - Fund of Fund AMC ICICI Prudential Asset Management Company Limited Rating ☆☆☆ Risk Moderately High Expense Ratio 0.54 Sharpe Ratio 1.46 Information Ratio 0 Alpha Ratio 0 Min Investment 5,000 Min SIP Investment 1,000 Exit Load 0-1 Months (0.25%),1 Months and above(NIL) Growth of 10,000 investment over the years.
Date Value 28 Feb 21 ₹10,000 28 Feb 22 ₹10,919 28 Feb 23 ₹11,688 29 Feb 24 ₹13,530 28 Feb 25 ₹14,891 28 Feb 26 ₹16,084 Returns for ICICI Prudential Advisor Series - Hybrid Fund
absolute basis & more than 1 year are on CAGR (Compound Annual Growth Rate) basis. as on 23 Mar 26 Duration Returns 1 Month 0.2% 3 Month 1.1% 6 Month 2.6% 1 Year 6.1% 3 Year 11.3% 5 Year 9.9% 10 Year 15 Year Since launch 8.8% Historical performance (Yearly) on absolute basis
Year Returns 2024 6.6% 2023 12.3% 2022 14.4% 2021 6.7% 2020 10.8% 2019 9.2% 2018 8.6% 2017 6.4% 2016 5.8% 2015 9.6% Fund Manager information for ICICI Prudential Advisor Series - Hybrid Fund
Name Since Tenure Manish Banthia 16 Jun 17 8.71 Yr. Ritesh Lunawat 29 Dec 20 5.17 Yr. Data below for ICICI Prudential Advisor Series - Hybrid Fund as on 28 Feb 26
Asset Allocation
Asset Class Value Cash 49.28% Debt 50.83% Other 0.11% Top Securities Holdings / Portfolio
Name Holding Value Quantity ICICI Pru Equity Arbitrage Dir Gr
Investment Fund | -38% ₹1,075 Cr 279,869,303
↑ 13,048,457 ICICI Pru Corporate Bond Dir Gr
Investment Fund | -25% ₹695 Cr 213,535,889
↑ 4,642,969 ICICI Pru Gilt Dir Gr
Investment Fund | -20% ₹557 Cr 48,736,358
↑ 2,190,137 ICICI Pru Nifty PSU B Pl SDL Dir Gr
Investment Fund | -10% ₹273 Cr 210,043,803
↑ 27,023,890 ICICI Pru Floating Interest Dir Gr
Investment Fund | -4% ₹116 Cr 2,390,491 Net Current Assets
Net Current Assets | -2% ₹60 Cr Treps
CBLO/Reverse Repo | -2% ₹49 Cr 7. HDFC Dynamic PE Ratio Fund of Funds
HDFC Dynamic PE Ratio Fund of Funds
Growth Launch Date 6 Feb 12 NAV (24 Mar 26) ₹40.1795 ↓ -0.01 (-0.02 %) Net Assets (Cr) ₹2,346 on 28 Feb 26 Category Others - Fund of Fund AMC HDFC Asset Management Company Limited Rating ☆☆☆ Risk Moderately High Expense Ratio 0.99 Sharpe Ratio 1.01 Information Ratio 0 Alpha Ratio 0 Min Investment 5,000 Min SIP Investment 300 Exit Load 0-1 Years (1%),1 Years and above(NIL) Growth of 10,000 investment over the years.
Date Value 28 Feb 21 ₹10,000 28 Feb 22 ₹11,350 28 Feb 23 ₹12,365 29 Feb 24 ₹15,714 28 Feb 25 ₹16,280 28 Feb 26 ₹17,622 Returns for HDFC Dynamic PE Ratio Fund of Funds
absolute basis & more than 1 year are on CAGR (Compound Annual Growth Rate) basis. as on 23 Mar 26 Duration Returns 1 Month -0.1% 3 Month 0.7% 6 Month 2.2% 1 Year 5.9% 3 Year 12.5% 5 Year 12% 10 Year 15 Year Since launch 10.3% Historical performance (Yearly) on absolute basis
Year Returns 2024 1.3% 2023 12.9% 2022 22.8% 2021 7.3% 2020 21.6% 2019 14.4% 2018 6% 2017 -2.3% 2016 23.6% 2015 9% Fund Manager information for HDFC Dynamic PE Ratio Fund of Funds
Name Since Tenure Anil Bamboli 27 Jun 14 11.68 Yr. Data below for HDFC Dynamic PE Ratio Fund of Funds as on 28 Feb 26
Asset Allocation
Asset Class Value Cash 46.77% Debt 53.14% Other 0.21% Top Securities Holdings / Portfolio
Name Holding Value Quantity HDFC Corporate Bond Dir Gr
Investment Fund | -45% ₹1,078 Cr 313,648,669
↑ 13,070,876 HDFC Arbitrage Whls Dir Gr
Investment Fund | -36% ₹871 Cr 413,147,450
↑ 18,997,819 HDFC Money Market Dir Gr
Investment Fund | -18% ₹442 Cr 725,464
↑ 24,652 Treps - Tri-Party Repo
CBLO/Reverse Repo | -1% ₹12 Cr Net Current Assets
Net Current Assets | -0% -₹1 Cr
फंड ऑफ फंड्स के लाभ
हर म्यूचुअल फंड की तरह, फंड ऑफ फंड्स के भी कई फायदे हैं। उनमें से कुछ हैं:
1. पोर्टफोलियो विविधीकरण और फंड आवंटन
प्रमुख प्राथमिक लाभों में से एक पोर्टफोलियो विविधीकरण है। यहां, एक ही फंड में निवेश करने के बावजूद, कई म्यूचुअल फंड योजनाओं में निवेश किया जाता है, जहां जोखिम के एक निश्चित स्तर पर अधिकतम रिटर्न अर्जित करने के उद्देश्य से फंड को इष्टतम तरीके से आवंटित किया जाता है।
2. विविध आस्तियों के लिए प्रवेश द्वार
बहु-प्रबंधन निवेश खुदरा निवेशकों को उन फंडों तक पहुंच प्राप्त करने में मदद करता है जो निवेश के लिए आसानी से उपलब्ध नहीं होते हैं। फंड का एक एकल फंड बदले में एक्सपोजर ले सकता हैइक्विटी फ़ंड,डेट फंड या कमोडिटी आधारित म्यूचुअल फंड भी। यह केवल एक म्यूचुअल फंड में शामिल होकर खुदरा निवेशक के लिए विविधीकरण सुनिश्चित करता है।
3. उचित परिश्रम प्रक्रिया
इस श्रेणी के तहत सभी फंडों से फंड मैनेजर द्वारा संचालित एक उचित परिश्रम प्रक्रिया का पालन करने की उम्मीद की जाती है, जहां उन्हें निवेश करने से पहले अंतर्निहित फंड मैनेजरों की पृष्ठभूमि और क्रेडेंशियल्स की जांच करने की आवश्यकता होती है ताकि यह सुनिश्चित हो सके कि रणनीति अपेक्षाओं के अनुरूप है।
4. कम निवेश राशि
यह उन खुदरा निवेशकों के लिए एक अच्छा विकल्प है जो कम टिकट आकार के साथ इस निवेश मार्ग में उद्यम करना चाहते हैं।
फंड का फंड कैसे काम करता है?
बहु-प्रबंधक निवेश कैसे कार्य करता है, इसके तौर-तरीकों को समझने के लिए, बंधन और मुक्त प्रबंधन की अवधारणाओं को समझना महत्वपूर्ण है। फेटेड मैनेजमेंट एक ऐसी स्थिति है जब म्यूचुअल फंड अपने पैसे को एक पोर्टफोलियो में निवेश करता है जिसमें संपत्ति और फंड अपनी कंपनी द्वारा प्रबंधित होते हैं। दूसरे शब्दों में, पैसा उसी परिसंपत्ति प्रबंधन कंपनी के फंड में निवेश किया जाता है। इसके विपरीत, निरंकुश प्रबंधन एक ऐसी स्थिति है जहां म्यूचुअल फंड दूसरे द्वारा प्रबंधित बाहरी फंड में निवेश करता हैसंपत्ति प्रबंधन कंपनियां. निरंकुश फंडों का लाभ बंधुआ फंडों पर होता है क्योंकि वे खुद को एक ही परिवार के फंड तक सीमित रखने के बजाय कई फंडों और अन्य योजनाओं के अवसरों का फायदा उठा सकते हैं।
फंड ऑफ फंड्स क्यों चुनें?
निम्नलिखित छवि स्पष्ट करती है कि कैसे बहु-प्रबंधन निवेश एक साधारण म्यूचुअल फंड के बजाय किसी व्यक्ति को अपने उद्देश्यों को प्राप्त करने में मदद कर सकता है।
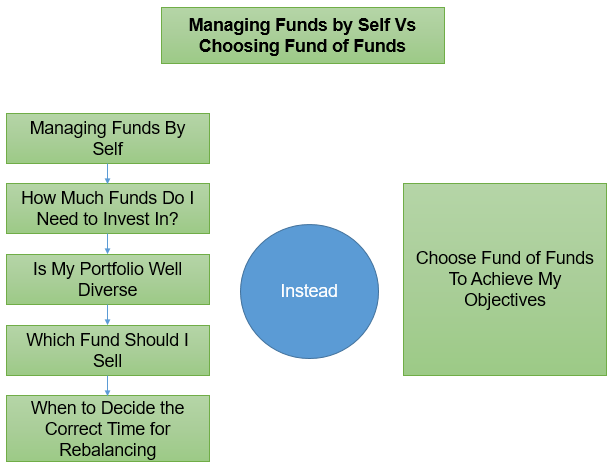
हालांकि बहु-प्रबंधन निवेश से जुड़े बहुत सारे लाभ हैं, लेकिन एक महत्वपूर्ण कारक जिसके बारे में किसी को पता होना चाहिए, वह है इससे जुड़ा शुल्क। निवेशकों को किसी भी शुल्क या खर्च के बारे में पता होना चाहिए जो एक म्यूचुअल फंड आकर्षित करेगा और उसी के अनुसार अपना निवेश करेगा। इसलिए, संक्षेप में, यह निष्कर्ष निकाला जा सकता है कि फंड ऑफ फंड्स उन निवेशकों के लिए एक आदर्श निवेश विकल्प है जो म्यूचुअल फंड में परेशानी मुक्त निवेश का आनंद लेना चाहते हैं।
एफओएफ म्यूचुअल फंड में ऑनलाइन निवेश कैसे करें?
Fincash.com पर आजीवन मुफ्त निवेश खाता खोलें।
अपना पंजीकरण और केवाईसी प्रक्रिया पूरी करें
Upload Documents (PAN, Aadhaar, etc.). और, आप निवेश करने के लिए तैयार हैं!
पूछे जाने वाले प्रश्न
1. एफओएफ का सबसे महत्वपूर्ण लाभ क्या है?
ए: एफओएफ का सबसे महत्वपूर्ण लाभ यह है कि यह आपके निवेश में विविधता लाता है और अच्छा रिटर्न सुनिश्चित करता है। यदि आप अपने निवेश पोर्टफोलियो में विविधता लाने की योजना बना रहे हैं, तो एफओएफ में निवेश करना अच्छा है। यह आपके जोखिम को कम करता है और यह सुनिश्चित करता है कि आप अपने निवेश पर अच्छे रिटर्न का आनंद लें।
2. एफओएफ के विभिन्न प्रकार क्या हैं?
ए: एफओएफ पांच अलग-अलग प्रकार के होते हैं, और ये इस प्रकार हैं:
- एसेट एलोकेशन फंड
- गोल्ड फंड
- अंतर्राष्ट्रीय एफओएफ
- एफओएफ ईटीएफ
- बहु-प्रबंधक एफओएफ
प्रत्येक एफओएफ में अनूठी विशेषताएं हैं। उदाहरण के लिए, गोल्ड फंड में आप निवेश करेंगेगोल्ड ईटीएफ और मल्टी-मैनेजर एफओएफ में आप विभिन्न प्रकार के म्यूचुअल फंड में निवेश करेंगे।
3. एफओएफ में निवेश करते समय किन मापदंडों पर विचार करना चाहिए?
ए: एफओएफ म्यूचुअल फंड हैं, इसलिए, जब आप निवेश करते हैं तो आपको अपनी जोखिम लेने की क्षमता और आप कितना पैसा निवेश करना चाहते हैं, इस पर विचार करना चाहिए। दिए गए समय में आपके द्वारा अपेक्षित रिटर्न का प्रतिशत आपको जोखिम लेने की आपकी क्षमता का अंदाजा देगा। उसके आधार पर, आपको उस पैसे का मूल्यांकन करना चाहिए जिसे आप निवेश करना चाहते हैं। आपकी वित्तीय स्थिति से आपको यह तय करने में भी मदद मिलनी चाहिए कि आपको एफओएफ में कितना पैसा निवेश करना चाहिए।
एक बार जब आप इन दो कारकों का आकलन कर लेते हैं, तो एक विशेष एफओएफ का चयन करें और निवेश करना शुरू करें।
4. किस एफओएफ ने सबसे अच्छा रिटर्न दिखाया है?
ए: गोल्ड एफओएफ को सबसे सुरक्षित निवेशों में से एक माना जाता है। ये गोल्ड ईटीएफ की तरह होते हैं, और जब आपसोने में निवेश करें एफओएफ, यह भुगतान करने जैसे अतिरिक्त मुद्दों के बिना भौतिक सोने में निवेश करने जैसा हैGST,बिक्री कर, या धन कर। यह निवेश सुरक्षित है क्योंकि बाजार की तुलना में सोने की कीमत कभी ज्यादा नहीं गिरती है और इसलिए अच्छा रिटर्न देती है। इस प्रकार, अक्सर गोल्ड एफओएफ को सबसे अच्छे और सबसे सुरक्षित निवेशों में से एक माना जाता है।
5. क्या कोई सामान्य एफओएफ है?
ए: एक्सचेंज ट्रेडेड फंड या ईटीएफ सबसे लोकप्रिय एफओएफ हैं क्योंकि इन फंडों में निवेश करना सबसे आसान है। आपको बस इतना करना है कि खुला है aडीमैट खाता ईटीएफ में व्यापार करने के लिए, और ईटीएफ में आप कितना पैसा निवेश कर सकते हैं, इसकी कोई सीमा नहीं है।
6. एफओएफ की सबसे महत्वपूर्ण सीमाओं में से एक क्या है?
ए: यह कर योग्य है। एक निवेशक के रूप में, जब आप अपना निवेश भुनाते हैं तो आपको मूल राशि पर कर का भुगतान करना होगा। अगर आप छोटी अवधि के लिए एफओएफ में निवेश करते हैं, तो आपको भुगतान करना होगाकरों मूलधन और रिटर्न पर। हालांकि, अर्जित लाभांश कर योग्य नहीं है क्योंकि फंड हाउस करों को वहन करता है।
7. क्या एफओएफ में लंबी लॉक-इन अवधि होती है?
ए: अलग-अलग एफओएफ में अलग-अलग निवेश अवधि होती है। हालांकि, अगर आप अधिकतम रिटर्न अर्जित करना चाहते हैं, तो आपको एफओएफ में काफी लंबे समय के लिए निवेश करना चाहिए।
यहां प्रदान की गई जानकारी सटीक है, यह सुनिश्चित करने के लिए सभी प्रयास किए गए हैं। हालांकि, डेटा की शुद्धता के संबंध में कोई गारंटी नहीं दी जाती है। कृपया कोई भी निवेश करने से पहले योजना सूचना दस्तावेज के साथ सत्यापित करें।


AMFI Registration No. 112358 | CIN: U74999MH2016PTC282153
Shepard Technologies Pvt. Ltd. (with ARN code 112358) makes no warranties or representations, express or implied, on products offered through the platform. It accepts no liability for any damages or losses, however caused, in connection with the use of, or on the reliance of its product or related services. Terms and conditions of the website are applicable.
©2026 Shepard Technologies Private Limited. All Rights Reserved
Research Highlights for PGIM India Euro Equity Fund