 +91-22-48913909
Table of Contents
- టాప్ 11 SIP ఫండ్స్లో ఎందుకు పెట్టుబడి పెట్టాలి?
- SIPలో ఎలా పెట్టుబడి పెట్టాలి?
- భారతదేశంలో FY 22 - 23లో టాప్ 11 SIP మ్యూచువల్ ఫండ్లు
- ఉత్తమ సిస్టమాటిక్ ఇన్వెస్ట్మెంట్ ప్లాన్లలో పెట్టుబడి పెట్టేటప్పుడు పరిగణించవలసిన పారామితులు
- SIP MF ఆన్లైన్లో ఎలా పెట్టుబడి పెట్టాలి?
- తరచుగా అడిగే ప్రశ్నలు
- 1. మ్యూచువల్ ఫండ్స్ అంటే ఏమిటి?
- 2. వివిధ రకాల మ్యూచువల్ ఫండ్స్ ఏమిటి?
- 3. గ్రోత్ ఈక్విటీ ఫండ్స్ అంటే ఏమిటి?
- 4. మీరు డెట్ ఫండ్లో ఎందుకు పెట్టుబడి పెట్టాలి?
- 5. మీరు SIPలలో ఎందుకు పెట్టుబడి పెట్టాలి?
- 6. పన్ను ఆదా చేసే మ్యూచువల్ ఫండ్లో ఎందుకు పెట్టుబడి పెట్టాలి?
- 7. మ్యూచువల్ ఫండ్లలో పెట్టుబడి పెట్టడానికి నాకు బ్రోకర్ అవసరమా?
Top 11 Funds
- ICICI Prudential Infrastructure Fund
- IDFC Infrastructure Fund
- Nippon India Power and Infra Fund
- L&T Emerging Businesses Fund
- HDFC Infrastructure Fund
- Franklin Build India Fund
- DSP BlackRock India T.I.G.E.R Fund
- Franklin India Smaller Companies Fund
- Kotak Small Cap Fund
- IDFC Sterling Value Fund
- Edelweiss Mid Cap Fund
SIP 2022 కోసం 11 ఉత్తమ మ్యూచువల్ ఫండ్లు
SIP మ్యూచువల్ ఫండ్స్ (లేదా టాప్ 11 SIP మ్యూచువల్ ఫండ్లు) అనేది స్టాక్ మార్కెట్లో అనివార్యమైన హెచ్చు తగ్గుల సమయంలో నాడీ విక్రయాలను నివారించడానికి ఆవర్తన పెట్టుబడి యొక్క సాధారణ సూత్రానికి కట్టుబడి ఉండే ఫండ్లు.
సాధారణంగా, SIP లేదా సిస్టమాటిక్పెట్టుబడి ప్రణాళిక మ్యూచువల్ ఫండ్స్లో డబ్బు పెట్టుబడి పెట్టే మోడ్.పెట్టుబడి పెడుతున్నారు టాప్ 11లో SIP మ్యూచువల్ ఫండ్లు మీ పెట్టుబడికి క్రమబద్ధమైన మరియు క్రమశిక్షణతో కూడిన విధానాన్ని అందిస్తాయి. ఇది రోజువారీ మీ పెట్టుబడిని నిర్వహించడానికి మీ ప్రయత్నాన్ని తగ్గిస్తుందిఆధారంగా. అంతేకాకుండా, ఇది పరపతిని అందిస్తుందిసమ్మేళనం యొక్క శక్తి కాలక్రమేణా కావలసిన రాబడికి దారి తీస్తుంది.

భిన్నమైనవి ఉన్నాయిమ్యూచువల్ ఫండ్స్ రకాలు SIP కోసం ఈక్విటీ, డెట్, బ్యాలెన్స్డ్, అల్ట్రా-స్వల్పకాలిక నిధులు, మొదలైనవి అయితే, ఈక్విటీ మ్యూచువల్ ఫండ్లు SIP ద్వారా పెట్టుబడి పెట్టినప్పుడు గరిష్ట రాబడిని అందిస్తాయి. పెట్టుబడిదారులు తప్పనిసరిగా పెట్టుబడి పెట్టాలని ఆర్థిక సలహాదారులు సూచిస్తున్నారుఉత్తమ మ్యూచువల్ ఫండ్స్ SIP కోసం వారి పెట్టుబడి లక్ష్యాలు మరియు వ్యవధిSIP పెట్టుబడి.
టాప్ 11 SIP ఫండ్స్లో ఎందుకు పెట్టుబడి పెట్టాలి?
మ్యూచువల్ ఫండ్స్లో పెట్టుబడి పెట్టడానికి SIPలు క్రమశిక్షణా విధానాన్ని అందిస్తాయి
క్రమబద్ధమైన పెట్టుబడి భవిష్యత్ కలలు మరియు ప్రధాన లక్ష్యాలు- పదవీ విరమణ, పిల్లల కెరీర్, ఇల్లు, కారు లేదా ఏదైనా ఇతర ఆస్తుల కొనుగోలు వంటి వాటికి ఆర్థిక సహాయం చేస్తుంది.
SIPలు సమ్మేళనం యొక్క అత్యంత ప్రయోజనాన్ని పొందడంలో సహాయపడతాయి మరియు యువ పెట్టుబడిదారులకు ఆదర్శంగా ఉంటాయి
సిస్టమాటిక్ ఇన్వెస్ట్మెంట్ ప్లాన్లు ఈక్విటీ హెచ్చుతగ్గుల ప్రమాదాన్ని తగ్గిస్తాయి
SIPలో ఎలా పెట్టుబడి పెట్టాలి?
డబ్బును పెట్టుబడి పెట్టడం ఒక కళ, సరిగ్గా చేస్తే అది అద్భుతాలు చేయగలదు. ఇప్పుడు మీకు తెలుసుటాప్ SIP అందులో ఎలా పెట్టుబడి పెట్టాలో మీరు తప్పక తెలుసుకోవాల్సిన ప్రణాళికలు. మేము క్రింద SIP లో పెట్టుబడి పెట్టడానికి దశలను పేర్కొన్నాము.
1. మీ ఆర్థిక లక్ష్యాలను విశ్లేషించండి
మీకు సరిపోయే SIP పెట్టుబడిని ఎంచుకోండిఆర్థిక లక్ష్యాలు. ఉదాహరణకు, మీ లక్ష్యం స్వల్పకాలికమైనట్లయితే (రాబోయే 2 సంవత్సరాలలో కారు కొనాలనుకుంటే), మీరు డెట్ మ్యూచువల్ ఫండ్లలో పెట్టుబడి పెట్టాలి. మరియు, మీ లక్ష్యం దీర్ఘకాలికంగా ఉంటే (ఇలాపదవీ విరమణ ప్రణాళిక) అప్పుడు ఈక్విటీ మ్యూచువల్ ఫండ్స్లో పెట్టుబడి పెట్టడానికి ఇష్టపడండి.
2. పెట్టుబడి యొక్క కాలక్రమాన్ని ఎంచుకోండి
ఇది మీరు సరైన సమయానికి సరైన మొత్తంలో పెట్టుబడి పెట్టేలా చేస్తుంది.
3. మీరు నెలవారీ పెట్టుబడి పెట్టాలనుకుంటున్న మొత్తాన్ని నిర్ణయించండి
SIP అనేది నెలవారీ పెట్టుబడి కాబట్టి, మీరు లేకుండానే నెలవారీ పెట్టుబడి పెట్టగలిగే మొత్తాన్ని ఎంచుకోవాలివిఫలం. మీరు ఉపయోగించి మీ లక్ష్యం ప్రకారం తగిన మొత్తాన్ని కూడా లెక్కించవచ్చుసిప్ కాలిక్యులేటర్ లేదా SIP రిటర్న్ కాలిక్యులేటర్.
4. ఉత్తమ SIP ప్లాన్ను ఎంచుకోండి
సంప్రదించడం ద్వారా తెలివైన పెట్టుబడి ఎంపిక చేసుకోండి aఆర్థిక సలహాదారు లేదా ఎంచుకోవడం ద్వారాఉత్తమ SIP ప్రణాళికలు వివిధ ఆన్లైన్ పెట్టుబడి ప్లాట్ఫారమ్లు అందిస్తున్నాయి.
Talk to our investment specialist
భారతదేశంలో FY 22 - 23లో టాప్ 11 SIP మ్యూచువల్ ఫండ్లు
To generate capital appreciation and income distribution to unit holders by investing predominantly in equity/equity related securities of the companies belonging to the infrastructure development and balance in debt securities and money market instruments. ICICI Prudential Infrastructure Fund is a Equity - Sectoral fund was launched on 31 Aug 05. It is a fund with High risk and has given a Below is the key information for ICICI Prudential Infrastructure Fund Returns up to 1 year are on The investment objective of the scheme is to seek to generate long-term capital growth through an active diversified portfolio of predominantly equity and equity related instruments of companies that are participating in and benefiting from growth in Indian infrastructure and infrastructural related activities. However, there can be no assurance that the investment objective of the scheme will be realized. IDFC Infrastructure Fund is a Equity - Sectoral fund was launched on 8 Mar 11. It is a fund with High risk and has given a Below is the key information for IDFC Infrastructure Fund Returns up to 1 year are on (Erstwhile Reliance Diversified Power Sector Fund) The primary investment objective of the scheme is to generate long term capital appreciation by investing predominantly in equity and equity related securities of companies in the power sector. Nippon India Power and Infra Fund is a Equity - Sectoral fund was launched on 8 May 04. It is a fund with High risk and has given a Below is the key information for Nippon India Power and Infra Fund Returns up to 1 year are on To generate long-term capital appreciation from a diversified portfolio of predominantly equity and equity related securities, including equity derivatives, in the Indian markets with key theme focus being emerging companies (small cap stocks). The Scheme could also additionally invest in Foreign Securities. L&T Emerging Businesses Fund is a Equity - Small Cap fund was launched on 12 May 14. It is a fund with High risk and has given a Below is the key information for L&T Emerging Businesses Fund Returns up to 1 year are on To seek long-term capital appreciation by investing predominantly in equity and equity related securities of companies engaged in or expected to benefit from growth and development of infrastructure. HDFC Infrastructure Fund is a Equity - Sectoral fund was launched on 10 Mar 08. It is a fund with High risk and has given a Below is the key information for HDFC Infrastructure Fund Returns up to 1 year are on The Scheme seeks to achieve capital appreciation by investing in companies engaged directly or indirectly in infrastructure related activities. Franklin Build India Fund is a Equity - Sectoral fund was launched on 4 Sep 09. It is a fund with High risk and has given a Below is the key information for Franklin Build India Fund Returns up to 1 year are on To generate capital appreciation, from a portfolio that is substantially constituted of equity securities and equity related securities of corporates, which could benefit from structural changes brought about by continuing liberalization in economic policies by the government and/or continuing investments in infrastructure, both by the public and private sector. DSP BlackRock India T.I.G.E.R Fund is a Equity - Sectoral fund was launched on 11 Jun 04. It is a fund with High risk and has given a Below is the key information for DSP BlackRock India T.I.G.E.R Fund Returns up to 1 year are on The Fund seeks to provide long-term capital appreciation by investing in mid and small cap companies. Franklin India Smaller Companies Fund is a Equity - Small Cap fund was launched on 13 Jan 06. It is a fund with Moderately High risk and has given a Below is the key information for Franklin India Smaller Companies Fund Returns up to 1 year are on (Erstwhile Kotak Midcap Scheme) The investment objective of the Scheme is to generate capital appreciation from a diversified portfolio of equity and equity related securities. Kotak Small Cap Fund is a Equity - Small Cap fund was launched on 24 Feb 05. It is a fund with Moderately High risk and has given a Below is the key information for Kotak Small Cap Fund Returns up to 1 year are on (Erstwhile IDFC Sterling Equity Fund) To generate capital appreciation from a diversified portfolio of equity and equity related instruments.It will predominantly invest in small and midcap equity and equity related instruments. Small and Midcap equity & equity related instruments will be the stocks included in the Nifty Free Float Midcap 100 or equity and equity related instruments of such companies which have a market capitalization lower than the highest components of Nifty Free Float Midcap 100. It may also invest in stocks other than mid cap stocks (i.e. in stocks, which have a market capitalisation of above the market capitalisation range of the defined small - midcap stocks) & derivatives. On defensive consideration,It may also invest in debt and money market instruments. In case of discontinuation /suspension of Nifty Free Float Midcap 100, the AMC reserves the right tomodify the definition of Mid cap and Small cap companies. In case of such amodification, the interest of investors will be of paramount importance. IDFC Sterling Value Fund is a Equity - Value fund was launched on 7 Mar 08. It is a fund with Moderately High risk and has given a Below is the key information for IDFC Sterling Value Fund Returns up to 1 year are on (Erstwhile Edelweiss Mid and Small Cap Fund ) The investment objective is to seek to generate long-term capital appreciation from a portfolio that predominantly invests in equity and equity-related securities of Mid Cap companies.
However, there can be no assurance that the investment objective of the Scheme will be realised. Edelweiss Mid Cap Fund is a Equity - Mid Cap fund was launched on 26 Dec 07. It is a fund with High risk and has given a Below is the key information for Edelweiss Mid Cap Fund Returns up to 1 year are on Fund NAV Net Assets (Cr) Min SIP Investment 3 MO (%) 6 MO (%) 1 YR (%) 3 YR (%) 5 YR (%) 2023 (%) ICICI Prudential Infrastructure Fund Growth ₹179.84
↑ 1.67 ₹6,886 100 -0.1 -8.3 6.6 27.4 37.4 27.4 IDFC Infrastructure Fund Growth ₹47.008
↑ 0.57 ₹1,400 100 -4.7 -13.8 4.3 24.7 35 39.3 Nippon India Power and Infra Fund Growth ₹322.789
↑ 3.27 ₹6,125 100 -3.3 -12 2.6 27.2 35 26.9 L&T Emerging Businesses Fund Growth ₹73.438
↑ 0.18 ₹13,334 500 -11.3 -18.5 1.6 16.5 34.3 28.5 HDFC Infrastructure Fund Growth ₹44.53
↑ 0.41 ₹2,105 300 -0.2 -8 5 28.1 33.8 23 Franklin Build India Fund Growth ₹131.372
↑ 1.75 ₹2,406 500 -1.4 -9 5.9 26.7 33.7 27.8 DSP BlackRock India T.I.G.E.R Fund Growth ₹288.087
↑ 1.47 ₹4,465 500 -5.1 -15.9 3.6 24.6 33.6 32.4 Franklin India Smaller Companies Fund Growth ₹156.926
↑ 0.82 ₹11,257 500 -6.8 -14.5 1.4 19.8 33.4 23.2 Kotak Small Cap Fund Growth ₹238.141
↑ 1.51 ₹14,407 1,000 -8.3 -16.7 5.3 12.4 33.1 25.5 IDFC Sterling Value Fund Growth ₹139.892
↑ 1.69 ₹8,996 100 -0.6 -8.6 5.2 15.1 32.9 18 Edelweiss Mid Cap Fund Growth ₹91.107
↑ 0.62 ₹7,729 500 -4.6 -9.5 15.6 21.5 32.8 38.9 Note: Returns up to 1 year are on absolute basis & more than 1 year are on CAGR basis. as on 17 Apr 25 200 కోట్లు మ్యూచువల్ ఫండ్స్ యొక్క ఈక్విటీ కేటగిరీలో 5 సంవత్సరాల క్యాలెండర్ ఇయర్ రిటర్న్స్ ఆధారంగా ఆర్డర్ చేయబడింది.1. ICICI Prudential Infrastructure Fund
CAGR/Annualized return of 15.9% since its launch. Ranked 27 in Sectoral category. Return for 2024 was 27.4% , 2023 was 44.6% and 2022 was 28.8% . ICICI Prudential Infrastructure Fund
Growth Launch Date 31 Aug 05 NAV (17 Apr 25) ₹179.84 ↑ 1.67 (0.94 %) Net Assets (Cr) ₹6,886 on 28 Feb 25 Category Equity - Sectoral AMC ICICI Prudential Asset Management Company Limited Rating ☆☆☆ Risk High Expense Ratio 2.22 Sharpe Ratio -0.25 Information Ratio 0 Alpha Ratio 0 Min Investment 5,000 Min SIP Investment 100 Exit Load 0-1 Years (1%),1 Years and above(NIL) Growth of 10,000 investment over the years.
Date Value 31 Mar 20 ₹10,000 31 Mar 21 ₹18,670 31 Mar 22 ₹25,304 31 Mar 23 ₹30,899 31 Mar 24 ₹50,465 31 Mar 25 ₹54,540 Returns for ICICI Prudential Infrastructure Fund
absolute basis & more than 1 year are on CAGR (Compound Annual Growth Rate) basis. as on 17 Apr 25 Duration Returns 1 Month 7.3% 3 Month -0.1% 6 Month -8.3% 1 Year 6.6% 3 Year 27.4% 5 Year 37.4% 10 Year 15 Year Since launch 15.9% Historical performance (Yearly) on absolute basis
Year Returns 2023 27.4% 2022 44.6% 2021 28.8% 2020 50.1% 2019 3.6% 2018 2.6% 2017 -14% 2016 40.8% 2015 2% 2014 -3.4% Fund Manager information for ICICI Prudential Infrastructure Fund
Name Since Tenure Ihab Dalwai 3 Jun 17 7.75 Yr. Sharmila D’mello 30 Jun 22 2.67 Yr. Data below for ICICI Prudential Infrastructure Fund as on 28 Feb 25
Equity Sector Allocation
Sector Value Industrials 36.49% Basic Materials 21.39% Financial Services 16.91% Utility 8.65% Energy 7.09% Communication Services 1.63% Consumer Cyclical 0.89% Real Estate 0.35% Asset Allocation
Asset Class Value Cash 5.98% Equity 93.39% Debt 0.62% Top Securities Holdings / Portfolio
Name Holding Value Quantity Larsen & Toubro Ltd (Industrials)
Equity, Since 30 Nov 09 | LT9% ₹649 Cr 2,052,790
↑ 126,940 Adani Ports & Special Economic Zone Ltd (Industrials)
Equity, Since 31 May 24 | ADANIPORTS4% ₹288 Cr 2,695,324 Shree Cement Ltd (Basic Materials)
Equity, Since 30 Apr 24 | 5003874% ₹268 Cr 98,408
↓ -10,339 ICICI Bank Ltd (Financial Services)
Equity, Since 31 Dec 16 | ICICIBANK3% ₹240 Cr 1,990,000 NTPC Ltd (Utilities)
Equity, Since 29 Feb 16 | 5325553% ₹226 Cr 7,260,775 HDFC Bank Ltd (Financial Services)
Equity, Since 31 Jan 22 | HDFCBANK3% ₹212 Cr 1,225,000 NCC Ltd (Industrials)
Equity, Since 31 Aug 21 | NCC3% ₹210 Cr 12,006,117
↑ 1,500,000 Reliance Industries Ltd (Energy)
Equity, Since 31 Jul 23 | RELIANCE3% ₹205 Cr 1,709,486
↑ 100,000 Vedanta Ltd (Basic Materials)
Equity, Since 31 Jul 24 | 5002953% ₹194 Cr 4,923,662
↑ 100,000 Cummins India Ltd (Industrials)
Equity, Since 31 May 17 | 5004803% ₹173 Cr 635,000 2. IDFC Infrastructure Fund
CAGR/Annualized return of 11.6% since its launch. Ranked 1 in Sectoral category. Return for 2024 was 39.3% , 2023 was 50.3% and 2022 was 1.7% . IDFC Infrastructure Fund
Growth Launch Date 8 Mar 11 NAV (17 Apr 25) ₹47.008 ↑ 0.57 (1.23 %) Net Assets (Cr) ₹1,400 on 28 Feb 25 Category Equity - Sectoral AMC IDFC Asset Management Company Limited Rating ☆☆☆☆☆ Risk High Expense Ratio 2.33 Sharpe Ratio -0.3 Information Ratio 0 Alpha Ratio 0 Min Investment 5,000 Min SIP Investment 100 Exit Load 0-365 Days (1%),365 Days and above(NIL) Growth of 10,000 investment over the years.
Date Value 31 Mar 20 ₹10,000 31 Mar 21 ₹20,153 31 Mar 22 ₹24,848 31 Mar 23 ₹27,324 31 Mar 24 ₹47,064 31 Mar 25 ₹50,038 Returns for IDFC Infrastructure Fund
absolute basis & more than 1 year are on CAGR (Compound Annual Growth Rate) basis. as on 17 Apr 25 Duration Returns 1 Month 10.1% 3 Month -4.7% 6 Month -13.8% 1 Year 4.3% 3 Year 24.7% 5 Year 35% 10 Year 15 Year Since launch 11.6% Historical performance (Yearly) on absolute basis
Year Returns 2023 39.3% 2022 50.3% 2021 1.7% 2020 64.8% 2019 6.3% 2018 -5.3% 2017 -25.9% 2016 58.7% 2015 10.7% 2014 -0.2% Fund Manager information for IDFC Infrastructure Fund
Name Since Tenure Vishal Biraia 24 Jan 24 1.1 Yr. Ritika Behera 7 Oct 23 1.4 Yr. Gaurav Satra 7 Jun 24 0.73 Yr. Data below for IDFC Infrastructure Fund as on 28 Feb 25
Equity Sector Allocation
Sector Value Industrials 54.7% Utility 13.22% Basic Materials 10.84% Communication Services 4.49% Energy 3.88% Consumer Cyclical 3.46% Financial Services 2.99% Technology 2.07% Health Care 1.9% Asset Allocation
Asset Class Value Cash 2.43% Equity 97.57% Top Securities Holdings / Portfolio
Name Holding Value Quantity Kirloskar Brothers Ltd (Industrials)
Equity, Since 31 Dec 17 | KIRLOSBROS5% ₹71 Cr 443,385 Larsen & Toubro Ltd (Industrials)
Equity, Since 29 Feb 12 | LT4% ₹58 Cr 183,173
↑ 11,726 Reliance Industries Ltd (Energy)
Equity, Since 30 Jun 24 | RELIANCE4% ₹54 Cr 452,706 Bharti Airtel Ltd (Communication Services)
Equity, Since 30 Apr 19 | BHARTIARTL4% ₹52 Cr 330,018
↑ 40,855 UltraTech Cement Ltd (Basic Materials)
Equity, Since 31 Mar 14 | 5325384% ₹51 Cr 50,452
↑ 3,476 GPT Infraprojects Ltd (Industrials)
Equity, Since 30 Nov 17 | GPTINFRA3% ₹45 Cr 4,797,143 Adani Ports & Special Economic Zone Ltd (Industrials)
Equity, Since 31 Dec 23 | ADANIPORTS3% ₹39 Cr 365,137
↓ -69,842 PTC India Financial Services Ltd (Financial Services)
Equity, Since 31 Dec 23 | PFS3% ₹39 Cr 12,400,122 Bharat Electronics Ltd (Industrials)
Equity, Since 31 Oct 19 | BEL3% ₹35 Cr 1,431,700 KEC International Ltd (Industrials)
Equity, Since 30 Jun 24 | 5327143% ₹35 Cr 512,915 3. Nippon India Power and Infra Fund
CAGR/Annualized return of 18% since its launch. Ranked 13 in Sectoral category. Return for 2024 was 26.9% , 2023 was 58% and 2022 was 10.9% . Nippon India Power and Infra Fund
Growth Launch Date 8 May 04 NAV (17 Apr 25) ₹322.789 ↑ 3.27 (1.02 %) Net Assets (Cr) ₹6,125 on 28 Feb 25 Category Equity - Sectoral AMC Nippon Life Asset Management Ltd. Rating ☆☆☆☆ Risk High Expense Ratio 2.05 Sharpe Ratio -0.55 Information Ratio 1.03 Alpha Ratio 1.38 Min Investment 5,000 Min SIP Investment 100 Exit Load 0-1 Years (1%),1 Years and above(NIL) Growth of 10,000 investment over the years.
Date Value 31 Mar 20 ₹10,000 31 Mar 21 ₹18,563 31 Mar 22 ₹23,186 31 Mar 23 ₹26,891 31 Mar 24 ₹47,550 31 Mar 25 ₹48,861 Returns for Nippon India Power and Infra Fund
absolute basis & more than 1 year are on CAGR (Compound Annual Growth Rate) basis. as on 17 Apr 25 Duration Returns 1 Month 8.8% 3 Month -3.3% 6 Month -12% 1 Year 2.6% 3 Year 27.2% 5 Year 35% 10 Year 15 Year Since launch 18% Historical performance (Yearly) on absolute basis
Year Returns 2023 26.9% 2022 58% 2021 10.9% 2020 48.9% 2019 10.8% 2018 -2.9% 2017 -21.1% 2016 61.7% 2015 0.1% 2014 0.3% Fund Manager information for Nippon India Power and Infra Fund
Name Since Tenure Kinjal Desai 25 May 18 6.77 Yr. Rahul Modi 19 Aug 24 0.53 Yr. Data below for Nippon India Power and Infra Fund as on 28 Feb 25
Equity Sector Allocation
Sector Value Industrials 40.77% Utility 19.49% Energy 9.09% Basic Materials 9.08% Communication Services 8.44% Real Estate 3.99% Technology 2.14% Health Care 2.08% Consumer Cyclical 1.96% Financial Services 1.78% Asset Allocation
Asset Class Value Cash 1.18% Equity 98.82% Top Securities Holdings / Portfolio
Name Holding Value Quantity Reliance Industries Ltd (Energy)
Equity, Since 30 Nov 18 | RELIANCE8% ₹480 Cr 4,000,000
↑ 250,000 NTPC Ltd (Utilities)
Equity, Since 31 May 09 | 5325558% ₹480 Cr 15,400,000 Larsen & Toubro Ltd (Industrials)
Equity, Since 30 Nov 07 | LT8% ₹472 Cr 1,492,001 Bharti Airtel Ltd (Communication Services)
Equity, Since 30 Apr 18 | BHARTIARTL7% ₹408 Cr 2,600,000 UltraTech Cement Ltd (Basic Materials)
Equity, Since 31 Oct 19 | 5325384% ₹243 Cr 240,038 Tata Power Co Ltd (Utilities)
Equity, Since 30 Apr 23 | 5004004% ₹237 Cr 6,975,789
↑ 500,000 Kaynes Technology India Ltd (Industrials)
Equity, Since 30 Nov 22 | KAYNES3% ₹176 Cr 423,938 Siemens Ltd (Industrials)
Equity, Since 31 May 21 | 5005503% ₹162 Cr 350,000 CG Power & Industrial Solutions Ltd (Industrials)
Equity, Since 30 Sep 24 | 5000932% ₹151 Cr 2,632,923
↑ 80,000 Carborundum Universal Ltd (Industrials)
Equity, Since 30 Sep 23 | CARBORUNIV2% ₹150 Cr 1,800,000 4. L&T Emerging Businesses Fund
CAGR/Annualized return of 20% since its launch. Ranked 2 in Small Cap category. Return for 2024 was 28.5% , 2023 was 46.1% and 2022 was 1% . L&T Emerging Businesses Fund
Growth Launch Date 12 May 14 NAV (17 Apr 25) ₹73.438 ↑ 0.18 (0.25 %) Net Assets (Cr) ₹13,334 on 28 Feb 25 Category Equity - Small Cap AMC L&T Investment Management Ltd Rating ☆☆☆☆☆ Risk High Expense Ratio 1.73 Sharpe Ratio -0.4 Information Ratio -0.11 Alpha Ratio 1.44 Min Investment 5,000 Min SIP Investment 500 Exit Load 0-1 Years (1%),1 Years and above(NIL) Growth of 10,000 investment over the years.
Date Value 31 Mar 20 ₹10,000 31 Mar 21 ₹20,010 31 Mar 22 ₹29,870 31 Mar 23 ₹31,289 31 Mar 24 ₹46,026 31 Mar 25 ₹48,026 Returns for L&T Emerging Businesses Fund
absolute basis & more than 1 year are on CAGR (Compound Annual Growth Rate) basis. as on 17 Apr 25 Duration Returns 1 Month 7.3% 3 Month -11.3% 6 Month -18.5% 1 Year 1.6% 3 Year 16.5% 5 Year 34.3% 10 Year 15 Year Since launch 20% Historical performance (Yearly) on absolute basis
Year Returns 2023 28.5% 2022 46.1% 2021 1% 2020 77.4% 2019 15.5% 2018 -8.1% 2017 -13.7% 2016 66.5% 2015 10.2% 2014 12.3% Fund Manager information for L&T Emerging Businesses Fund
Name Since Tenure Venugopal Manghat 17 Dec 19 5.21 Yr. Cheenu Gupta 1 Oct 23 1.42 Yr. Sonal Gupta 1 Oct 23 1.42 Yr. Data below for L&T Emerging Businesses Fund as on 28 Feb 25
Equity Sector Allocation
Sector Value Industrials 24.78% Consumer Cyclical 15.58% Financial Services 14.01% Basic Materials 10.75% Technology 9.78% Health Care 5.55% Real Estate 4.98% Consumer Defensive 4.06% Energy 1.26% Asset Allocation
Asset Class Value Cash 6.91% Equity 93.09% Top Securities Holdings / Portfolio
Name Holding Value Quantity Neuland Laboratories Limited
Equity, Since 31 Jan 24 | -2% ₹310 Cr 292,479
↓ -6,521 Aditya Birla Real Estate Ltd (Basic Materials)
Equity, Since 30 Sep 22 | 5000402% ₹297 Cr 1,595,574 Suven Pharmaceuticals Ltd (Healthcare)
Equity, Since 31 Mar 20 | SUVENPHAR2% ₹279 Cr 2,298,085 K.P.R. Mill Ltd (Consumer Cyclical)
Equity, Since 28 Feb 15 | KPRMILL2% ₹263 Cr 3,286,897 BSE Ltd (Financial Services)
Equity, Since 29 Feb 24 | BSE2% ₹257 Cr 555,021
↓ -297,579 Time Technoplast Ltd (Consumer Cyclical)
Equity, Since 31 Jan 24 | TIMETECHNO2% ₹243 Cr 6,810,500 Karur Vysya Bank Ltd (Financial Services)
Equity, Since 31 Oct 22 | 5900032% ₹240 Cr 11,912,400 Brigade Enterprises Ltd (Real Estate)
Equity, Since 31 Jul 19 | 5329292% ₹237 Cr 2,499,622 The Federal Bank Ltd (Financial Services)
Equity, Since 30 Sep 22 | FEDERALBNK2% ₹236 Cr 13,286,579 Sumitomo Chemical India Ltd Ordinary Shares (Basic Materials)
Equity, Since 31 Oct 20 | SUMICHEM2% ₹215 Cr 4,672,221 5. HDFC Infrastructure Fund
CAGR/Annualized return of since its launch. Ranked 26 in Sectoral category. Return for 2024 was 23% , 2023 was 55.4% and 2022 was 19.3% . HDFC Infrastructure Fund
Growth Launch Date 10 Mar 08 NAV (17 Apr 25) ₹44.53 ↑ 0.41 (0.92 %) Net Assets (Cr) ₹2,105 on 28 Feb 25 Category Equity - Sectoral AMC HDFC Asset Management Company Limited Rating ☆☆☆ Risk High Expense Ratio 2.31 Sharpe Ratio -0.55 Information Ratio 0 Alpha Ratio 0 Min Investment 5,000 Min SIP Investment 300 Exit Load 0-1 Years (1%),1 Years and above(NIL) Growth of 10,000 investment over the years.
Date Value 31 Mar 20 ₹10,000 31 Mar 21 ₹17,356 31 Mar 22 ₹21,727 31 Mar 23 ₹25,279 31 Mar 24 ₹45,346 31 Mar 25 ₹47,548 Returns for HDFC Infrastructure Fund
absolute basis & more than 1 year are on CAGR (Compound Annual Growth Rate) basis. as on 17 Apr 25 Duration Returns 1 Month 9.7% 3 Month -0.2% 6 Month -8% 1 Year 5% 3 Year 28.1% 5 Year 33.8% 10 Year 15 Year Since launch Historical performance (Yearly) on absolute basis
Year Returns 2023 23% 2022 55.4% 2021 19.3% 2020 43.2% 2019 -7.5% 2018 -3.4% 2017 -29% 2016 43.3% 2015 -1.9% 2014 -2.5% Fund Manager information for HDFC Infrastructure Fund
Name Since Tenure Srinivasan Ramamurthy 12 Jan 24 1.13 Yr. Dhruv Muchhal 22 Jun 23 1.69 Yr. Data below for HDFC Infrastructure Fund as on 28 Feb 25
Equity Sector Allocation
Sector Value Industrials 38.42% Financial Services 20.62% Basic Materials 10.93% Utility 7.4% Energy 6.96% Communication Services 3.76% Health Care 1.73% Technology 0.98% Real Estate 0.94% Consumer Cyclical 0.58% Asset Allocation
Asset Class Value Cash 6.48% Equity 92.31% Debt 1.21% Top Securities Holdings / Portfolio
Name Holding Value Quantity ICICI Bank Ltd (Financial Services)
Equity, Since 31 Oct 09 | ICICIBANK7% ₹157 Cr 1,300,000 HDFC Bank Ltd (Financial Services)
Equity, Since 31 Aug 23 | HDFCBANK6% ₹121 Cr 700,000 Larsen & Toubro Ltd (Industrials)
Equity, Since 30 Jun 12 | LT6% ₹120 Cr 380,000
↑ 30,000 J Kumar Infraprojects Ltd (Industrials)
Equity, Since 31 Oct 15 | JKIL5% ₹98 Cr 1,450,000
↓ -50,000 NTPC Ltd (Utilities)
Equity, Since 31 Dec 17 | 5325553% ₹69 Cr 2,200,000 InterGlobe Aviation Ltd (Industrials)
Equity, Since 31 Dec 21 | INDIGO3% ₹67 Cr 150,000 Kalpataru Projects International Ltd (Industrials)
Equity, Since 31 Jan 23 | KPIL3% ₹67 Cr 758,285 Coal India Ltd (Energy)
Equity, Since 31 Oct 18 | COALINDIA3% ₹63 Cr 1,700,000 Reliance Industries Ltd (Energy)
Equity, Since 31 May 24 | RELIANCE3% ₹60 Cr 500,000 Bharti Airtel Ltd (Communication Services)
Equity, Since 30 Sep 20 | BHARTIARTL3% ₹55 Cr 350,000
↓ -50,000 6. Franklin Build India Fund
CAGR/Annualized return of 17.9% since its launch. Ranked 4 in Sectoral category. Return for 2024 was 27.8% , 2023 was 51.1% and 2022 was 11.2% . Franklin Build India Fund
Growth Launch Date 4 Sep 09 NAV (17 Apr 25) ₹131.372 ↑ 1.75 (1.35 %) Net Assets (Cr) ₹2,406 on 28 Feb 25 Category Equity - Sectoral AMC Franklin Templeton Asst Mgmt(IND)Pvt Ltd Rating ☆☆☆☆☆ Risk High Expense Ratio 2.13 Sharpe Ratio -0.41 Information Ratio 0 Alpha Ratio 0 Min Investment 5,000 Min SIP Investment 500 Exit Load 0-1 Years (1%),1 Years and above(NIL) Growth of 10,000 investment over the years.
Date Value 31 Mar 20 ₹10,000 31 Mar 21 ₹18,042 31 Mar 22 ₹22,684 31 Mar 23 ₹25,531 31 Mar 24 ₹43,699 31 Mar 25 ₹46,685 Returns for Franklin Build India Fund
absolute basis & more than 1 year are on CAGR (Compound Annual Growth Rate) basis. as on 17 Apr 25 Duration Returns 1 Month 8% 3 Month -1.4% 6 Month -9% 1 Year 5.9% 3 Year 26.7% 5 Year 33.7% 10 Year 15 Year Since launch 17.9% Historical performance (Yearly) on absolute basis
Year Returns 2023 27.8% 2022 51.1% 2021 11.2% 2020 45.9% 2019 5.4% 2018 6% 2017 -10.7% 2016 43.3% 2015 8.4% 2014 2.1% Fund Manager information for Franklin Build India Fund
Name Since Tenure Ajay Argal 18 Oct 21 3.37 Yr. Kiran Sebastian 7 Feb 22 3.06 Yr. Sandeep Manam 18 Oct 21 3.37 Yr. Data below for Franklin Build India Fund as on 28 Feb 25
Equity Sector Allocation
Sector Value Industrials 35.61% Utility 12.65% Financial Services 11.45% Energy 11.44% Communication Services 8.02% Basic Materials 7.35% Real Estate 3.12% Consumer Cyclical 2.86% Technology 1.72% Asset Allocation
Asset Class Value Cash 5.78% Equity 94.22% Top Securities Holdings / Portfolio
Name Holding Value Quantity Larsen & Toubro Ltd (Industrials)
Equity, Since 29 Feb 20 | LT9% ₹228 Cr 720,000 ICICI Bank Ltd (Financial Services)
Equity, Since 31 Mar 12 | ICICIBANK6% ₹144 Cr 1,200,000 InterGlobe Aviation Ltd (Industrials)
Equity, Since 29 Feb 20 | INDIGO6% ₹134 Cr 300,000 NTPC Ltd (Utilities)
Equity, Since 30 Nov 16 | 5325555% ₹128 Cr 4,125,000
↑ 195,000 Reliance Industries Ltd (Energy)
Equity, Since 31 Oct 21 | RELIANCE5% ₹126 Cr 1,050,000 Oil & Natural Gas Corp Ltd (Energy)
Equity, Since 30 Jun 19 | 5003125% ₹113 Cr 5,000,000
↑ 500,000 Bharti Airtel Ltd (Communication Services)
Equity, Since 30 Sep 09 | BHARTIARTL5% ₹111 Cr 710,000 Axis Bank Ltd (Financial Services)
Equity, Since 31 Mar 12 | 5322154% ₹91 Cr 900,000 Power Grid Corp Of India Ltd (Utilities)
Equity, Since 28 Feb 21 | 5328984% ₹84 Cr 3,365,000 Tata Power Co Ltd (Utilities)
Equity, Since 31 Jan 25 | 5004003% ₹68 Cr 2,000,000
↑ 545,843 7. DSP BlackRock India T.I.G.E.R Fund
CAGR/Annualized return of 17.5% since its launch. Ranked 12 in Sectoral category. Return for 2024 was 32.4% , 2023 was 49% and 2022 was 13.9% . DSP BlackRock India T.I.G.E.R Fund
Growth Launch Date 11 Jun 04 NAV (17 Apr 25) ₹288.087 ↑ 1.47 (0.51 %) Net Assets (Cr) ₹4,465 on 28 Feb 25 Category Equity - Sectoral AMC DSP BlackRock Invmt Managers Pvt. Ltd. Rating ☆☆☆☆ Risk High Expense Ratio 2.24 Sharpe Ratio -0.22 Information Ratio 0 Alpha Ratio 0 Min Investment 1,000 Min SIP Investment 500 Exit Load 0-12 Months (1%),12 Months and above(NIL) Growth of 10,000 investment over the years.
Date Value 31 Mar 20 ₹10,000 31 Mar 21 ₹18,218 31 Mar 22 ₹23,467 31 Mar 23 ₹26,460 31 Mar 24 ₹43,618 31 Mar 25 ₹46,898 Returns for DSP BlackRock India T.I.G.E.R Fund
absolute basis & more than 1 year are on CAGR (Compound Annual Growth Rate) basis. as on 17 Apr 25 Duration Returns 1 Month 7.8% 3 Month -5.1% 6 Month -15.9% 1 Year 3.6% 3 Year 24.6% 5 Year 33.6% 10 Year 15 Year Since launch 17.5% Historical performance (Yearly) on absolute basis
Year Returns 2023 32.4% 2022 49% 2021 13.9% 2020 51.6% 2019 2.7% 2018 6.7% 2017 -17.2% 2016 47% 2015 4.1% 2014 0.7% Fund Manager information for DSP BlackRock India T.I.G.E.R Fund
Name Since Tenure Rohit Singhania 21 Jun 10 14.7 Yr. Data below for DSP BlackRock India T.I.G.E.R Fund as on 28 Feb 25
Equity Sector Allocation
Sector Value Industrials 31% Basic Materials 14.85% Consumer Cyclical 7.91% Utility 6.95% Energy 5.73% Financial Services 5.59% Communication Services 3.89% Health Care 3.66% Technology 2.56% Real Estate 1.49% Consumer Defensive 1.45% Asset Allocation
Asset Class Value Cash 14.93% Equity 85.07% Top Securities Holdings / Portfolio
Name Holding Value Quantity NTPC Ltd (Utilities)
Equity, Since 30 Nov 17 | 5325555% ₹223 Cr 7,145,883 Larsen & Toubro Ltd (Industrials)
Equity, Since 30 Jun 04 | LT4% ₹177 Cr 559,286
↓ -32,099 Siemens Ltd (Industrials)
Equity, Since 30 Nov 18 | 5005504% ₹171 Cr 369,482 Bharti Airtel Ltd (Communication Services)
Equity, Since 31 Oct 18 | BHARTIARTL4% ₹170 Cr 1,080,606 Coal India Ltd (Energy)
Equity, Since 31 Dec 23 | COALINDIA3% ₹123 Cr 3,321,453 Kalpataru Projects International Ltd (Industrials)
Equity, Since 31 Jan 22 | KPIL2% ₹92 Cr 1,045,339
↓ -114,092 Apollo Hospitals Enterprise Ltd (Healthcare)
Equity, Since 31 Dec 24 | APOLLOHOSP2% ₹91 Cr 150,959
↑ 19,956 INOX India Ltd (Industrials)
Equity, Since 31 Dec 23 | INOXINDIA2% ₹90 Cr 940,841 Kirloskar Oil Engines Ltd (Industrials)
Equity, Since 31 Mar 23 | KIRLOSENG2% ₹87 Cr 1,502,475 Welspun Corp Ltd (Basic Materials)
Equity, Since 30 Nov 23 | 5321442% ₹83 Cr 1,129,878
↓ -193,415 8. Franklin India Smaller Companies Fund
CAGR/Annualized return of 15.4% since its launch. Ranked 11 in Small Cap category. Return for 2024 was 23.2% , 2023 was 52.1% and 2022 was 3.6% . Franklin India Smaller Companies Fund
Growth Launch Date 13 Jan 06 NAV (17 Apr 25) ₹156.926 ↑ 0.82 (0.53 %) Net Assets (Cr) ₹11,257 on 28 Feb 25 Category Equity - Small Cap AMC Franklin Templeton Asst Mgmt(IND)Pvt Ltd Rating ☆☆☆☆ Risk Moderately High Expense Ratio 1.78 Sharpe Ratio -0.43 Information Ratio 0.28 Alpha Ratio 0.6 Min Investment 5,000 Min SIP Investment 500 Exit Load 0-1 Years (1%),1 Years and above(NIL) Growth of 10,000 investment over the years.
Date Value 31 Mar 20 ₹10,000 31 Mar 21 ₹19,999 31 Mar 22 ₹26,272 31 Mar 23 ₹28,549 31 Mar 24 ₹43,647 31 Mar 25 ₹44,921 Returns for Franklin India Smaller Companies Fund
absolute basis & more than 1 year are on CAGR (Compound Annual Growth Rate) basis. as on 17 Apr 25 Duration Returns 1 Month 8.8% 3 Month -6.8% 6 Month -14.5% 1 Year 1.4% 3 Year 19.8% 5 Year 33.4% 10 Year 15 Year Since launch 15.4% Historical performance (Yearly) on absolute basis
Year Returns 2023 23.2% 2022 52.1% 2021 3.6% 2020 56.4% 2019 18.7% 2018 -5% 2017 -17.4% 2016 43.5% 2015 10.2% 2014 9.6% Fund Manager information for Franklin India Smaller Companies Fund
Name Since Tenure R. Janakiraman 1 Feb 11 14.09 Yr. Sandeep Manam 18 Oct 21 3.37 Yr. Akhil Kalluri 8 Sep 22 2.48 Yr. Data below for Franklin India Smaller Companies Fund as on 28 Feb 25
Equity Sector Allocation
Sector Value Financial Services 19.73% Industrials 19.62% Consumer Cyclical 14.7% Health Care 10.79% Basic Materials 10.23% Technology 4.9% Real Estate 4.7% Consumer Defensive 3.61% Utility 2.57% Energy 0.9% Communication Services 0.05% Asset Allocation
Asset Class Value Cash 6.86% Equity 92.96% Top Securities Holdings / Portfolio
Name Holding Value Quantity Brigade Enterprises Ltd (Real Estate)
Equity, Since 30 Jun 14 | 5329293% ₹366 Cr 3,868,691 Aster DM Healthcare Ltd Ordinary Shares (Healthcare)
Equity, Since 31 Jul 23 | ASTERDM3% ₹323 Cr 8,018,630 Karur Vysya Bank Ltd (Financial Services)
Equity, Since 31 Oct 12 | 5900033% ₹282 Cr 13,998,917
↓ -156,763 Equitas Small Finance Bank Ltd Ordinary Shares (Financial Services)
Equity, Since 31 Oct 20 | EQUITASBNK2% ₹273 Cr 48,064,081 Deepak Nitrite Ltd (Basic Materials)
Equity, Since 31 Jan 16 | DEEPAKNTR2% ₹257 Cr 1,387,967 J.B. Chemicals & Pharmaceuticals Ltd (Healthcare)
Equity, Since 30 Jun 14 | JBCHEPHARM2% ₹238 Cr 1,448,723 Kalyan Jewellers India Ltd (Consumer Cyclical)
Equity, Since 31 May 22 | KALYANKJIL2% ₹229 Cr 4,963,469 Zensar Technologies Ltd (Technology)
Equity, Since 28 Feb 23 | ZENSARTECH2% ₹226 Cr 3,062,700
↓ -200,000 Crompton Greaves Consumer Electricals Ltd (Consumer Cyclical)
Equity, Since 31 Jan 24 | CROMPTON2% ₹222 Cr 6,900,000 Eris Lifesciences Ltd Registered Shs (Healthcare)
Equity, Since 30 Sep 19 | ERIS2% ₹221 Cr 1,866,828 9. Kotak Small Cap Fund
CAGR/Annualized return of 17% since its launch. Ranked 23 in Small Cap category. Return for 2024 was 25.5% , 2023 was 34.8% and 2022 was -3.1% . Kotak Small Cap Fund
Growth Launch Date 24 Feb 05 NAV (17 Apr 25) ₹238.141 ↑ 1.51 (0.64 %) Net Assets (Cr) ₹14,407 on 28 Feb 25 Category Equity - Small Cap AMC Kotak Mahindra Asset Management Co Ltd Rating ☆☆☆ Risk Moderately High Expense Ratio 1.67 Sharpe Ratio -0.22 Information Ratio -0.66 Alpha Ratio 4.91 Min Investment 5,000 Min SIP Investment 1,000 Exit Load 0-1 Years (1%),1 Years and above(NIL) Growth of 10,000 investment over the years.
Date Value 31 Mar 20 ₹10,000 31 Mar 21 ₹22,777 31 Mar 22 ₹31,078 31 Mar 23 ₹29,901 31 Mar 24 ₹41,373 31 Mar 25 ₹44,967 Returns for Kotak Small Cap Fund
absolute basis & more than 1 year are on CAGR (Compound Annual Growth Rate) basis. as on 17 Apr 25 Duration Returns 1 Month 6.8% 3 Month -8.3% 6 Month -16.7% 1 Year 5.3% 3 Year 12.4% 5 Year 33.1% 10 Year 15 Year Since launch 17% Historical performance (Yearly) on absolute basis
Year Returns 2023 25.5% 2022 34.8% 2021 -3.1% 2020 70.9% 2019 34.2% 2018 5% 2017 -17.3% 2016 44% 2015 8.9% 2014 7.4% Fund Manager information for Kotak Small Cap Fund
Name Since Tenure Harish Bihani 20 Oct 23 1.36 Yr. Data below for Kotak Small Cap Fund as on 28 Feb 25
Equity Sector Allocation
Sector Value Industrials 30.46% Consumer Cyclical 21.56% Health Care 19.17% Basic Materials 14.29% Real Estate 4.3% Financial Services 3.6% Consumer Defensive 2.73% Communication Services 2.24% Technology 0.16% Asset Allocation
Asset Class Value Cash 1.51% Equity 98.49% Top Securities Holdings / Portfolio
Name Holding Value Quantity Blue Star Ltd (Industrials)
Equity, Since 31 May 18 | BLUESTARCO3% ₹483 Cr 2,518,929 Century Plyboards (India) Ltd (Basic Materials)
Equity, Since 31 Oct 18 | 5325483% ₹475 Cr 6,590,679
↑ 21,212 Aster DM Healthcare Ltd Ordinary Shares (Healthcare)
Equity, Since 31 Jul 24 | ASTERDM3% ₹474 Cr 11,757,234
↑ 1,712,815 Cyient Ltd (Industrials)
Equity, Since 31 Dec 19 | CYIENT3% ₹453 Cr 3,574,852 Vijaya Diagnostic Centre Ltd (Healthcare)
Equity, Since 31 Mar 24 | 5433503% ₹450 Cr 4,918,037 Krishna Institute of Medical Sciences Ltd (Healthcare)
Equity, Since 31 Dec 23 | 5433083% ₹442 Cr 8,473,425
↑ 376,495 Brigade Enterprises Ltd (Real Estate)
Equity, Since 31 Aug 24 | 5329293% ₹386 Cr 4,078,404
↑ 400,000 Techno Electric & Engineering Co Ltd (Industrials)
Equity, Since 31 Dec 18 | TECHNOE2% ₹360 Cr 3,691,305
↑ 100,000 Garware Technical Fibres Ltd (Consumer Cyclical)
Equity, Since 30 Jun 21 | GARFIBRES2% ₹350 Cr 4,643,002
↑ 7,370 Amber Enterprises India Ltd Ordinary Shares (Consumer Cyclical)
Equity, Since 31 Jan 18 | AMBER2% ₹347 Cr 616,512 10. IDFC Sterling Value Fund
CAGR/Annualized return of 16.7% since its launch. Ranked 21 in Value category. Return for 2024 was 18% , 2023 was 32.6% and 2022 was 3.2% . IDFC Sterling Value Fund
Growth Launch Date 7 Mar 08 NAV (17 Apr 25) ₹139.892 ↑ 1.69 (1.22 %) Net Assets (Cr) ₹8,996 on 28 Feb 25 Category Equity - Value AMC IDFC Asset Management Company Limited Rating ☆☆☆ Risk Moderately High Expense Ratio 1.81 Sharpe Ratio -0.44 Information Ratio 0.75 Alpha Ratio -0.38 Min Investment 5,000 Min SIP Investment 100 Exit Load 0-365 Days (1%),365 Days and above(NIL) Growth of 10,000 investment over the years.
Date Value 31 Mar 20 ₹10,000 31 Mar 21 ₹21,593 31 Mar 22 ₹29,489 31 Mar 23 ₹30,476 31 Mar 24 ₹44,072 31 Mar 25 ₹46,095 Returns for IDFC Sterling Value Fund
absolute basis & more than 1 year are on CAGR (Compound Annual Growth Rate) basis. as on 17 Apr 25 Duration Returns 1 Month 5.6% 3 Month -0.6% 6 Month -8.6% 1 Year 5.2% 3 Year 15.1% 5 Year 32.9% 10 Year 15 Year Since launch 16.7% Historical performance (Yearly) on absolute basis
Year Returns 2023 18% 2022 32.6% 2021 3.2% 2020 64.5% 2019 15.2% 2018 -6.2% 2017 -13% 2016 61.3% 2015 1.1% 2014 -0.3% Fund Manager information for IDFC Sterling Value Fund
Name Since Tenure Daylynn Pinto 20 Oct 16 8.37 Yr. Ritika Behera 7 Oct 23 1.4 Yr. Gaurav Satra 7 Jun 24 0.73 Yr. Data below for IDFC Sterling Value Fund as on 28 Feb 25
Equity Sector Allocation
Sector Value Financial Services 30.38% Consumer Cyclical 10.49% Basic Materials 9.09% Energy 8.05% Technology 7.78% Industrials 7.26% Consumer Defensive 6.91% Health Care 5.72% Utility 2.53% Real Estate 1.64% Asset Allocation
Asset Class Value Cash 6% Equity 94% Top Securities Holdings / Portfolio
Name Holding Value Quantity HDFC Bank Ltd (Financial Services)
Equity, Since 28 Feb 22 | HDFCBANK8% ₹710 Cr 4,100,000 Reliance Industries Ltd (Energy)
Equity, Since 31 Jan 22 | RELIANCE7% ₹600 Cr 5,000,000 Axis Bank Ltd (Financial Services)
Equity, Since 30 Apr 21 | 5322155% ₹457 Cr 4,500,000
↑ 200,000 ICICI Bank Ltd (Financial Services)
Equity, Since 31 Oct 18 | ICICIBANK3% ₹301 Cr 2,500,000
↓ -500,000 Tata Consultancy Services Ltd (Technology)
Equity, Since 31 Oct 21 | TCS3% ₹277 Cr 795,000 Infosys Ltd (Technology)
Equity, Since 30 Sep 23 | INFY3% ₹253 Cr 1,500,000 Jindal Steel & Power Ltd (Basic Materials)
Equity, Since 30 Apr 17 | 5322862% ₹214 Cr 2,500,000 IndusInd Bank Ltd (Financial Services)
Equity, Since 30 Nov 22 | INDUSINDBK2% ₹198 Cr 2,000,000 Kotak Mahindra Bank Ltd (Financial Services)
Equity, Since 31 Jan 25 | KOTAKBANK2% ₹190 Cr 1,000,000
↑ 500,000 Nifty March 2025 Future
- | -2% ₹184 Cr 82,500
↑ 82,500 11. Edelweiss Mid Cap Fund
CAGR/Annualized return of 13.6% since its launch. Ranked 22 in Mid Cap category. Return for 2024 was 38.9% , 2023 was 38.4% and 2022 was 2.4% . Edelweiss Mid Cap Fund
Growth Launch Date 26 Dec 07 NAV (17 Apr 25) ₹91.107 ↑ 0.62 (0.69 %) Net Assets (Cr) ₹7,729 on 28 Feb 25 Category Equity - Mid Cap AMC Edelweiss Asset Management Limited Rating ☆☆☆ Risk High Expense Ratio 1.86 Sharpe Ratio 0.14 Information Ratio 0.18 Alpha Ratio 8.1 Min Investment 5,000 Min SIP Investment 500 Exit Load 0-12 Months (1%),12 Months and above(NIL) Growth of 10,000 investment over the years.
Date Value 31 Mar 20 ₹10,000 31 Mar 21 ₹19,609 31 Mar 22 ₹24,640 31 Mar 23 ₹25,335 31 Mar 24 ₹37,999 31 Mar 25 ₹44,681 Returns for Edelweiss Mid Cap Fund
absolute basis & more than 1 year are on CAGR (Compound Annual Growth Rate) basis. as on 17 Apr 25 Duration Returns 1 Month 7.8% 3 Month -4.6% 6 Month -9.5% 1 Year 15.6% 3 Year 21.5% 5 Year 32.8% 10 Year 15 Year Since launch 13.6% Historical performance (Yearly) on absolute basis
Year Returns 2023 38.9% 2022 38.4% 2021 2.4% 2020 50.3% 2019 26.4% 2018 5.2% 2017 -15.7% 2016 52.3% 2015 2.5% 2014 9.4% Fund Manager information for Edelweiss Mid Cap Fund
Name Since Tenure Dhruv Bhatia 14 Oct 24 0.38 Yr. Trideep Bhattacharya 1 Oct 21 3.42 Yr. Raj Koradia 1 Aug 24 0.58 Yr. Data below for Edelweiss Mid Cap Fund as on 28 Feb 25
Equity Sector Allocation
Sector Value Financial Services 21.93% Consumer Cyclical 18.94% Industrials 12.45% Health Care 11.14% Technology 10.95% Basic Materials 8.55% Consumer Defensive 5.48% Real Estate 3.5% Communication Services 1.87% Utility 0.96% Energy 0.89% Asset Allocation
Asset Class Value Cash 3.35% Equity 96.65% Top Securities Holdings / Portfolio
Name Holding Value Quantity Indian Hotels Co Ltd (Consumer Cyclical)
Equity, Since 30 Sep 23 | 5008504% ₹286 Cr 3,996,756
↑ 811,458 Dixon Technologies (India) Ltd (Technology)
Equity, Since 31 Jan 20 | DIXON4% ₹272 Cr 195,109
↓ -19,441 Persistent Systems Ltd (Technology)
Equity, Since 31 Mar 21 | PERSISTENT3% ₹262 Cr 494,246
↑ 25,367 Max Healthcare Institute Ltd Ordinary Shares (Healthcare)
Equity, Since 31 Jul 21 | MAXHEALTH3% ₹254 Cr 2,594,164
↑ 133,144 Marico Ltd (Consumer Defensive)
Equity, Since 31 Oct 24 | 5316423% ₹235 Cr 3,906,706
↑ 587,858 Coforge Ltd (Technology)
Equity, Since 30 Jun 23 | COFORGE3% ₹208 Cr 282,252
↑ 15,099 PB Fintech Ltd (Financial Services)
Equity, Since 29 Feb 24 | 5433902% ₹190 Cr 1,301,403
↑ 69,623 Solar Industries India Ltd (Basic Materials)
Equity, Since 30 Sep 12 | SOLARINDS2% ₹168 Cr 193,121
↑ 442 Lupin Ltd (Healthcare)
Equity, Since 31 Jul 24 | 5002572% ₹166 Cr 872,147
↓ -268,196 The Federal Bank Ltd (Financial Services)
Equity, Since 31 Dec 18 | FEDERALBNK2% ₹165 Cr 9,288,470
↑ 496,923
పెట్టుబడిదారులు తమకు నచ్చిన SIP ప్లాన్లలో పెట్టుబడి పెట్టాలని సూచించారు. పైన పేర్కొన్న టాప్ 11 మ్యూచువల్ ఫండ్లు అన్ని రకాల పెట్టుబడిదారులకు అనుకూలంగా ఉంటాయి. కాబట్టి, గాని మీరు అధిక-రిస్క్పెట్టుబడిదారుడు లేదా సాపేక్షంగా తక్కువ, ఈ SIP నిధులుపెట్టుబడి పెట్టడానికి ఉత్తమ మ్యూచువల్ ఫండ్స్. కాబట్టి, వేచి ఉండకండి, ఇప్పుడే పెట్టుబడి పెట్టండి!
ఉత్తమ సిస్టమాటిక్ ఇన్వెస్ట్మెంట్ ప్లాన్లలో పెట్టుబడి పెట్టేటప్పుడు పరిగణించవలసిన పారామితులు
అత్యుత్తమ పనితీరు కనబరుస్తున్న SIP ఫండ్లను మూల్యాంకనం చేయడానికి, పెట్టుబడి పెట్టడానికి ముందు తప్పనిసరిగా పరిగణించవలసిన అంశాలను తెలుసుకుందాం.
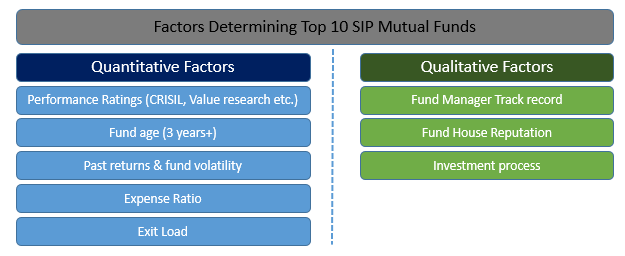
టాప్ SIPలో పెట్టుబడి పెట్టడానికి పరిమాణాత్మక అంశాలు
SIP ద్వారా పెట్టుబడి పెట్టడానికి ముందు తప్పనిసరిగా పరిగణించవలసిన పరిమాణాత్మక కారకాలు పనితీరు రేటింగ్ (CRISIL, వాల్యూ రీసెర్చ్ మొదలైన వాటి ప్రకారం), ఫండ్ వయస్సు, గత రాబడి మరియు ఫండ్ అస్థిరత, ఖర్చు నిష్పత్తి మరియు నిష్క్రమణ లోడ్ ఉన్నాయి.
టాప్ SIPలో పెట్టుబడి పెట్టడానికి గుణాత్మక అంశాలు
విశ్లేషించడానికి గుణాత్మక కీలక గణాంకాలు ఫండ్ మేనేజర్ యొక్క ట్రాక్ రికార్డ్, ఫండ్ హౌస్ యొక్క కీర్తి మరియు SIP ఫండ్ యొక్క పెట్టుబడి ప్రక్రియను కలిగి ఉంటాయి.
SIP MF ఆన్లైన్లో ఎలా పెట్టుబడి పెట్టాలి?
Fincash.comలో జీవితకాలం కోసం ఉచిత పెట్టుబడి ఖాతాను తెరవండి
మీ రిజిస్ట్రేషన్ మరియు KYC ప్రక్రియను పూర్తి చేయండి
పత్రాలను అప్లోడ్ చేయండి (పాన్, ఆధార్, మొదలైనవి).మరియు, మీరు పెట్టుబడి పెట్టడానికి సిద్ధంగా ఉన్నారు!
ఈరోజే SIPతో మీ పెట్టుబడి ప్రయాణాన్ని ప్రారంభించండి!
తరచుగా అడిగే ప్రశ్నలు
1. మ్యూచువల్ ఫండ్స్ అంటే ఏమిటి?
జ: మ్యూచువల్ ఫండ్స్ సిస్టమాటిక్ ఇన్వెస్ట్మెంట్ ప్లాన్ లేదా SIPలలో ఒక భాగం, ఇవి సాధారణంగా తర్వాత అద్భుతమైన రాబడిని అందిస్తాయి. నువ్వు ఎప్పుడుమ్యూచువల్ ఫండ్స్లో పెట్టుబడి పెట్టండి, మీరు మీ పెట్టుబడి పోర్ట్ఫోలియోను వైవిధ్యపరచండి. ఒక మ్యూచువల్ ఫండ్ను ఒక పెట్టుబడి సాధనంగా పరిగణించవచ్చుఅసెట్ మేనేజ్మెంట్ కంపెనీ బహుళ పెట్టుబడిదారులు మరియు కంపెనీల పెట్టుబడులను పూల్ చేయడం ద్వారా.
2. వివిధ రకాల మ్యూచువల్ ఫండ్స్ ఏమిటి?
జ: మ్యూచువల్ ఫండ్లను స్థూలంగా క్రింది రకాలుగా వర్గీకరించవచ్చు:
- ఈక్విటీ లేదా గ్రోత్ ఫండ్స్
- స్థిర ఆదాయ నిధులు లేదారుణ నిధి
- పన్ను ఆదా నిధులు
- లిక్విడ్ ఫండ్స్
- బ్యాలెన్స్డ్ ఫండ్
- గిల్ట్ ఫండ్స్
- ఎక్స్ఛేంజ్-ట్రేడెడ్ ఫండ్స్ లేదాETFలు
3. గ్రోత్ ఈక్విటీ ఫండ్స్ అంటే ఏమిటి?
జ: వృద్ధిఈక్విటీ ఫండ్స్ అత్యంత సాధారణ మ్యూచువల్ ఫండ్స్. అయితే, ఈ పోర్ట్ఫోలియో అస్థిర పెట్టుబడులను కలిగి ఉంటుంది. అయినప్పటికీ, పెట్టుబడిదారులు తరచుగా గ్రోత్ ఈక్విటీ ఫండ్లను ఇష్టపడతారు ఎందుకంటే ఇవి అధిక రాబడిని కలిగి ఉంటాయి మరియు తక్కువ వ్యవధిలో పెట్టుబడి పెట్టవచ్చు.
4. మీరు డెట్ ఫండ్లో ఎందుకు పెట్టుబడి పెట్టాలి?
జ: పెట్టుబడిపై స్థిరమైన రాబడి కోసం చూస్తున్న వ్యక్తులకు ఈ పెట్టుబడులు అనువైనవి. స్థిర ఆదాయాన్ని డిబెంచర్లు, డెట్ సెక్యూరిటీలు, కమర్షియల్ పేపర్లు మరియు ప్రభుత్వ సెక్యూరిటీల నుండి పొందవచ్చు. మ్యూచువల్ ఫండ్స్ వివిధ రకాల పెట్టుబడుల పోర్ట్ఫోలియోను సృష్టిస్తాయి మరియు నష్టాన్ని వెదజల్లుతాయి.
5. మీరు SIPలలో ఎందుకు పెట్టుబడి పెట్టాలి?
జ: SIP లు పెట్టుబడిదారుడికి హామీ ఇవ్వబడిన ఆదాయాన్ని అందించగలవు. మీరు నిష్క్రియ ఆదాయాన్ని సంపాదించడానికి ఆసక్తి కలిగి ఉంటే మరియు మీ పెట్టుబడి సాధారణ ఆదాయాన్ని ఉత్పత్తి చేస్తుందని నిర్ధారించుకోవాలనుకుంటే, మీరు SIPలలో పెట్టుబడి పెట్టడాన్ని పరిగణించవచ్చు. .
6. పన్ను ఆదా చేసే మ్యూచువల్ ఫండ్లో ఎందుకు పెట్టుబడి పెట్టాలి?
జ: మీరు పెరగాలని చూస్తున్నట్లయితే మీరాజధాని మరియు అదే సమయంలో పన్ను మినహాయింపులను ఆస్వాదించాలనుకుంటే, మీరు పన్ను ఆదా చేసే మ్యూచువల్ ఫండ్లో పెట్టుబడి పెట్టవచ్చు. కిందసెక్షన్ 80C యొక్కఆదాయ పన్ను 1861 చట్టం, మీరు ఈక్విటీ-లింక్డ్ టాక్స్ సేవింగ్ మ్యూచువల్ ఫండ్స్లో పెట్టుబడి పెడితే, మీరు మీ పెట్టుబడిపై పన్ను మినహాయింపులను ఆస్వాదించవచ్చు.
7. మ్యూచువల్ ఫండ్లలో పెట్టుబడి పెట్టడానికి నాకు బ్రోకర్ అవసరమా?
జ: పెట్టుబడితో మీకు సహాయం చేయడానికి మీకు బ్రోకర్ లేదా ఆర్థిక సంస్థ మద్దతు అవసరం. తగిన SIPలను గుర్తించడానికి మరియు పెట్టుబడులు సరిగ్గా జరిగాయని నిర్ధారించుకోవడానికి మీకు మద్దతు అవసరం.
ఇక్కడ అందించిన సమాచారం ఖచ్చితమైనదని నిర్ధారించడానికి అన్ని ప్రయత్నాలు చేయబడ్డాయి. అయినప్పటికీ, డేటా యొక్క ఖచ్చితత్వానికి సంబంధించి ఎటువంటి హామీలు ఇవ్వబడవు. దయచేసి ఏదైనా పెట్టుబడి పెట్టే ముందు పథకం సమాచార పత్రంతో ధృవీకరించండి.


AMFI Registration No. 112358 | CIN: U74999MH2016PTC282153
Shepard Technologies Pvt. Ltd. (with ARN code 112358) makes no warranties or representations, express or implied, on products offered through the platform. It accepts no liability for any damages or losses, however caused, in connection with the use of, or on the reliance of its product or related services. Terms and conditions of the website are applicable.
©2025 Shepard Technologies Private Limited. All Rights Reserved