Table of Contents
How to Select Top & Best Mutual Fund?
How to select the best Mutual Fund? This is the question every investor has in mind while Investing their money. Everyone spends time doing a lot of research to get the top performing mutual fund or the best mutual fund to invest in! It is simply the most common yet most difficult question to answer in the Mutual fund Market. Simply put, selecting a best Mutual Fund or to rephrase, a top performing Mutual Fund is like selecting a right partner for any venture. Any wrong decision – on either side – can lead to catastrophic consequences.
One of the most common mistakes in selecting the best mutual fund, that even the seasoned investors do sometimes, is to solely rely on the Mutual Fund Rankings or ratings. It is not that that Mutual Fund ratings are misleading, but there is a lot of further research required. Relying on rankings must not be the sole criteria. One also needs to periodically review the investment made every three months to ensure it is monitored well. Also, if rebalancing is required than one can do this once a year unless otherwise urgently needed.
Before looking into the process of selecting the best Mutual Fund, let’s build our basics. This is an important step that many investors tend to miss out on.
Why are you Making a Mutual Fund Investment?
The first step towards any good investment is to know and understand why are you investing and what are you investing in. You should have a clear objective behind your mutual fund investment. This makes your future decisions easier.
Before investing, you should have a clear idea of your risk appetite. To know what is your risk taking capacity, you must do a Risk assessment or risk profiling. Risk assessment is important before investing as it gives you a clear picture of how much risk you can take. One can use various risk rating methodologies available on the internet or one can visit a financial advisor to do the same.
After undergoing risk profiling, one must turn their attention towards deciding the relevant Asset Allocation. You can decide the mix of assets like equity, debt and other asset classes depending on your risk taking capability. One should choose their asset allocation to match the level of risk they can take or lower than the risk they can take. This will ensure that there is no heartburn or sleepless nights later on. Your asset allocation can be either aggressive (more inclined towards investing in equity), moderate (balanced between equity & debt) or conservative (less investing in equity) depending on your risk profile.
Let’s take a look at a sample asset allocation-
| Aggressive | Moderate | Conservative | |
|---|---|---|---|
| ** Annual Return (p.a.)** | 15.7% | 13.4% | 10.8% |
| Equity | 50% | 35% | 20% |
| Debt | 30% | 40% | 40% |
| Gold | 10% | 10% | 10% |
| Cash | 10% | 15% | 30% |
| Total | 100% | 100% | 100% |
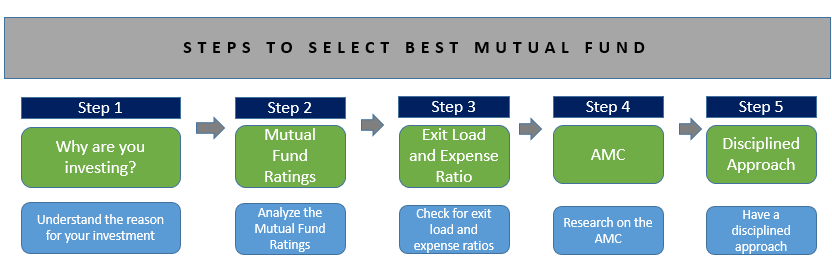
After completing your risk profiling and deciding the asset allocation, selecting the right product is the most important remaining task. Below are the factors that one needs to take into consideration on How to select best mutual fund.
Talk to our investment specialist
How to Select Best Mutual Funds?
As said earlier, selecting the best mutual fund only on the Basis of their ratings may not be sufficient. There are other factors – quantitative and qualitative – that impact the process of selecting the best mutual fund. Let’s have a look at those factors.
Mutual Fund Ratings
Mutual Fund rankings help you in selecting some of the best Mutual Funds in the business at a given point in time. CRISIL, ICRA, MorningStar, etc. are some of the rating agencies. They evaluate a Mutual Fund scheme on various parameters and give out their results. These results help you narrow down your preferences and select the best Mutual Fund.
A thing to note here is that along with the rankings, it is wise to research on the Mutual Fund schemes’ past performances as well. This will only reduce your risk and enhance your returns. Best Performing Mutual Funds like Reliance Mutual Fund, SBI Mutual Fund, UTI Mutual Fund, and many others have been giving out decent to good results in the past.
Expense Ratio
It is very important to check on entry/exit loads and expense ratios while looking for the best Mutual Fund to invest in. Many investors do not consider these recurring costs and suffer in the long run. You must check the expense ratio before investing. High expense ratios affect the schemes’ returns. Though the expense ratios are capped by SEBI, it is generally better to have low expense ratio scheme with high returns. However, always remember, the expense ratio is a relatively small portion, the returns generated or the extra returns generated by a good fund may totally supersede this. It would be penny wise and pound foolish to just select a fund on basis of expense ratio and later on miss out on returns by a good fund. Like with other factors, this needs to be viewed in conjunction with other factors such as ratings, returns etc and then will one be successful in selecting the best mutual fund.
Exit Load
Another thing to consider is the Exit Load. Different types of funds have variable exit loads depending on the nature of the investment. You might be charged with a higher percentage of exit load if you liquidate the scheme before the maturity period. This will obviously affect your Investment plan. This Factor should be taken into consideration to match the investment tenor that one has. This will ensure that there are no exit loads incurring on the investment.
Fund Age
Investing in a fund which has atleast a three-year track record or more is a good idea. This minimum timeframe gives you some data points to actually evaluate the performance of the fund. A New Fund Offer(NFO), maybe recommended and good also, however, there is no track record to the performance of the Mutual Fund scheme. While getting into new products maybe a good idea at times, this should be limited to a small portion of the Portfolio. When investing a large portion of the portfolio, a track record is a must for those products or schemes. For Equity Funds, a three-year track record is a bare minimum, for liquid and ultra-short term funds even a one-year track may suffice (however, this needs to be supplemented with many other factors).
Past Returns and Volatility
Most investors want to invest in the top performing Mutual Fund schemes in the current market scenario. While it may look like a good investment at the time, it may or may not be the best mutual fund or top performing mutual fund in the future. Have a look at the data below from 2011 to 2015 giving the top 5 performing equity funds for each year:
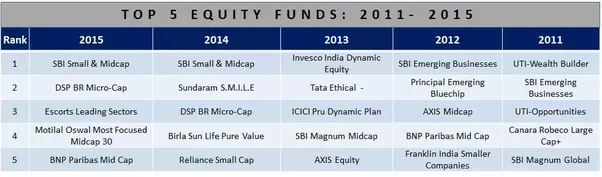
As you can see from the above table, apart from SBI Small & Midcap and BNP mid-cap, all the schemes are different for each year. This means the top performers of the year are not the top performers of the next year! This gives you an idea that what is best now may or may not be the best always in the future. So banking only on the returns while scouting for the best mutual funds is not always a wise move. So while investing, consider a fund that is consistent over a period and less volatile. Also, one should look at many other factors to select the best mutual fund to invest.
Now let’s look at some of the Qualitative Factors on how to select the best mutual fund.
How Invest in Mutual Funds Online?
Open Free Investment Account for Lifetime at Fincash.com.
Complete your Registration and KYC Process
Upload Documents (PAN, Aadhaar, etc.). And, You are Ready to Invest!
Reputation of the Asset Management Company
While one can look at many qualitative factors, one also needs to focus on the fund house Offering the Mutual Fund scheme. A trusted asset management company with a good track record can help you invest smartly and wisely. A good AMC has a variety of investment schemes to provide you with good options for investing. One should look at the age of the fund house, the overall AUM, the track record of management, investment process of the fund house, the number of schemes on offer across categories and also, overall the number of top performing schemes across categories. So choosing a good AMC is also an important step towards choosing the best mutual fund.
| Quantitative Factors | Qualitative Factors |
|---|---|
| Performance Rating (Crisil, ValueResearch,etc) | Fund Manager Track Record |
| Fund Age (3+ years) | Fund House Reputation |
| Past Returns & Fund Volatility | Investment Process |
| Expense Ratio | |
| Exit Load |
Fund Manager Track Record
The fund manager is the professional who handles your money after you invest in a scheme. So, it important to know who is handling your money. You should know their past record and should check whether their investment style suits you. One needs to look at how many years they have been managing money, their track record over the last 5 years (or more) and the number of schemes they manage. Some basic filters here will lead to getting good performing schemes.
Investment Process
Rather than relying on solely the performance of the fund manager, one should ensure that there is an investment process in place. You don't want to get into a product with key-man risk. If there is an institutionalised investment process in place, this will ensure the scheme is managed well. Even there is a fund manager change. then your investment will be protected.
Monitor & Review: Have a Disciplined Approach
If you will consider all the above factors, you might get a best Mutual Fund or top mutual fund for yourself. But to get the best out of that best Mutual Fund, you need to have a disciplined approach and monitor the investment or scheme. Markets are volatile and your investment may see its value going up & down. You must trust the research and efforts taken in selecting the Mutual Fund and avoid falling prey to short-term losses (especially in equity). Simply put, if you feel you have erred in selecting the best mutual fund, you should take action and change the fund. However, a change should not be done before giving adequate time to perform to the earlier "best mutual fund". One should do re-balancing, not before one year. Always remember, even the best of investors (even Warren Buffet) make investment mistakes, however, we should get more right decisions than wrong ones in the long run. This will ensure that our portfolio or even the best mutual funds perform over time.
Best Mutual Funds to Invest 2025 - 2026
Fund NAV Net Assets (Cr) 3 MO (%) 6 MO (%) 1 YR (%) 3 YR (%) 5 YR (%) 2023 (%) SBI PSU Fund Growth ₹31.2291
↓ -0.03 ₹4,789 6.1 -0.8 4.3 30.6 31.3 23.5 Franklin India Opportunities Fund Growth ₹238.572
↓ -0.63 ₹6,047 0.8 -2.4 13.3 29.4 32.5 37.3 Invesco India PSU Equity Fund Growth ₹59.89
↓ -0.16 ₹1,217 5 -3.8 5 28.8 29.1 25.6 HDFC Infrastructure Fund Growth ₹45.116
↓ -0.08 ₹2,329 3 -4.2 4.3 28.5 35.2 23 Nippon India Power and Infra Fund Growth ₹328.688
↓ -1.06 ₹6,849 1.3 -6 2.9 28.2 35.7 26.9 ICICI Prudential Infrastructure Fund Growth ₹182.84
↑ 0.07 ₹7,214 2.6 -3.8 7.1 28.1 38.9 27.4 Franklin Build India Fund Growth ₹133.79
↓ -0.54 ₹2,642 2.6 -4.1 6.2 27.9 35.1 27.8 Motilal Oswal Midcap 30 Fund Growth ₹93.7774
↓ -0.75 ₹26,028 -4.3 -10.9 14.9 27 36.9 57.1 IDFC Infrastructure Fund Growth ₹48.021
↓ -0.02 ₹1,563 0.9 -6.6 5.3 25.9 36.1 39.3 Canara Robeco Infrastructure Growth ₹149.52
↓ -0.37 ₹815 2.6 -5.9 12.8 25.6 33.4 35.3 Note: Returns up to 1 year are on absolute basis & more than 1 year are on CAGR basis. as on 24 Apr 25
*Below is the detailed list of Top Mutual Funds based on past 3 year CAGR returns.
The objective of the scheme would be to provide investors with opportunities for long-term growth in capital along with the liquidity of an open-ended scheme through an active management of investments in a diversified basket of equity stocks of domestic Public Sector Undertakings and in debt and money market instruments issued by PSUs AND others. SBI PSU Fund is a Equity - Sectoral fund was launched on 7 Jul 10. It is a fund with High risk and has given a Below is the key information for SBI PSU Fund Returns up to 1 year are on The investment objective of Franklin India Opportunities Fund (FIOF) is to generate capital appreciation by capitalizing on the long-term growth opportunities in the Indian economy. Franklin India Opportunities Fund is a Equity - Sectoral fund was launched on 21 Feb 00. It is a fund with Moderately High risk and has given a Below is the key information for Franklin India Opportunities Fund Returns up to 1 year are on To generate capital appreciation by investing in Equity and Equity Related Instruments of companies where the Central / State Government(s) has majority shareholding or management control or has powers to appoint majority of directors. However, there is no assurance or guarantee that the investment objective of the Scheme will be achieved. The Scheme does not assure or guarantee any returns. Invesco India PSU Equity Fund is a Equity - Sectoral fund was launched on 18 Nov 09. It is a fund with High risk and has given a Below is the key information for Invesco India PSU Equity Fund Returns up to 1 year are on To seek long-term capital appreciation by investing predominantly in equity and equity related securities of companies engaged in or expected to benefit from growth and development of infrastructure. HDFC Infrastructure Fund is a Equity - Sectoral fund was launched on 10 Mar 08. It is a fund with High risk and has given a Below is the key information for HDFC Infrastructure Fund Returns up to 1 year are on (Erstwhile Reliance Diversified Power Sector Fund) The primary investment objective of the scheme is to generate long term capital appreciation by investing predominantly in equity and equity related securities of companies in the power sector. Nippon India Power and Infra Fund is a Equity - Sectoral fund was launched on 8 May 04. It is a fund with High risk and has given a Below is the key information for Nippon India Power and Infra Fund Returns up to 1 year are on To generate capital appreciation and income distribution to unit holders by investing predominantly in equity/equity related securities of the companies belonging to the infrastructure development and balance in debt securities and money market instruments. ICICI Prudential Infrastructure Fund is a Equity - Sectoral fund was launched on 31 Aug 05. It is a fund with High risk and has given a Below is the key information for ICICI Prudential Infrastructure Fund Returns up to 1 year are on The Scheme seeks to achieve capital appreciation by investing in companies engaged directly or indirectly in infrastructure related activities. Franklin Build India Fund is a Equity - Sectoral fund was launched on 4 Sep 09. It is a fund with High risk and has given a Below is the key information for Franklin Build India Fund Returns up to 1 year are on (Erstwhile Motilal Oswal MOSt Focused Midcap 30 Fund) The investment objective of the Scheme is to achieve long term capital appreciation by investing in a maximum of 30 quality mid-cap companies having long-term competitive advantages and potential for growth. However, there can be no assurance or guarantee that the investment objective of the Scheme would be achieved. Motilal Oswal Midcap 30 Fund is a Equity - Mid Cap fund was launched on 24 Feb 14. It is a fund with Moderately High risk and has given a Below is the key information for Motilal Oswal Midcap 30 Fund Returns up to 1 year are on The investment objective of the scheme is to seek to generate long-term capital growth through an active diversified portfolio of predominantly equity and equity related instruments of companies that are participating in and benefiting from growth in Indian infrastructure and infrastructural related activities. However, there can be no assurance that the investment objective of the scheme will be realized. IDFC Infrastructure Fund is a Equity - Sectoral fund was launched on 8 Mar 11. It is a fund with High risk and has given a Below is the key information for IDFC Infrastructure Fund Returns up to 1 year are on T o g e n e r a t e income/capital appreciation by investing in equities and equity related instruments of companies in the infrastructure sector. However, there can be no assurance that the investment objective of the scheme will be realized. Canara Robeco Infrastructure is a Equity - Sectoral fund was launched on 2 Dec 05. It is a fund with High risk and has given a Below is the key information for Canara Robeco Infrastructure Returns up to 1 year are on 1. SBI PSU Fund
CAGR/Annualized return of 8% since its launch. Ranked 31 in Sectoral category. Return for 2024 was 23.5% , 2023 was 54% and 2022 was 29% . SBI PSU Fund
Growth Launch Date 7 Jul 10 NAV (24 Apr 25) ₹31.2291 ↓ -0.03 (-0.09 %) Net Assets (Cr) ₹4,789 on 31 Mar 25 Category Equity - Sectoral AMC SBI Funds Management Private Limited Rating ☆☆ Risk High Expense Ratio 2.3 Sharpe Ratio 0.07 Information Ratio -0.23 Alpha Ratio 3.14 Min Investment 5,000 Min SIP Investment 500 Exit Load 0-1 Years (1%),1 Years and above(NIL) Growth of 10,000 investment over the years.
Date Value 31 Mar 20 ₹10,000 31 Mar 21 ₹13,883 31 Mar 22 ₹17,382 31 Mar 23 ₹19,831 31 Mar 24 ₹37,078 31 Mar 25 ₹39,285 Returns for SBI PSU Fund
absolute basis & more than 1 year are on CAGR (Compound Annual Growth Rate) basis. as on 24 Apr 25 Duration Returns 1 Month 5.8% 3 Month 6.1% 6 Month -0.8% 1 Year 4.3% 3 Year 30.6% 5 Year 31.3% 10 Year 15 Year Since launch 8% Historical performance (Yearly) on absolute basis
Year Returns 2023 23.5% 2022 54% 2021 29% 2020 32.4% 2019 -10% 2018 6% 2017 -23.8% 2016 21.9% 2015 16.2% 2014 -11.1% Fund Manager information for SBI PSU Fund
Name Since Tenure Rohit Shimpi 1 Jun 24 0.75 Yr. Data below for SBI PSU Fund as on 31 Mar 25
Equity Sector Allocation
Sector Value Financial Services 35.9% Utility 24.13% Energy 17.02% Industrials 10.67% Basic Materials 6.34% Asset Allocation
Asset Class Value Cash 5.81% Equity 94.07% Debt 0.12% Top Securities Holdings / Portfolio
Name Holding Value Quantity State Bank of India (Financial Services)
Equity, Since 31 Jul 10 | SBIN14% ₹591 Cr 8,577,500 GAIL (India) Ltd (Utilities)
Equity, Since 31 May 24 | 5321559% ₹380 Cr 24,350,000 Power Grid Corp Of India Ltd (Utilities)
Equity, Since 31 Jul 10 | 5328989% ₹380 Cr 15,135,554
↑ 950,000 Bharat Electronics Ltd (Industrials)
Equity, Since 30 Jun 24 | BEL8% ₹334 Cr 13,575,000
↑ 800,000 Bharat Petroleum Corp Ltd (Energy)
Equity, Since 31 Aug 24 | 5005476% ₹230 Cr 9,700,000 NMDC Ltd (Basic Materials)
Equity, Since 31 Oct 23 | 5263714% ₹174 Cr 27,900,000 NTPC Ltd (Utilities)
Equity, Since 31 Jul 10 | 5325554% ₹170 Cr 5,443,244 Bank of Baroda (Financial Services)
Equity, Since 31 Aug 24 | 5321344% ₹154 Cr 7,800,000 General Insurance Corp of India (Financial Services)
Equity, Since 31 May 24 | GICRE4% ₹153 Cr 4,150,000
↑ 550,000 SBI Cards and Payment Services Ltd Ordinary Shares (Financial Services)
Equity, Since 31 Oct 24 | SBICARD3% ₹138 Cr 1,650,000 2. Franklin India Opportunities Fund
CAGR/Annualized return of 13.4% since its launch. Ranked 47 in Sectoral category. Return for 2024 was 37.3% , 2023 was 53.6% and 2022 was -1.9% . Franklin India Opportunities Fund
Growth Launch Date 21 Feb 00 NAV (24 Apr 25) ₹238.572 ↓ -0.63 (-0.26 %) Net Assets (Cr) ₹6,047 on 31 Mar 25 Category Equity - Sectoral AMC Franklin Templeton Asst Mgmt(IND)Pvt Ltd Rating ☆☆☆ Risk Moderately High Expense Ratio 2.12 Sharpe Ratio 0.46 Information Ratio 1.68 Alpha Ratio 8.45 Min Investment 5,000 Min SIP Investment 500 Exit Load 0-1 Years (1%),1 Years and above(NIL) Growth of 10,000 investment over the years.
Date Value 31 Mar 20 ₹10,000 31 Mar 21 ₹18,903 31 Mar 22 ₹21,132 31 Mar 23 ₹23,026 31 Mar 24 ₹37,539 31 Mar 25 ₹43,201 Returns for Franklin India Opportunities Fund
absolute basis & more than 1 year are on CAGR (Compound Annual Growth Rate) basis. as on 24 Apr 25 Duration Returns 1 Month 5% 3 Month 0.8% 6 Month -2.4% 1 Year 13.3% 3 Year 29.4% 5 Year 32.5% 10 Year 15 Year Since launch 13.4% Historical performance (Yearly) on absolute basis
Year Returns 2023 37.3% 2022 53.6% 2021 -1.9% 2020 29.7% 2019 27.3% 2018 5.4% 2017 -10.1% 2016 35.6% 2015 4.2% 2014 2.3% Fund Manager information for Franklin India Opportunities Fund
Name Since Tenure Kiran Sebastian 7 Feb 22 3.06 Yr. R. Janakiraman 1 Apr 13 11.92 Yr. Sandeep Manam 18 Oct 21 3.37 Yr. Data below for Franklin India Opportunities Fund as on 31 Mar 25
Equity Sector Allocation
Sector Value Consumer Cyclical 19.47% Financial Services 13.37% Health Care 11.56% Communication Services 9.09% Basic Materials 8.49% Technology 7.97% Industrials 6.9% Energy 4.32% Consumer Defensive 3.74% Real Estate 2.22% Utility 1.37% Asset Allocation
Asset Class Value Cash 8.98% Equity 91.02% Top Securities Holdings / Portfolio
Name Holding Value Quantity HDFC Bank Ltd (Financial Services)
Equity, Since 31 May 24 | HDFCBANK5% ₹301 Cr 1,735,296
↑ 676,365 Reliance Industries Ltd (Energy)
Equity, Since 30 Apr 22 | RELIANCE4% ₹238 Cr 1,987,098 Bharti Airtel Ltd (Communication Services)
Equity, Since 31 Jan 24 | BHARTIARTL4% ₹211 Cr 1,342,233 Mahindra & Mahindra Ltd (Consumer Cyclical)
Equity, Since 31 May 24 | M&M3% ₹165 Cr 637,966 Mphasis Ltd (Technology)
Equity, Since 30 Nov 24 | 5262993% ₹160 Cr 710,533 Lemon Tree Hotels Ltd (Consumer Cyclical)
Equity, Since 31 Aug 24 | LEMONTREE3% ₹156 Cr 12,833,401 Info Edge (India) Ltd (Communication Services)
Equity, Since 31 Jul 24 | NAUKRI3% ₹151 Cr 216,138 APL Apollo Tubes Ltd (Basic Materials)
Equity, Since 31 Oct 24 | APLAPOLLO3% ₹144 Cr 998,385 Zomato Ltd (Consumer Cyclical)
Equity, Since 31 Aug 23 | 5433203% ₹142 Cr 6,398,413 CE Info Systems Ltd (Technology)
Equity, Since 31 Mar 24 | 5434253% ₹139 Cr 835,883
↑ 76,164 3. Invesco India PSU Equity Fund
CAGR/Annualized return of 12.3% since its launch. Ranked 33 in Sectoral category. Return for 2024 was 25.6% , 2023 was 54.5% and 2022 was 20.5% . Invesco India PSU Equity Fund
Growth Launch Date 18 Nov 09 NAV (24 Apr 25) ₹59.89 ↓ -0.16 (-0.27 %) Net Assets (Cr) ₹1,217 on 31 Mar 25 Category Equity - Sectoral AMC Invesco Asset Management (India) Private Ltd Rating ☆☆☆ Risk High Expense Ratio 2.39 Sharpe Ratio 0.06 Information Ratio -0.47 Alpha Ratio 3.27 Min Investment 5,000 Min SIP Investment 500 Exit Load 0-1 Years (1%),1 Years and above(NIL) Growth of 10,000 investment over the years.
Date Value 31 Mar 20 ₹10,000 31 Mar 21 ₹14,149 31 Mar 22 ₹17,370 31 Mar 23 ₹19,711 31 Mar 24 ₹36,141 31 Mar 25 ₹37,811 Returns for Invesco India PSU Equity Fund
absolute basis & more than 1 year are on CAGR (Compound Annual Growth Rate) basis. as on 24 Apr 25 Duration Returns 1 Month 6.1% 3 Month 5% 6 Month -3.8% 1 Year 5% 3 Year 28.8% 5 Year 29.1% 10 Year 15 Year Since launch 12.3% Historical performance (Yearly) on absolute basis
Year Returns 2023 25.6% 2022 54.5% 2021 20.5% 2020 31.1% 2019 6.1% 2018 10.1% 2017 -16.9% 2016 24.3% 2015 17.9% 2014 2.5% Fund Manager information for Invesco India PSU Equity Fund
Name Since Tenure Dhimant Kothari 19 May 20 4.79 Yr. Data below for Invesco India PSU Equity Fund as on 31 Mar 25
Equity Sector Allocation
Sector Value Industrials 27.81% Utility 24.59% Financial Services 21.69% Energy 18.38% Basic Materials 6.48% Asset Allocation
Asset Class Value Cash 1.06% Equity 98.94% Top Securities Holdings / Portfolio
Name Holding Value Quantity Bharat Electronics Ltd (Industrials)
Equity, Since 31 Mar 17 | BEL9% ₹96 Cr 3,894,619 Power Grid Corp Of India Ltd (Utilities)
Equity, Since 28 Feb 22 | 5328989% ₹90 Cr 3,599,413 State Bank of India (Financial Services)
Equity, Since 28 Feb 21 | SBIN8% ₹86 Cr 1,251,543 Bharat Petroleum Corp Ltd (Energy)
Equity, Since 30 Sep 18 | 5005478% ₹82 Cr 3,445,961 Oil & Natural Gas Corp Ltd (Energy)
Equity, Since 31 Aug 24 | 5003126% ₹65 Cr 2,868,783 Hindustan Aeronautics Ltd Ordinary Shares (Industrials)
Equity, Since 31 May 22 | HAL5% ₹54 Cr 175,355
↑ 22,180 NTPC Green Energy Ltd (Utilities)
Equity, Since 30 Nov 24 | NTPCGREEN5% ₹52 Cr 5,911,723 NTPC Ltd (Utilities)
Equity, Since 31 May 19 | 5325555% ₹49 Cr 1,570,631 National Aluminium Co Ltd (Basic Materials)
Equity, Since 31 Aug 24 | 5322344% ₹46 Cr 2,604,332 Hindustan Petroleum Corp Ltd (Energy)
Equity, Since 30 Nov 23 | HINDPETRO4% ₹46 Cr 1,564,169 4. HDFC Infrastructure Fund
CAGR/Annualized return of since its launch. Ranked 26 in Sectoral category. Return for 2024 was 23% , 2023 was 55.4% and 2022 was 19.3% . HDFC Infrastructure Fund
Growth Launch Date 10 Mar 08 NAV (24 Apr 25) ₹45.116 ↓ -0.08 (-0.17 %) Net Assets (Cr) ₹2,329 on 31 Mar 25 Category Equity - Sectoral AMC HDFC Asset Management Company Limited Rating ☆☆☆ Risk High Expense Ratio 2.31 Sharpe Ratio -0.01 Information Ratio 0 Alpha Ratio 0 Min Investment 5,000 Min SIP Investment 300 Exit Load 0-1 Years (1%),1 Years and above(NIL) Growth of 10,000 investment over the years.
Date Value 31 Mar 20 ₹10,000 31 Mar 21 ₹17,356 31 Mar 22 ₹21,727 31 Mar 23 ₹25,279 31 Mar 24 ₹45,346 31 Mar 25 ₹47,548 Returns for HDFC Infrastructure Fund
absolute basis & more than 1 year are on CAGR (Compound Annual Growth Rate) basis. as on 24 Apr 25 Duration Returns 1 Month 5% 3 Month 3% 6 Month -4.2% 1 Year 4.3% 3 Year 28.5% 5 Year 35.2% 10 Year 15 Year Since launch Historical performance (Yearly) on absolute basis
Year Returns 2023 23% 2022 55.4% 2021 19.3% 2020 43.2% 2019 -7.5% 2018 -3.4% 2017 -29% 2016 43.3% 2015 -1.9% 2014 -2.5% Fund Manager information for HDFC Infrastructure Fund
Name Since Tenure Srinivasan Ramamurthy 12 Jan 24 1.13 Yr. Dhruv Muchhal 22 Jun 23 1.69 Yr. Data below for HDFC Infrastructure Fund as on 31 Mar 25
Equity Sector Allocation
Sector Value Industrials 38.42% Financial Services 20.62% Basic Materials 10.93% Utility 7.4% Energy 6.96% Communication Services 3.76% Health Care 1.73% Technology 0.98% Real Estate 0.94% Consumer Cyclical 0.58% Asset Allocation
Asset Class Value Cash 6.48% Equity 92.31% Debt 1.21% Top Securities Holdings / Portfolio
Name Holding Value Quantity ICICI Bank Ltd (Financial Services)
Equity, Since 31 Oct 09 | ICICIBANK7% ₹157 Cr 1,300,000 HDFC Bank Ltd (Financial Services)
Equity, Since 31 Aug 23 | HDFCBANK6% ₹121 Cr 700,000 Larsen & Toubro Ltd (Industrials)
Equity, Since 30 Jun 12 | LT6% ₹120 Cr 380,000
↑ 30,000 J Kumar Infraprojects Ltd (Industrials)
Equity, Since 31 Oct 15 | JKIL5% ₹98 Cr 1,450,000
↓ -50,000 NTPC Ltd (Utilities)
Equity, Since 31 Dec 17 | 5325553% ₹69 Cr 2,200,000 InterGlobe Aviation Ltd (Industrials)
Equity, Since 31 Dec 21 | INDIGO3% ₹67 Cr 150,000 Kalpataru Projects International Ltd (Industrials)
Equity, Since 31 Jan 23 | KPIL3% ₹67 Cr 758,285 Coal India Ltd (Energy)
Equity, Since 31 Oct 18 | COALINDIA3% ₹63 Cr 1,700,000 Reliance Industries Ltd (Energy)
Equity, Since 31 May 24 | RELIANCE3% ₹60 Cr 500,000 Bharti Airtel Ltd (Communication Services)
Equity, Since 30 Sep 20 | BHARTIARTL3% ₹55 Cr 350,000
↓ -50,000 5. Nippon India Power and Infra Fund
CAGR/Annualized return of 18.2% since its launch. Ranked 13 in Sectoral category. Return for 2024 was 26.9% , 2023 was 58% and 2022 was 10.9% . Nippon India Power and Infra Fund
Growth Launch Date 8 May 04 NAV (24 Apr 25) ₹328.688 ↓ -1.06 (-0.32 %) Net Assets (Cr) ₹6,849 on 31 Mar 25 Category Equity - Sectoral AMC Nippon Life Asset Management Ltd. Rating ☆☆☆☆ Risk High Expense Ratio 2.05 Sharpe Ratio -0.05 Information Ratio 1.15 Alpha Ratio 2.34 Min Investment 5,000 Min SIP Investment 100 Exit Load 0-1 Years (1%),1 Years and above(NIL) Growth of 10,000 investment over the years.
Date Value 31 Mar 20 ₹10,000 31 Mar 21 ₹18,563 31 Mar 22 ₹23,186 31 Mar 23 ₹26,891 31 Mar 24 ₹47,550 31 Mar 25 ₹48,861 Returns for Nippon India Power and Infra Fund
absolute basis & more than 1 year are on CAGR (Compound Annual Growth Rate) basis. as on 24 Apr 25 Duration Returns 1 Month 4.4% 3 Month 1.3% 6 Month -6% 1 Year 2.9% 3 Year 28.2% 5 Year 35.7% 10 Year 15 Year Since launch 18.2% Historical performance (Yearly) on absolute basis
Year Returns 2023 26.9% 2022 58% 2021 10.9% 2020 48.9% 2019 10.8% 2018 -2.9% 2017 -21.1% 2016 61.7% 2015 0.1% 2014 0.3% Fund Manager information for Nippon India Power and Infra Fund
Name Since Tenure Kinjal Desai 25 May 18 6.77 Yr. Rahul Modi 19 Aug 24 0.53 Yr. Data below for Nippon India Power and Infra Fund as on 31 Mar 25
Equity Sector Allocation
Sector Value Industrials 40.77% Utility 19.49% Energy 9.09% Basic Materials 9.08% Communication Services 8.44% Real Estate 3.99% Technology 2.14% Health Care 2.08% Consumer Cyclical 1.96% Financial Services 1.78% Asset Allocation
Asset Class Value Cash 1.18% Equity 98.82% Top Securities Holdings / Portfolio
Name Holding Value Quantity Reliance Industries Ltd (Energy)
Equity, Since 30 Nov 18 | RELIANCE8% ₹480 Cr 4,000,000
↑ 250,000 NTPC Ltd (Utilities)
Equity, Since 31 May 09 | 5325558% ₹480 Cr 15,400,000 Larsen & Toubro Ltd (Industrials)
Equity, Since 30 Nov 07 | LT8% ₹472 Cr 1,492,001 Bharti Airtel Ltd (Communication Services)
Equity, Since 30 Apr 18 | BHARTIARTL7% ₹408 Cr 2,600,000 UltraTech Cement Ltd (Basic Materials)
Equity, Since 31 Oct 19 | 5325384% ₹243 Cr 240,038 Tata Power Co Ltd (Utilities)
Equity, Since 30 Apr 23 | 5004004% ₹237 Cr 6,975,789
↑ 500,000 Kaynes Technology India Ltd (Industrials)
Equity, Since 30 Nov 22 | KAYNES3% ₹176 Cr 423,938 Siemens Ltd (Industrials)
Equity, Since 31 May 21 | 5005503% ₹162 Cr 350,000 CG Power & Industrial Solutions Ltd (Industrials)
Equity, Since 30 Sep 24 | 5000932% ₹151 Cr 2,632,923
↑ 80,000 Carborundum Universal Ltd (Industrials)
Equity, Since 30 Sep 23 | CARBORUNIV2% ₹150 Cr 1,800,000 6. ICICI Prudential Infrastructure Fund
CAGR/Annualized return of 15.9% since its launch. Ranked 27 in Sectoral category. Return for 2024 was 27.4% , 2023 was 44.6% and 2022 was 28.8% . ICICI Prudential Infrastructure Fund
Growth Launch Date 31 Aug 05 NAV (24 Apr 25) ₹182.84 ↑ 0.07 (0.04 %) Net Assets (Cr) ₹7,214 on 31 Mar 25 Category Equity - Sectoral AMC ICICI Prudential Asset Management Company Limited Rating ☆☆☆ Risk High Expense Ratio 2.22 Sharpe Ratio 0.14 Information Ratio 0 Alpha Ratio 0 Min Investment 5,000 Min SIP Investment 100 Exit Load 0-1 Years (1%),1 Years and above(NIL) Growth of 10,000 investment over the years.
Date Value 31 Mar 20 ₹10,000 31 Mar 21 ₹18,670 31 Mar 22 ₹25,304 31 Mar 23 ₹30,899 31 Mar 24 ₹50,465 31 Mar 25 ₹54,540 Returns for ICICI Prudential Infrastructure Fund
absolute basis & more than 1 year are on CAGR (Compound Annual Growth Rate) basis. as on 24 Apr 25 Duration Returns 1 Month 3.1% 3 Month 2.6% 6 Month -3.8% 1 Year 7.1% 3 Year 28.1% 5 Year 38.9% 10 Year 15 Year Since launch 15.9% Historical performance (Yearly) on absolute basis
Year Returns 2023 27.4% 2022 44.6% 2021 28.8% 2020 50.1% 2019 3.6% 2018 2.6% 2017 -14% 2016 40.8% 2015 2% 2014 -3.4% Fund Manager information for ICICI Prudential Infrastructure Fund
Name Since Tenure Ihab Dalwai 3 Jun 17 7.75 Yr. Sharmila D’mello 30 Jun 22 2.67 Yr. Data below for ICICI Prudential Infrastructure Fund as on 31 Mar 25
Equity Sector Allocation
Sector Value Industrials 36.49% Basic Materials 21.39% Financial Services 16.91% Utility 8.65% Energy 7.09% Communication Services 1.63% Consumer Cyclical 0.89% Real Estate 0.35% Asset Allocation
Asset Class Value Cash 5.98% Equity 93.39% Debt 0.62% Top Securities Holdings / Portfolio
Name Holding Value Quantity Larsen & Toubro Ltd (Industrials)
Equity, Since 30 Nov 09 | LT9% ₹649 Cr 2,052,790
↑ 126,940 Adani Ports & Special Economic Zone Ltd (Industrials)
Equity, Since 31 May 24 | ADANIPORTS4% ₹288 Cr 2,695,324 Shree Cement Ltd (Basic Materials)
Equity, Since 30 Apr 24 | 5003874% ₹268 Cr 98,408
↓ -10,339 ICICI Bank Ltd (Financial Services)
Equity, Since 31 Dec 16 | ICICIBANK3% ₹240 Cr 1,990,000 NTPC Ltd (Utilities)
Equity, Since 29 Feb 16 | 5325553% ₹226 Cr 7,260,775 HDFC Bank Ltd (Financial Services)
Equity, Since 31 Jan 22 | HDFCBANK3% ₹212 Cr 1,225,000 NCC Ltd (Industrials)
Equity, Since 31 Aug 21 | NCC3% ₹210 Cr 12,006,117
↑ 1,500,000 Reliance Industries Ltd (Energy)
Equity, Since 31 Jul 23 | RELIANCE3% ₹205 Cr 1,709,486
↑ 100,000 Vedanta Ltd (Basic Materials)
Equity, Since 31 Jul 24 | 5002953% ₹194 Cr 4,923,662
↑ 100,000 Cummins India Ltd (Industrials)
Equity, Since 31 May 17 | 5004803% ₹173 Cr 635,000 7. Franklin Build India Fund
CAGR/Annualized return of 18.1% since its launch. Ranked 4 in Sectoral category. Return for 2024 was 27.8% , 2023 was 51.1% and 2022 was 11.2% . Franklin Build India Fund
Growth Launch Date 4 Sep 09 NAV (24 Apr 25) ₹133.79 ↓ -0.54 (-0.40 %) Net Assets (Cr) ₹2,642 on 31 Mar 25 Category Equity - Sectoral AMC Franklin Templeton Asst Mgmt(IND)Pvt Ltd Rating ☆☆☆☆☆ Risk High Expense Ratio 2.13 Sharpe Ratio 0.09 Information Ratio 0 Alpha Ratio 0 Min Investment 5,000 Min SIP Investment 500 Exit Load 0-1 Years (1%),1 Years and above(NIL) Growth of 10,000 investment over the years.
Date Value 31 Mar 20 ₹10,000 31 Mar 21 ₹18,042 31 Mar 22 ₹22,684 31 Mar 23 ₹25,531 31 Mar 24 ₹43,699 31 Mar 25 ₹46,685 Returns for Franklin Build India Fund
absolute basis & more than 1 year are on CAGR (Compound Annual Growth Rate) basis. as on 24 Apr 25 Duration Returns 1 Month 4.5% 3 Month 2.6% 6 Month -4.1% 1 Year 6.2% 3 Year 27.9% 5 Year 35.1% 10 Year 15 Year Since launch 18.1% Historical performance (Yearly) on absolute basis
Year Returns 2023 27.8% 2022 51.1% 2021 11.2% 2020 45.9% 2019 5.4% 2018 6% 2017 -10.7% 2016 43.3% 2015 8.4% 2014 2.1% Fund Manager information for Franklin Build India Fund
Name Since Tenure Ajay Argal 18 Oct 21 3.37 Yr. Kiran Sebastian 7 Feb 22 3.06 Yr. Sandeep Manam 18 Oct 21 3.37 Yr. Data below for Franklin Build India Fund as on 31 Mar 25
Equity Sector Allocation
Sector Value Industrials 35.61% Utility 12.65% Financial Services 11.45% Energy 11.44% Communication Services 8.02% Basic Materials 7.35% Real Estate 3.12% Consumer Cyclical 2.86% Technology 1.72% Asset Allocation
Asset Class Value Cash 5.78% Equity 94.22% Top Securities Holdings / Portfolio
Name Holding Value Quantity Larsen & Toubro Ltd (Industrials)
Equity, Since 29 Feb 20 | LT9% ₹228 Cr 720,000 ICICI Bank Ltd (Financial Services)
Equity, Since 31 Mar 12 | ICICIBANK6% ₹144 Cr 1,200,000 InterGlobe Aviation Ltd (Industrials)
Equity, Since 29 Feb 20 | INDIGO6% ₹134 Cr 300,000 NTPC Ltd (Utilities)
Equity, Since 30 Nov 16 | 5325555% ₹128 Cr 4,125,000
↑ 195,000 Reliance Industries Ltd (Energy)
Equity, Since 31 Oct 21 | RELIANCE5% ₹126 Cr 1,050,000 Oil & Natural Gas Corp Ltd (Energy)
Equity, Since 30 Jun 19 | 5003125% ₹113 Cr 5,000,000
↑ 500,000 Bharti Airtel Ltd (Communication Services)
Equity, Since 30 Sep 09 | BHARTIARTL5% ₹111 Cr 710,000 Axis Bank Ltd (Financial Services)
Equity, Since 31 Mar 12 | 5322154% ₹91 Cr 900,000 Power Grid Corp Of India Ltd (Utilities)
Equity, Since 28 Feb 21 | 5328984% ₹84 Cr 3,365,000 Tata Power Co Ltd (Utilities)
Equity, Since 31 Jan 25 | 5004003% ₹68 Cr 2,000,000
↑ 545,843 8. Motilal Oswal Midcap 30 Fund
CAGR/Annualized return of 22.3% since its launch. Ranked 27 in Mid Cap category. Return for 2024 was 57.1% , 2023 was 41.7% and 2022 was 10.7% . Motilal Oswal Midcap 30 Fund
Growth Launch Date 24 Feb 14 NAV (24 Apr 25) ₹93.7774 ↓ -0.75 (-0.79 %) Net Assets (Cr) ₹26,028 on 31 Mar 25 Category Equity - Mid Cap AMC Motilal Oswal Asset Management Co. Ltd Rating ☆☆☆ Risk Moderately High Expense Ratio 0.66 Sharpe Ratio 0.47 Information Ratio 0.63 Alpha Ratio 8.9 Min Investment 5,000 Min SIP Investment 500 Exit Load 0-1 Years (1%),1 Years and above(NIL) Growth of 10,000 investment over the years.
Date Value 31 Mar 20 ₹10,000 31 Mar 21 ₹16,888 31 Mar 22 ₹23,342 31 Mar 23 ₹25,677 31 Mar 24 ₹41,172 31 Mar 25 ₹48,151 Returns for Motilal Oswal Midcap 30 Fund
absolute basis & more than 1 year are on CAGR (Compound Annual Growth Rate) basis. as on 24 Apr 25 Duration Returns 1 Month 2.9% 3 Month -4.3% 6 Month -10.9% 1 Year 14.9% 3 Year 27% 5 Year 36.9% 10 Year 15 Year Since launch 22.3% Historical performance (Yearly) on absolute basis
Year Returns 2023 57.1% 2022 41.7% 2021 10.7% 2020 55.8% 2019 9.3% 2018 9.7% 2017 -12.7% 2016 30.8% 2015 5.2% 2014 16.5% Fund Manager information for Motilal Oswal Midcap 30 Fund
Name Since Tenure Ajay Khandelwal 1 Oct 24 0.41 Yr. Niket Shah 1 Jul 20 4.67 Yr. Rakesh Shetty 22 Nov 22 2.27 Yr. Sunil Sawant 1 Jul 24 0.67 Yr. Data below for Motilal Oswal Midcap 30 Fund as on 31 Mar 25
Equity Sector Allocation
Sector Value Technology 34.02% Consumer Cyclical 16.09% Industrials 11.09% Health Care 5% Communication Services 3.44% Real Estate 2.8% Basic Materials 2.32% Utility 2.06% Financial Services 0.09% Asset Allocation
Asset Class Value Cash 28.33% Equity 71.67% Top Securities Holdings / Portfolio
Name Holding Value Quantity Coforge Ltd (Technology)
Equity, Since 31 Mar 23 | COFORGE10% ₹2,349 Cr 3,190,000
↑ 340,000 Persistent Systems Ltd (Technology)
Equity, Since 31 Jan 23 | PERSISTENT10% ₹2,254 Cr 4,249,800
↑ 249,800 Kalyan Jewellers India Ltd (Consumer Cyclical)
Equity, Since 29 Feb 24 | KALYANKJIL7% ₹1,619 Cr 35,027,075
↑ 26,975 Dixon Technologies (India) Ltd (Technology)
Equity, Since 31 Mar 23 | DIXON7% ₹1,581 Cr 1,134,324
↑ 134,324 Max Healthcare Institute Ltd Ordinary Shares (Healthcare)
Equity, Since 31 Mar 24 | MAXHEALTH4% ₹975 Cr 9,969,361
↑ 1,913,231 One97 Communications Ltd (Technology)
Equity, Since 30 Sep 24 | 5433964% ₹934 Cr 13,066,359
↑ 3,065,359 Trent Ltd (Consumer Cyclical)
Equity, Since 30 Nov 24 | 5002514% ₹873 Cr 1,800,000
↓ -820,200 Polycab India Ltd (Industrials)
Equity, Since 30 Sep 23 | POLYCAB3% ₹825 Cr 1,750,000
↓ -100,000 Bharti Hexacom Ltd (Communication Services)
Equity, Since 31 Oct 24 | BHARTIHEXA3% ₹815 Cr 6,250,000
↑ 174,429 KEI Industries Ltd (Industrials)
Equity, Since 30 Nov 24 | KEI3% ₹768 Cr 2,500,000
↑ 1,250,000 9. IDFC Infrastructure Fund
CAGR/Annualized return of 11.8% since its launch. Ranked 1 in Sectoral category. Return for 2024 was 39.3% , 2023 was 50.3% and 2022 was 1.7% . IDFC Infrastructure Fund
Growth Launch Date 8 Mar 11 NAV (24 Apr 25) ₹48.021 ↓ -0.02 (-0.05 %) Net Assets (Cr) ₹1,563 on 31 Mar 25 Category Equity - Sectoral AMC IDFC Asset Management Company Limited Rating ☆☆☆☆☆ Risk High Expense Ratio 2.33 Sharpe Ratio 0.11 Information Ratio 0 Alpha Ratio 0 Min Investment 5,000 Min SIP Investment 100 Exit Load 0-365 Days (1%),365 Days and above(NIL) Growth of 10,000 investment over the years.
Date Value 31 Mar 20 ₹10,000 31 Mar 21 ₹20,153 31 Mar 22 ₹24,848 31 Mar 23 ₹27,324 31 Mar 24 ₹47,064 31 Mar 25 ₹50,038 Returns for IDFC Infrastructure Fund
absolute basis & more than 1 year are on CAGR (Compound Annual Growth Rate) basis. as on 24 Apr 25 Duration Returns 1 Month 4.9% 3 Month 0.9% 6 Month -6.6% 1 Year 5.3% 3 Year 25.9% 5 Year 36.1% 10 Year 15 Year Since launch 11.8% Historical performance (Yearly) on absolute basis
Year Returns 2023 39.3% 2022 50.3% 2021 1.7% 2020 64.8% 2019 6.3% 2018 -5.3% 2017 -25.9% 2016 58.7% 2015 10.7% 2014 -0.2% Fund Manager information for IDFC Infrastructure Fund
Name Since Tenure Vishal Biraia 24 Jan 24 1.1 Yr. Ritika Behera 7 Oct 23 1.4 Yr. Gaurav Satra 7 Jun 24 0.73 Yr. Data below for IDFC Infrastructure Fund as on 31 Mar 25
Equity Sector Allocation
Sector Value Industrials 54.7% Utility 13.22% Basic Materials 10.84% Communication Services 4.49% Energy 3.88% Consumer Cyclical 3.46% Financial Services 2.99% Technology 2.07% Health Care 1.9% Asset Allocation
Asset Class Value Cash 2.43% Equity 97.57% Top Securities Holdings / Portfolio
Name Holding Value Quantity Kirloskar Brothers Ltd (Industrials)
Equity, Since 31 Dec 17 | KIRLOSBROS5% ₹71 Cr 443,385 Larsen & Toubro Ltd (Industrials)
Equity, Since 29 Feb 12 | LT4% ₹58 Cr 183,173
↑ 11,726 Reliance Industries Ltd (Energy)
Equity, Since 30 Jun 24 | RELIANCE4% ₹54 Cr 452,706 Bharti Airtel Ltd (Communication Services)
Equity, Since 30 Apr 19 | BHARTIARTL4% ₹52 Cr 330,018
↑ 40,855 UltraTech Cement Ltd (Basic Materials)
Equity, Since 31 Mar 14 | 5325384% ₹51 Cr 50,452
↑ 3,476 GPT Infraprojects Ltd (Industrials)
Equity, Since 30 Nov 17 | GPTINFRA3% ₹45 Cr 4,797,143 Adani Ports & Special Economic Zone Ltd (Industrials)
Equity, Since 31 Dec 23 | ADANIPORTS3% ₹39 Cr 365,137
↓ -69,842 PTC India Financial Services Ltd (Financial Services)
Equity, Since 31 Dec 23 | PFS3% ₹39 Cr 12,400,122 Bharat Electronics Ltd (Industrials)
Equity, Since 31 Oct 19 | BEL3% ₹35 Cr 1,431,700 KEC International Ltd (Industrials)
Equity, Since 30 Jun 24 | 5327143% ₹35 Cr 512,915 10. Canara Robeco Infrastructure
CAGR/Annualized return of 15% since its launch. Return for 2024 was 35.3% , 2023 was 41.2% and 2022 was 9% . Canara Robeco Infrastructure
Growth Launch Date 2 Dec 05 NAV (24 Apr 25) ₹149.52 ↓ -0.37 (-0.25 %) Net Assets (Cr) ₹815 on 31 Mar 25 Category Equity - Sectoral AMC Canara Robeco Asset Management Co. Ltd. Rating Risk High Expense Ratio 2.47 Sharpe Ratio 0.36 Information Ratio 0 Alpha Ratio 0 Min Investment 5,000 Min SIP Investment 1,000 Exit Load 0-1 Years (1%),1 Years and above(NIL) Growth of 10,000 investment over the years.
Date Value 31 Mar 20 ₹10,000 31 Mar 21 ₹17,577 31 Mar 22 ₹22,500 31 Mar 23 ₹25,245 31 Mar 24 ₹38,923 31 Mar 25 ₹44,217 Returns for Canara Robeco Infrastructure
absolute basis & more than 1 year are on CAGR (Compound Annual Growth Rate) basis. as on 24 Apr 25 Duration Returns 1 Month 3.9% 3 Month 2.6% 6 Month -5.9% 1 Year 12.8% 3 Year 25.6% 5 Year 33.4% 10 Year 15 Year Since launch 15% Historical performance (Yearly) on absolute basis
Year Returns 2023 35.3% 2022 41.2% 2021 9% 2020 56.1% 2019 9% 2018 2.3% 2017 -19.1% 2016 40.2% 2015 2.1% 2014 6.7% Fund Manager information for Canara Robeco Infrastructure
Name Since Tenure Vishal Mishra 26 Jun 21 3.68 Yr. Shridatta Bhandwaldar 29 Sep 18 6.42 Yr. Data below for Canara Robeco Infrastructure as on 31 Mar 25
Equity Sector Allocation
Sector Value Industrials 47.44% Utility 13.69% Basic Materials 9.57% Energy 8.57% Financial Services 6.82% Technology 3.25% Communication Services 2.95% Consumer Cyclical 2.95% Real Estate 1.63% Asset Allocation
Asset Class Value Cash 3.13% Equity 96.87% Top Securities Holdings / Portfolio
Name Holding Value Quantity Larsen & Toubro Ltd (Industrials)
Equity, Since 28 Feb 11 | LT7% ₹47 Cr 149,401
↑ 6,000 NTPC Ltd (Utilities)
Equity, Since 30 Nov 18 | 5325555% ₹35 Cr 1,131,666 InterGlobe Aviation Ltd (Industrials)
Equity, Since 31 Jan 23 | INDIGO4% ₹30 Cr 67,250 Reliance Industries Ltd (Energy)
Equity, Since 30 Apr 22 | RELIANCE4% ₹30 Cr 250,250
↑ 5,500 Tata Power Co Ltd (Utilities)
Equity, Since 30 Sep 24 | 5004004% ₹27 Cr 785,000 State Bank of India (Financial Services)
Equity, Since 31 Jul 24 | SBIN4% ₹25 Cr 370,000
↑ 50,000 Power Finance Corp Ltd (Financial Services)
Equity, Since 30 Nov 23 | 5328103% ₹24 Cr 660,000
↑ 50,000 Power Grid Corp Of India Ltd (Utilities)
Equity, Since 31 Oct 09 | 5328983% ₹24 Cr 957,546 Dixon Technologies (India) Ltd (Technology)
Equity, Since 31 Oct 23 | DIXON3% ₹24 Cr 16,950 Bharat Electronics Ltd (Industrials)
Equity, Since 31 Jul 19 | BEL3% ₹23 Cr 919,000
As said above, selecting a best Mutual Fund is a tedious task requiring research. You have to be careful in selecting the best mutual fund scheme, one should assess all the risks and take into consideration the many factors that go into selecting the top and best mutual fund. Investing regularly reduces the risk of volatility and gives you better returns. If one invests consistently over time it will lead to good results in the future. Always remember, it's not market timing that makes money, it's the time you spend in the market!
All efforts have been made to ensure the information provided here is accurate. However, no guarantees are made regarding correctness of data. Please verify with scheme information document before making any investment.


AMFI Registration No. 112358 | CIN: U74999MH2016PTC282153
Shepard Technologies Pvt. Ltd. (with ARN code 112358) makes no warranties or representations, express or implied, on products offered through the platform. It accepts no liability for any damages or losses, however caused, in connection with the use of, or on the reliance of its product or related services. Terms and conditions of the website are applicable.
©2025 Shepard Technologies Private Limited. All Rights Reserved
Nice post, thanks