Table of Contents
- মিউচুয়াল ফান্ডে একক বিনিয়োগ বলতে আপনি কী বোঝেন?
- 2022 - 2023-এ একক বিনিয়োগের জন্য সেরা মিউচুয়াল ফান্ড
- গত 1 মাসের উপর ভিত্তি করে সেরা মিউচুয়াল ফান্ড
- একক বিনিয়োগের সময় যে বিষয়গুলি বিবেচনা করা উচিত৷
- মিউচুয়াল ফান্ড লাম্প সাম রিটার্ন ক্যালকুলেটর
- মিউচুয়াল ফান্ডে এককালীন বিনিয়োগের সুবিধা এবং অসুবিধা
- উপসংহার
Top 5 Funds
মিউচুয়াল ফান্ডে একক বিনিয়োগ
আপনি কি জানেন যে আপনি একটি একক পরিমাণ বিনিয়োগ করতে পারেনযৌথ পুঁজি? যদি হ্যাঁ, তাহলে ভালো। যাইহোক, যদি না হয়, তাহলে চিন্তা করবেন না। এই নিবন্ধটি একই মাধ্যমে আপনাকে গাইড করবে। মিউচুয়াল ফান্ডে একক বিনিয়োগ বলতে এমন একটি পরিস্থিতিকে বোঝায় যখন একজন ব্যক্তি মিউচুয়াল ফান্ডে একবারে অর্থ বিনিয়োগ করে। এখানে একাধিকবার জমা হয় না। এর মধ্যে অনেক পার্থক্য রয়েছেচুমুক এবং বিনিয়োগের একমুঠো মোড। সুতরাং, আসুন মিউচুয়াল ফান্ডে একক বিনিয়োগের ধারণাটি বুঝতে পারি,সেরা মিউচুয়াল ফান্ড একমুঠো বিনিয়োগের জন্য, একক বিনিয়োগের সময় যে বিষয়গুলি বিবেচনা করতে হবে, মিউচুয়াল ফান্ড একক ফেরত ক্যালকুলেটর এবং অন্যান্য সম্পর্কিত দিকগুলি এই নিবন্ধটির মাধ্যমে।

মিউচুয়াল ফান্ডে একক বিনিয়োগ বলতে আপনি কী বোঝেন?
মিউচুয়াল ফান্ডে একক বিনিয়োগ এমন একটি দৃশ্য যেখানে ব্যক্তিমিউচুয়াল ফান্ডে বিনিয়োগ করুন শুধুমাত্র একবারের জন্য। যাইহোক, বিনিয়োগের SIP মোডের বিপরীতে যেখানে ব্যক্তিরা একক পরিমাণে অল্প পরিমাণ জমা করে, ব্যক্তিরা যথেষ্ট পরিমাণে জমা করে। অন্য কথায়, এটি একটি এক-শট কৌশলবিনিয়োগ মিউচুয়াল ফান্ডে। বিনিয়োগকারীদের জন্য উপযুক্ত বিনিয়োগের একমুঠো মোড যাদের অতিরিক্ত তহবিল রয়েছে যা তাদের আদর্শে পড়ে আছেব্যাংক অ্যাকাউন্ট এবং আরও উপার্জনের জন্য চ্যানেল খুঁজছেনআয় মিউচুয়াল ফান্ডে বিনিয়োগ করে।
2022 - 2023-এ একক বিনিয়োগের জন্য সেরা মিউচুয়াল ফান্ড
আপনি একমুঠো মোডের মাধ্যমে মিউচুয়াল ফান্ডে বিনিয়োগ করার আগে, ব্যক্তিদের বিভিন্ন পরামিতি যেমন AUM, বিনিয়োগের পরিমাণ এবং আরও অনেক কিছু বিবেচনা করতে হবে। সুতরাং, এই পরামিতিগুলির উপর ভিত্তি করে একক বিনিয়োগের জন্য কিছু সেরা মিউচুয়াল ফান্ড নিম্নরূপ।
ইক্যুইটি মিউচুয়াল ফান্ডে সেরা একক বিনিয়োগ
ইক্যুইটি ফান্ড বিভিন্ন কোম্পানির ইক্যুইটি এবং ইক্যুইটি-সম্পর্কিত উপকরণগুলিতে তাদের কর্পাস বিনিয়োগ করে এমন স্কিমগুলি। এই স্কিমগুলি দীর্ঘমেয়াদী বিনিয়োগের জন্য একটি ভাল বিকল্প হিসাবে বিবেচিত হয়। যদিও ব্যক্তিরা ইক্যুইটি তহবিলে একক পরিমাণ বিনিয়োগ করতে পারে তবুও ইক্যুইটি তহবিলে বিনিয়োগের প্রস্তাবিত কৌশলটি হয় এসআইপি বাপদ্ধতিগত স্থানান্তর পরিকল্পনা (STP) মোড। STP মোডে, ব্যক্তিরা প্রথমে একটি উল্লেখযোগ্য অর্থ জমা করেঋণ তহবিল যেমনতরল তহবিল এবং তারপর ইক্যুইটি ফান্ডে নিয়মিত বিরতিতে টাকা স্থানান্তর করা হয়। বিনিয়োগের জন্য বিবেচনা করা যেতে পারে এমন কিছু ইক্যুইটি মিউচুয়াল ফান্ড নিম্নরূপ।
Fund NAV Net Assets (Cr) Min Investment 3 MO (%) 6 MO (%) 1 YR (%) 3 YR (%) 5 YR (%) 2024 (%) Nippon India Small Cap Fund Growth ₹173.528
↑ 0.81 ₹63,007 5,000 20 2 -1.5 29 37.2 26.1 ICICI Prudential Infrastructure Fund Growth ₹199.16
↓ -0.45 ₹7,920 5,000 17.1 9.5 2.7 34.9 36.9 27.4 Motilal Oswal Midcap 30 Fund Growth ₹102.825
↓ -0.24 ₹30,401 5,000 18.5 -4.3 6 32.6 35.6 57.1 L&T Emerging Businesses Fund Growth ₹83.9103
↑ 0.18 ₹16,061 5,000 22.8 -2.1 -2.9 25.7 34.6 28.5 IDFC Infrastructure Fund Growth ₹51.71
↑ 0.16 ₹1,701 5,000 18.1 2.9 -8.5 33.5 34.6 39.3 Note: Returns up to 1 year are on absolute basis & more than 1 year are on CAGR basis. as on 9 Jul 25
Talk to our investment specialist
ডেট মিউচুয়াল ফান্ডে সেরা একমাস বিনিয়োগ
ঋণ তহবিল তাদের তহবিল টাকা বিভিন্ন বিনিয়োগনির্দিষ্ট আয় ট্রেজারি বিলের মত যন্ত্রপাতি, কর্পোরেটবন্ড, এবং আরো অনেক কিছু. এই স্কিমগুলিকে স্বল্প এবং মাঝারি মেয়াদের জন্য একটি ভাল বিকল্প হিসাবে বিবেচনা করা হয়। অনেক ব্যক্তি ডেট মিউচুয়াল ফান্ডে একক অর্থ বিনিয়োগ করতে পছন্দ করেন। কিছুসেরা ঋণ তহবিল যেগুলি একক বিনিয়োগের জন্য বেছে নেওয়া যেতে পারে নিম্নরূপ।
Fund NAV Net Assets (Cr) Min Investment 3 MO (%) 6 MO (%) 1 YR (%) 3 YR (%) 2024 (%) Debt Yield (YTM) Mod. Duration Eff. Maturity Aditya Birla Sun Life Medium Term Plan Growth ₹40.0846
↓ 0.00 ₹2,504 1,000 2.5 7.6 14 14.9 10.5 7.43% 3Y 7M 17D 4Y 10M 20D DSP BlackRock Credit Risk Fund Growth ₹49.8086
↓ 0.00 ₹210 1,000 2.7 18.5 23.1 14.8 7.8 7.32% 1Y 11M 5D 2Y 7M 17D Aditya Birla Sun Life Credit Risk Fund Growth ₹22.4669
↑ 0.01 ₹993 1,000 2.9 9 17 11.3 11.9 7.8% 2Y 4M 2D 3Y 7M 13D L&T Credit Risk Fund Growth ₹32.4248
↓ 0.00 ₹657 10,000 13.2 17.3 21.5 11.2 7.2 7.19% 2Y 1M 17D 2Y 10M 6D Franklin India Credit Risk Fund Growth ₹25.3348
↑ 0.04 ₹104 5,000 2.9 5 7.5 11 0% Note: Returns up to 1 year are on absolute basis & more than 1 year are on CAGR basis. as on 9 Jul 25
একক বিনিয়োগের জন্য সেরা হাইব্রিড তহবিল
হাইব্রিড তহবিল নামেও পরিচিতব্যালেন্সড ফান্ড ইক্যুইটি এবং স্থির আয়ের উপকরণ উভয় ক্ষেত্রেই তাদের অর্থ বিনিয়োগ করুন। এই স্কিম খুঁজছেন ব্যক্তিদের জন্য উপযুক্তমূলধন নিয়মিত আয়ের পাশাপাশি প্রজন্ম। সুষম স্কিম হিসাবেও পরিচিত, ব্যক্তিরা হাইব্রিড স্কিমগুলিতে একক পরিমাণ বিনিয়োগ করতে বেছে নিতে পারেন। একক বিনিয়োগের জন্য কিছু সেরা হাইব্রিড তহবিল নীচে তালিকাভুক্ত করা হয়েছে।
Fund NAV Net Assets (Cr) Min Investment 3 MO (%) 6 MO (%) 1 YR (%) 3 YR (%) 5 YR (%) 2024 (%) JM Equity Hybrid Fund Growth ₹122.941
↑ 0.35 ₹822 5,000 12 1.8 -1.9 23.9 22.3 27 BOI AXA Mid and Small Cap Equity and Debt Fund Growth ₹38.72
↑ 0.13 ₹1,198 5,000 17 2.5 1.3 23.5 26.7 25.8 HDFC Balanced Advantage Fund Growth ₹524.129
↓ -0.26 ₹100,299 5,000 9.3 5.7 4.5 22.3 24.7 16.7 ICICI Prudential Equity and Debt Fund Growth ₹394.28
↓ -0.11 ₹43,159 5,000 9.9 8.8 7.8 22 25.6 17.2 UTI Multi Asset Fund Growth ₹74.8452
↓ -0.03 ₹5,659 5,000 9.9 5 6.5 21.6 16.7 20.7 Note: Returns up to 1 year are on absolute basis & more than 1 year are on CAGR basis. as on 9 Jul 25
একক বিনিয়োগের জন্য সেরা সূচক তহবিল
একটি সূচক তহবিলের পোর্টফোলিওতে শেয়ার এবং অন্যান্য উপকরণগুলি সূচকের অনুপাতে থাকে। অন্য কথায়, এই স্কিমগুলি একটি সূচকের কর্মক্ষমতা অনুকরণ করে। এগুলি নিষ্ক্রিয়ভাবে পরিচালিত তহবিল এবং একমুঠো বিনিয়োগের জন্য একটি ভাল বিকল্প হিসাবে বিবেচিত হতে পারে। সেরা কিছুসূচক তহবিল যেগুলি একক বিনিয়োগের জন্য বেছে নেওয়া যেতে পারে নিম্নরূপ।
Fund NAV Net Assets (Cr) 3 MO (%) 6 MO (%) 1 YR (%) 3 YR (%) 5 YR (%) 2024 (%) Nippon India Index Fund - Sensex Plan Growth ₹42.4694
↓ -0.09 ₹890 13.7 8.2 4.7 16 18.5 8.9 LIC MF Index Fund Sensex Growth ₹156.295
↓ -0.33 ₹89 13.5 7.9 4.1 15.5 17.9 8.2 Franklin India Index Fund Nifty Plan Growth ₹205.139
↓ -0.37 ₹737 14.1 8.8 5 16.8 19.2 9.5 SBI Nifty Index Fund Growth ₹224.801
↓ -0.41 ₹9,839 14.2 8.8 5 17 19.4 9.5 IDBI Nifty Index Fund Growth ₹36.2111
↓ -0.02 ₹208 9.1 11.9 16.2 20.3 11.7 Note: Returns up to 1 year are on absolute basis & more than 1 year are on CAGR basis. as on 9 Jul 25
গত 1 মাসের উপর ভিত্তি করে সেরা মিউচুয়াল ফান্ড
(Erstwhile Invesco India Global Equity Income Fund) To provide capital appreciation and/or income by investing predominantly
in units of Invesco Global Equity Income Fund, an overseas equity fund which invests primarily in equities of companies worldwide. The Scheme may, at the discretion of Fund Manager, also invest in units of other similar Overseas Mutual Funds with similar objectives, strategy and attributes which may constitute a significant portion of its net assets. Invesco India Feeder- Invesco Global Equity Income Fund is a Equity - Global fund was launched on 5 May 14. It is a fund with High risk and has given a Below is the key information for Invesco India Feeder- Invesco Global Equity Income Fund Returns up to 1 year are on The investment objective of ICICI Prudential US Bluechip Equity Fund is to provide long term capital appreciation to investors by primarily investing in equity and equity related securities (including ADRs/GDRs issued by Indian and foreign companies) of companies listed on New York Stock Exchange and/or NASDAQ. However, there can be no assurance that the investment objective of the Scheme will be realized. ICICI Prudential US Bluechip Equity Fund is a Equity - Global fund was launched on 6 Jul 12. It is a fund with High risk and has given a Below is the key information for ICICI Prudential US Bluechip Equity Fund Returns up to 1 year are on The primary investment objective of the Scheme is to seek capital appreciation by investing predominantly in the units of BlackRock Global Funds – World Energy Fund and BlackRock Global Funds – New Energy Fund. The Scheme may, at the discretion of the Investment Manager, also invest in the units of other similar overseas mutual fund schemes, which may constitute a significant part of its corpus. The Scheme may also invest a certain portion of its corpus in money market securities
and/or money market/liquid schemes of DSP BlackRock Mutual Fund, in order to meet liquidity
requirements from time to time. DSP BlackRock World Energy Fund is a Equity - Global fund was launched on 14 Aug 09. It is a fund with High risk and has given a Below is the key information for DSP BlackRock World Energy Fund Returns up to 1 year are on (Erstwhile DHFL Pramerica Top Euroland Offshore Fund) The primary investment objective of the scheme is to generate long-term capital growth from a diversified portfolio of units of overseas mutual funds. PGIM India Euro Equity Fund is a Others - Fund of Fund fund was launched on 11 Sep 07. It is a fund with High risk and has given a Below is the key information for PGIM India Euro Equity Fund Returns up to 1 year are on To generate long term capital appreciation from a portfolio that is predominantly in equity and equity related instruments HDFC Long Term Advantage Fund is a Equity - ELSS fund was launched on 2 Jan 01. It is a fund with Moderately High risk and has given a Below is the key information for HDFC Long Term Advantage Fund Returns up to 1 year are on 1. Invesco India Feeder- Invesco Global Equity Income Fund
CAGR/Annualized return of 10.6% since its launch. Ranked 12 in Global category. Return for 2024 was 13.7% , 2023 was 27% and 2022 was -2.1% . Invesco India Feeder- Invesco Global Equity Income Fund
Growth Launch Date 5 May 14 NAV (09 Jul 25) ₹30.8032 ↑ 0.17 (0.56 %) Net Assets (Cr) ₹41 on 31 May 25 Category Equity - Global AMC Invesco Asset Management (India) Private Ltd Rating ☆☆☆ Risk High Expense Ratio 1.4 Sharpe Ratio 0.9 Information Ratio 0 Alpha Ratio 0 Min Investment 5,000 Min SIP Investment 500 Exit Load 0-1 Years (1%),1 Years and above(NIL) Growth of 10,000 investment over the years.
Date Value 30 Jun 20 ₹10,000 30 Jun 21 ₹13,839 30 Jun 22 ₹12,737 30 Jun 23 ₹16,140 30 Jun 24 ₹19,349 30 Jun 25 ₹24,169 Returns for Invesco India Feeder- Invesco Global Equity Income Fund
absolute basis & more than 1 year are on CAGR (Compound Annual Growth Rate) basis. as on 9 Jul 25 Duration Returns 1 Month 5.6% 3 Month 27.2% 6 Month 18% 1 Year 26.8% 3 Year 23.4% 5 Year 19.2% 10 Year 15 Year Since launch 10.6% Historical performance (Yearly) on absolute basis
Year Returns 2024 13.7% 2023 27% 2022 -2.1% 2021 21% 2020 7.3% 2019 24.7% 2018 -7.5% 2017 13.2% 2016 2.6% 2015 4% Fund Manager information for Invesco India Feeder- Invesco Global Equity Income Fund
Name Since Tenure Sagar Gandhi 1 Mar 25 0.33 Yr. Data below for Invesco India Feeder- Invesco Global Equity Income Fund as on 31 May 25
Equity Sector Allocation
Sector Value Industrials 23.89% Technology 17.27% Financial Services 16.71% Health Care 12.12% Consumer Cyclical 4.81% Consumer Defensive 4.76% Real Estate 4.03% Communication Services 2.74% Energy 2.26% Basic Materials 2.14% Asset Allocation
Asset Class Value Cash 3.08% Equity 90.72% Other 6.2% Top Securities Holdings / Portfolio
Name Holding Value Quantity Invesco Global Equity Income C USD Acc
Investment Fund | -96% ₹40 Cr 29,343
↑ 2,042 Triparty Repo
CBLO/Reverse Repo | -7% ₹3 Cr Net Receivables / (Payables)
CBLO | -3% -₹1 Cr 2. ICICI Prudential US Bluechip Equity Fund
CAGR/Annualized return of 15.4% since its launch. Ranked 7 in Global category. Return for 2024 was 10.4% , 2023 was 30.6% and 2022 was -7.1% . ICICI Prudential US Bluechip Equity Fund
Growth Launch Date 6 Jul 12 NAV (08 Jul 25) ₹64.57 ↑ 0.29 (0.45 %) Net Assets (Cr) ₹3,015 on 31 May 25 Category Equity - Global AMC ICICI Prudential Asset Management Company Limited Rating ☆☆☆☆ Risk High Expense Ratio 2.18 Sharpe Ratio -0.08 Information Ratio -0.81 Alpha Ratio -8.77 Min Investment 5,000 Min SIP Investment 100 Exit Load 0-3 Months (3%),3-12 Months (1%),12 Months and above(NIL) Growth of 10,000 investment over the years.
Date Value 30 Jun 20 ₹10,000 30 Jun 21 ₹13,701 30 Jun 22 ₹12,219 30 Jun 23 ₹15,905 30 Jun 24 ₹17,450 30 Jun 25 ₹19,038 Returns for ICICI Prudential US Bluechip Equity Fund
absolute basis & more than 1 year are on CAGR (Compound Annual Growth Rate) basis. as on 9 Jul 25 Duration Returns 1 Month 5.1% 3 Month 24.3% 6 Month 3.7% 1 Year 12.9% 3 Year 15.5% 5 Year 14.3% 10 Year 15 Year Since launch 15.4% Historical performance (Yearly) on absolute basis
Year Returns 2024 10.4% 2023 30.6% 2022 -7.1% 2021 22.5% 2020 18.6% 2019 34.3% 2018 5.2% 2017 14.1% 2016 11.6% 2015 0.7% Fund Manager information for ICICI Prudential US Bluechip Equity Fund
Name Since Tenure Ritesh Lunawat 13 Sep 24 0.79 Yr. Sharmila D’mello 1 Jul 22 3 Yr. Nitya Mishra 4 Nov 24 0.65 Yr. Data below for ICICI Prudential US Bluechip Equity Fund as on 31 May 25
Equity Sector Allocation
Sector Value Health Care 27.21% Technology 21.92% Industrials 13.9% Consumer Defensive 11.93% Financial Services 8.13% Communication Services 5.47% Basic Materials 5.04% Consumer Cyclical 3.86% Energy 0.55% Asset Allocation
Asset Class Value Cash 1.99% Equity 98.01% Top Securities Holdings / Portfolio
Name Holding Value Quantity Veeva Systems Inc Class A (Healthcare)
Equity, Since 31 Oct 21 | VEEV3% ₹92 Cr 38,291 West Pharmaceutical Services Inc (Healthcare)
Equity, Since 31 Dec 24 | WST3% ₹85 Cr 47,000 Huntington Ingalls Industries Inc (Industrials)
Equity, Since 29 Feb 24 | HII3% ₹81 Cr 42,405
↓ -11,786 Brown-Forman Corp Registered Shs -B- Non Vtg (Consumer Defensive)
Equity, Since 30 Jun 24 | BF.B3% ₹80 Cr 281,600 Allegion PLC (Industrials)
Equity, Since 30 Sep 22 | ALLE2% ₹74 Cr 60,986 Zimmer Biomet Holdings Inc (Healthcare)
Equity, Since 31 Mar 17 | ZBH2% ₹74 Cr 93,999
↑ 9,000 Microchip Technology Inc (Technology)
Equity, Since 30 Sep 21 | MCHP2% ₹73 Cr 148,020
↓ -23,000 Pfizer Inc (Healthcare)
Equity, Since 31 Mar 23 | PFE2% ₹73 Cr 362,963 Monolithic Power Systems Inc (Technology)
Equity, Since 31 Dec 24 | MPWR2% ₹73 Cr 12,877
↓ -2,000 Corteva Inc (Basic Materials)
Equity, Since 30 Jun 23 | 2X02% ₹73 Cr 119,840
↓ -28,000 3. DSP BlackRock World Energy Fund
CAGR/Annualized return of 4.2% since its launch. Ranked 29 in Global category. Return for 2024 was -6.8% , 2023 was 12.9% and 2022 was -8.6% . DSP BlackRock World Energy Fund
Growth Launch Date 14 Aug 09 NAV (08 Jul 25) ₹19.2977 ↓ -0.26 (-1.34 %) Net Assets (Cr) ₹85 on 31 May 25 Category Equity - Global AMC DSP BlackRock Invmt Managers Pvt. Ltd. Rating ☆☆ Risk High Expense Ratio 1.2 Sharpe Ratio -0.49 Information Ratio 0 Alpha Ratio 0 Min Investment 1,000 Min SIP Investment 500 Exit Load 0-12 Months (1%),12 Months and above(NIL) Growth of 10,000 investment over the years.
Date Value 30 Jun 20 ₹10,000 30 Jun 21 ₹14,612 30 Jun 22 ₹12,054 30 Jun 23 ₹16,043 30 Jun 24 ₹15,617 30 Jun 25 ₹16,350 Returns for DSP BlackRock World Energy Fund
absolute basis & more than 1 year are on CAGR (Compound Annual Growth Rate) basis. as on 9 Jul 25 Duration Returns 1 Month 4.9% 3 Month 30.2% 6 Month 11.7% 1 Year 6.4% 3 Year 11.5% 5 Year 10.7% 10 Year 15 Year Since launch 4.2% Historical performance (Yearly) on absolute basis
Year Returns 2024 -6.8% 2023 12.9% 2022 -8.6% 2021 29.5% 2020 0% 2019 18.2% 2018 -11.3% 2017 -1.9% 2016 22.5% 2015 -20.9% Fund Manager information for DSP BlackRock World Energy Fund
Name Since Tenure Jay Kothari 1 Mar 13 12.34 Yr. Data below for DSP BlackRock World Energy Fund as on 31 May 25
Equity Sector Allocation
Sector Value Industrials 35.62% Technology 27.98% Utility 23.78% Basic Materials 6.41% Consumer Cyclical 0.13% Asset Allocation
Asset Class Value Cash 6.01% Equity 93.95% Debt 0.04% Top Securities Holdings / Portfolio
Name Holding Value Quantity BGF Sustainable Energy I2
Investment Fund | -99% ₹84 Cr 518,309
↓ -4,851 Treps / Reverse Repo Investments
CBLO/Reverse Repo | -2% ₹1 Cr Net Receivables/Payables
Net Current Assets | -0% ₹0 Cr 4. PGIM India Euro Equity Fund
CAGR/Annualized return of 2.9% since its launch. Ranked 24 in Fund of Fund category. Return for 2024 was 20.6% , 2023 was 14.6% and 2022 was -35.6% . PGIM India Euro Equity Fund
Growth Launch Date 11 Sep 07 NAV (08 Jul 25) ₹16.66 ↑ 0.11 (0.66 %) Net Assets (Cr) ₹157 on 31 May 25 Category Others - Fund of Fund AMC Pramerica Asset Managers Private Limited Rating ☆☆ Risk High Expense Ratio 1.62 Sharpe Ratio 0.52 Information Ratio 0.03 Alpha Ratio 0.52 Min Investment 5,000 Min SIP Investment 1,000 Exit Load 0-12 Months (1%),12 Months and above(NIL) Growth of 10,000 investment over the years.
Date Value 30 Jun 20 ₹10,000 30 Jun 21 ₹14,340 30 Jun 22 ₹8,625 30 Jun 23 ₹7,889 30 Jun 24 ₹10,090 30 Jun 25 ₹11,528 Returns for PGIM India Euro Equity Fund
absolute basis & more than 1 year are on CAGR (Compound Annual Growth Rate) basis. as on 9 Jul 25 Duration Returns 1 Month 4.4% 3 Month 27.3% 6 Month 6.2% 1 Year 12.2% 3 Year 10% 5 Year 2.4% 10 Year 15 Year Since launch 2.9% Historical performance (Yearly) on absolute basis
Year Returns 2024 20.6% 2023 14.6% 2022 -35.6% 2021 -1.9% 2020 20.5% 2019 21.4% 2018 -10.3% 2017 14.6% 2016 -6.7% 2015 5.7% Fund Manager information for PGIM India Euro Equity Fund
Name Since Tenure Anandha Padmanabhan Anjeneyan 15 Feb 25 0.37 Yr. Vivek Sharma 15 Feb 25 0.37 Yr. Data below for PGIM India Euro Equity Fund as on 31 May 25
Asset Allocation
Asset Class Value Cash 3.44% Equity 96.56% Top Securities Holdings / Portfolio
Name Holding Value Quantity PGIM Jennison Emerging Mkts Eq USD W Acc
Investment Fund | -98% ₹154 Cr 166,882
↑ 61,229 Clearing Corporation Of India Ltd.
CBLO/Reverse Repo | -2% ₹3 Cr Net Receivables / (Payables)
Net Current Assets | -0% ₹0 Cr 5. HDFC Long Term Advantage Fund
CAGR/Annualized return of 21.4% since its launch. Ranked 23 in ELSS category. . HDFC Long Term Advantage Fund
Growth Launch Date 2 Jan 01 NAV (14 Jan 22) ₹595.168 ↑ 0.28 (0.05 %) Net Assets (Cr) ₹1,318 on 30 Nov 21 Category Equity - ELSS AMC HDFC Asset Management Company Limited Rating ☆☆☆ Risk Moderately High Expense Ratio 2.25 Sharpe Ratio 2.27 Information Ratio -0.15 Alpha Ratio 1.75 Min Investment 500 Min SIP Investment 500 Exit Load NIL Growth of 10,000 investment over the years.
Date Value 30 Jun 20 ₹10,000 30 Jun 21 ₹16,322
Purchase not allowed Returns for HDFC Long Term Advantage Fund
absolute basis & more than 1 year are on CAGR (Compound Annual Growth Rate) basis. as on 9 Jul 25 Duration Returns 1 Month 4.4% 3 Month 1.2% 6 Month 15.4% 1 Year 35.5% 3 Year 20.6% 5 Year 17.4% 10 Year 15 Year Since launch 21.4% Historical performance (Yearly) on absolute basis
Year Returns 2024 2023 2022 2021 2020 2019 2018 2017 2016 2015 Fund Manager information for HDFC Long Term Advantage Fund
Name Since Tenure Data below for HDFC Long Term Advantage Fund as on 30 Nov 21
Equity Sector Allocation
Sector Value Asset Allocation
Asset Class Value Top Securities Holdings / Portfolio
Name Holding Value Quantity
একক বিনিয়োগের সময় যে বিষয়গুলি বিবেচনা করা উচিত৷
মিউচুয়াল ফান্ডে বিনিয়োগ করার আগে ব্যক্তিদের অনেক পরামিতি যত্ন নিতে হবে। এটা অন্তর্ভুক্ত:
বাজারের টাইমিং
যখন একক বিনিয়োগের কথা আসে, তখন ব্যক্তিদের সর্বদা সন্ধান করতে হবেবাজার বিশেষ করে ইক্যুইটি-ভিত্তিক তহবিলের ক্ষেত্রে সময়। একক বিনিয়োগ করার একটি ভাল সময় হল যখন বাজারগুলি কম থাকে এবং একটি সুযোগ থাকে যে তারা শীঘ্রই প্রশংসা করতে শুরু করবে। যাইহোক, যদি বাজারগুলি ইতিমধ্যেই শীর্ষে থাকে তবে একক বিনিয়োগ থেকে দূরে থাকাই ভাল।
বৈচিত্রতা
বৈচিত্র্যও একটি গুরুত্বপূর্ণ দিক যা এককভাবে বিনিয়োগ করার আগে বিবেচনা করা প্রয়োজন। একমুঠো বিনিয়োগের ক্ষেত্রে ব্যক্তিদের একাধিক উপায়ে ছড়িয়ে দিয়ে তাদের বিনিয়োগকে বহুমুখী করা উচিত। এটি নিশ্চিত করতে সাহায্য করবে যে তাদের সামগ্রিক পোর্টফোলিওটি ভাল পারফরম্যান্স করে এমনকি যদি কোনও স্কিম কাজ না করে।
আপনার উদ্দেশ্য অনুযায়ী আপনার বিনিয়োগ করুন
ব্যক্তিরা যে কোনো বিনিয়োগ করে একটি নির্দিষ্ট লক্ষ্য অর্জনের জন্য। অতএব, ব্যক্তিদের চেক করা উচিত যে স্কিমের পদ্ধতির সাথে সামঞ্জস্যপূর্ণ কিনাবিনিয়োগকারীএর উদ্দেশ্য। এখানে, ব্যক্তিদের বিভিন্ন পরামিতি যেমন দেখতে হবেসিএজিআর স্কিমে বিনিয়োগ করার আগে রিটার্ন, সম্পূর্ণ আয়, করের প্রভাব এবং আরও অনেক কিছু।
খালাস সঠিক সময়ে করা উচিত
ব্যক্তি তাদের করা উচিতমুক্তি একক বিনিয়োগ সঠিক সময়ে. যদিও এটি এখনও বিনিয়োগের উদ্দেশ্য অনুযায়ী হতে পারে; ব্যক্তিদের উচিত যে স্কিমটিতে তারা বিনিয়োগ করার পরিকল্পনা করছে তার একটি সময়মত পর্যালোচনা করা। যাইহোক, তাদের আরও দীর্ঘ সময়ের জন্য তাদের বিনিয়োগ রাখতে হবে যাতে তারা সর্বাধিক সুবিধা উপভোগ করতে পারে।
মিউচুয়াল ফান্ড লাম্প সাম রিটার্ন ক্যালকুলেটর
মিউচুয়াল ফান্ডের একমুঠো রিটার্ন ক্যালকুলেটর ব্যক্তিদের দেখাতে সাহায্য করে যে কীভাবে একজন ব্যক্তির একক বিনিয়োগ একটি নির্দিষ্ট সময়সীমার মধ্যে বৃদ্ধি পায়। একমুঠো ক্যালকুলেটরে ইনপুট করতে যে ডেটা প্রয়োজন তার মধ্যে রয়েছে বিনিয়োগের মেয়াদ, প্রাথমিক বিনিয়োগের পরিমাণ, দীর্ঘমেয়াদী প্রত্যাশিত বৃদ্ধির হার এবং আরও অনেক কিছু। মিউচুয়াল ফান্ডের একমুঠো রিটার্ন ক্যালকুলেটরের একটি চিত্র নিম্নরূপ।
চিত্রণ
একমুঠো বিনিয়োগ: INR 25,000
বিনিয়োগের মেয়াদ: 15 বছর
দীর্ঘমেয়াদী বৃদ্ধির হার (প্রায়): 15%
লাম্প সাম ক্যালকুলেটর অনুযায়ী প্রত্যাশিত রিটার্ন: INR 2,03,427
বিনিয়োগে নিট লাভ: INR 1,78,427
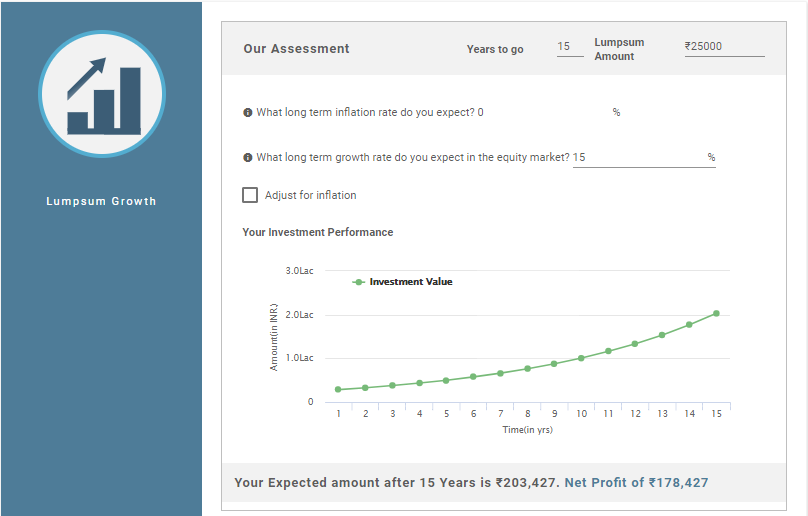
এইভাবে, উপরের গণনাটি দেখায় যে আপনার বিনিয়োগের উপর বিনিয়োগের নিট মুনাফা হল INR 1,78,427 যখন আপনার বিনিয়োগের মোট মূল্য হল INR 2,03,427.
মিউচুয়াল ফান্ডে এককালীন বিনিয়োগের সুবিধা এবং অসুবিধা
SIP-এর মতই, Lump Sum Investment-এরও নিজস্ব সুবিধা এবং অসুবিধা রয়েছে। সুতরাং, আসুন এই সুবিধা এবং অসুবিধাগুলি দেখুন।
সুবিধাদি
লাম্প সাম বিনিয়োগের সুবিধাগুলি নিম্নরূপ।
- বড় পরিমাণ বিনিয়োগ করুন: ব্যক্তিরা মিউচুয়াল ফান্ডে প্রচুর পরিমাণে বিনিয়োগ করতে পারে এবং তহবিল নিষ্ক্রিয় রাখার পরিবর্তে উচ্চতর রিটার্ন অর্জন করতে পারে।
- দীর্ঘমেয়াদী জন্য আদর্শ: বিনিয়োগের একক মোড দীর্ঘমেয়াদী বিনিয়োগের জন্য বিশেষত ইক্যুইটি তহবিলের ক্ষেত্রে ভাল। তবে, ঋণ তহবিলের ক্ষেত্রে, মেয়াদ স্বল্প বা মধ্যমেয়াদী হতে পারে
- সুবিধা: একক বিনিয়োগের মোড সুবিধাজনক কারণ অর্থপ্রদান শুধুমাত্র একবার করা হয় এবং নিয়মিত বিরতিতে কাটা হয় না।
অসুবিধা
একক বিনিয়োগের অসুবিধাগুলি হল:
- অনিয়মিত বিনিয়োগ: একমুঠো বিনিয়োগ একজন বিনিয়োগকারীর নিয়মিত সঞ্চয় নিশ্চিত করে না কারণ এটি নিয়মিত সঞ্চয়ের অভ্যাস তৈরি করে না।
- উচ্চ ঝুঁকি: একমুঠো বিনিয়োগে, সময়গুলি দেখা গুরুত্বপূর্ণ৷ এর কারণ একমুঠো মোডে বিনিয়োগ শুধুমাত্র একবার করা হয় এবং নিয়মিত বিরতিতে নয়। অতএব, যদি ব্যক্তিরা সময় বিবেচনা না করে, তাহলে তারা ক্ষতির সম্মুখীন হতে পারে।
উপসংহার
সুতরাং, উপরের পয়েন্টারগুলি থেকে, এটা বলা যেতে পারে যে একমুঠো মোডও মিউচুয়াল ফান্ডে বিনিয়োগ করার একটি ভাল উপায়। যাইহোক, স্কিমে একমুঠো পরিমাণ বিনিয়োগ করার সময় ব্যক্তিদের আত্মবিশ্বাসী হতে হবে। যদি না হয়, তারা বিনিয়োগের SIP মোড বেছে নিতে পারে। উপরন্তু, বিনিয়োগ করার আগে লোকেদের স্কিমের পদ্ধতিগুলি বোঝা উচিত। প্রয়োজন হলে, তারা এমনকি একটি পরামর্শ করতে পারেনআর্থিক উপদেষ্টা. এটি তাদের অর্থ নিরাপদ এবং তাদের উদ্দেশ্য যথাসময়ে সম্পন্ন হয়েছে তা নিশ্চিত করতে তাদের সাহায্য করবে.
এখানে প্রদত্ত তথ্য সঠিক কিনা তা নিশ্চিত করার জন্য সমস্ত প্রচেষ্টা করা হয়েছে। যাইহোক, তথ্যের সঠিকতা সম্পর্কে কোন গ্যারান্টি দেওয়া হয় না। কোনো বিনিয়োগ করার আগে স্কিমের তথ্য নথির সাথে যাচাই করুন।
You Might Also Like


AMFI Registration No. 112358 | CIN: U74999MH2016PTC282153
Shepard Technologies Pvt. Ltd. (with ARN code 112358) makes no warranties or representations, express or implied, on products offered through the platform. It accepts no liability for any damages or losses, however caused, in connection with the use of, or on the reliance of its product or related services. Terms and conditions of the website are applicable.
©2025 Shepard Technologies Private Limited. All Rights Reserved