മ്യൂച്വൽ ഫണ്ടുകളിലെ ലംപ് സം നിക്ഷേപം
നിങ്ങൾക്ക് ഒറ്റത്തവണ തുക നിക്ഷേപിക്കാമെന്ന് അറിയാമോമ്യൂച്വൽ ഫണ്ടുകൾ? ഉണ്ടെങ്കിൽ, അത് നല്ലതാണ്. എന്നിരുന്നാലും, ഇല്ലെങ്കിൽ, വിഷമിക്കേണ്ട. ഈ ലേഖനം അതേ വഴിയിലൂടെ നിങ്ങളെ നയിക്കും. ഒരു വ്യക്തി ഒറ്റത്തവണ മ്യൂച്വൽ ഫണ്ടുകളിൽ പണം നിക്ഷേപിക്കുന്ന സാഹചര്യത്തെയാണ് മ്യൂച്വൽ ഫണ്ടുകളിലെ ലംപ് സം നിക്ഷേപം സൂചിപ്പിക്കുന്നത്. ഇവിടെ പലതവണ നിക്ഷേപം നടക്കുന്നില്ല. തമ്മിൽ ഒരുപാട് വ്യത്യാസമുണ്ട്എസ്.ഐ.പി കൂടാതെ മൊത്തത്തിലുള്ള നിക്ഷേപ രീതിയും. അതിനാൽ, മ്യൂച്വൽ ഫണ്ടുകളിലെ ലംപ് സം നിക്ഷേപം എന്ന ആശയം നമുക്ക് മനസിലാക്കാം,മികച്ച മ്യൂച്വൽ ഫണ്ടുകൾ ഒറ്റത്തവണ നിക്ഷേപം, ലംപ് സം നിക്ഷേപ സമയത്ത് പരിഗണിക്കേണ്ട കാര്യങ്ങൾ, മ്യൂച്വൽ ഫണ്ട് ലംപ് സം റിട്ടേൺ കാൽക്കുലേറ്റർ, മറ്റ് അനുബന്ധ വശങ്ങൾ എന്നിവ ഈ ലേഖനത്തിലൂടെ.

മ്യൂച്വൽ ഫണ്ടുകളിലെ ലംപ് സം നിക്ഷേപം എന്നതുകൊണ്ട് നിങ്ങൾ എന്താണ് അർത്ഥമാക്കുന്നത്?
മ്യൂച്വൽ ഫണ്ടിലെ ലംപ് സം നിക്ഷേപം എന്നത് വ്യക്തികളുടെ ഒരു സാഹചര്യമാണ്മ്യൂച്വൽ ഫണ്ടുകളിൽ നിക്ഷേപിക്കുക ഒരിക്കൽ മാത്രം. എന്നിരുന്നാലും, വ്യക്തികൾ ചെറിയ തുകകൾ ലംപ് സം മോഡിൽ നിക്ഷേപിക്കുന്ന SIP രീതിക്ക് വിപരീതമായി, വ്യക്തികൾ ഗണ്യമായ തുക നിക്ഷേപിക്കുന്നു. മറ്റൊരു വിധത്തിൽ പറഞ്ഞാൽ, ഇത് ഒറ്റത്തവണ സാങ്കേതികതയാണ്നിക്ഷേപിക്കുന്നു മ്യൂച്വൽ ഫണ്ടുകളിൽ. അധിക ഫണ്ടുകളുള്ള നിക്ഷേപകർക്ക് അനുയോജ്യമായ നിക്ഷേപത്തിന്റെ മൊത്തത്തിലുള്ള നിക്ഷേപ രീതിബാങ്ക് അക്കൗണ്ട് കൂടാതെ കൂടുതൽ സമ്പാദിക്കാൻ ചാനലുകൾക്കായി നോക്കുന്നുവരുമാനം മ്യൂച്വൽ ഫണ്ടുകളിൽ നിക്ഷേപിക്കുന്നതിലൂടെ.
2022 - 2023 ലെ ലംപ് സം നിക്ഷേപത്തിനുള്ള മികച്ച മ്യൂച്വൽ ഫണ്ട്
ലംപ് സം മോഡിലൂടെ നിങ്ങൾ മ്യൂച്വൽ ഫണ്ടുകളിൽ നിക്ഷേപിക്കുന്നതിന് മുമ്പ്, വ്യക്തികൾ AUM, നിക്ഷേപ തുക എന്നിവയും അതിലേറെയും പോലുള്ള വിവിധ പാരാമീറ്ററുകൾ പരിഗണിക്കേണ്ടതുണ്ട്. അതിനാൽ, ഈ പാരാമീറ്ററുകളെ അടിസ്ഥാനമാക്കി ലംപ് സം നിക്ഷേപത്തിനുള്ള ചില മികച്ച മ്യൂച്വൽ ഫണ്ടുകൾ ഇനിപ്പറയുന്നവയാണ്.
ഇക്വിറ്റി മ്യൂച്വൽ ഫണ്ടുകളിലെ മികച്ച ലംപ് നിക്ഷേപം
ഇക്വിറ്റി ഫണ്ടുകൾ വിവിധ കമ്പനികളുടെ ഇക്വിറ്റി, ഇക്വിറ്റി സംബന്ധിയായ ഉപകരണങ്ങളിൽ അവരുടെ കോർപ്പസ് നിക്ഷേപിക്കുന്ന സ്കീമുകളാണ്. ദീർഘകാല നിക്ഷേപത്തിനുള്ള നല്ലൊരു ഓപ്ഷനായി ഈ സ്കീമുകൾ കണക്കാക്കപ്പെടുന്നു. വ്യക്തികൾക്ക് ഇക്വിറ്റി ഫണ്ടുകളിൽ മൊത്തത്തിലുള്ള തുക നിക്ഷേപിക്കാൻ കഴിയുമെങ്കിലും, ഇക്വിറ്റി ഫണ്ടുകളിൽ നിക്ഷേപിക്കുന്നതിനുള്ള ശുപാർശിത സാങ്കേതികത ഒന്നുകിൽ SIP വഴിയോ അല്ലെങ്കിൽസിസ്റ്റമാറ്റിക് ട്രാൻസ്ഫർ പ്ലാൻ (STP) മോഡ്. STP മോഡിൽ, വ്യക്തികൾ ആദ്യം ഗണ്യമായ പണം നിക്ഷേപിക്കുന്നുഡെറ്റ് ഫണ്ട് അതുപോലെലിക്വിഡ് ഫണ്ടുകൾ തുടർന്ന് ഇക്വിറ്റി ഫണ്ടുകളിൽ കൃത്യമായ ഇടവേളകളിൽ പണം കൈമാറ്റം ചെയ്യപ്പെടുന്നു. നിക്ഷേപത്തിനായി പരിഗണിക്കാവുന്ന ചില ഇക്വിറ്റി മ്യൂച്വൽ ഫണ്ടുകൾ ഇനിപ്പറയുന്നവയാണ്.
Fund NAV Net Assets (Cr) Min Investment 3 MO (%) 6 MO (%) 1 YR (%) 3 YR (%) 5 YR (%) 2024 (%) ICICI Prudential Infrastructure Fund Growth ₹194.78
↑ 1.57 ₹8,232 5,000 0.5 -0.5 0 23.9 30.4 27.4 Motilal Oswal Midcap 30 Fund Growth ₹100.406
↑ 1.27 ₹37,501 5,000 -5.6 -2.2 -12.6 23.3 28.4 57.1 SBI PSU Fund Growth ₹33.0142
↑ 0.32 ₹5,714 5,000 3.8 0.1 -0.3 26 28.3 23.5 HDFC Infrastructure Fund Growth ₹47.054
↑ 0.41 ₹2,586 5,000 -1.3 -3.1 -4.3 23.7 28 23 Nippon India Small Cap Fund Growth ₹165.332
↑ 1.11 ₹68,969 5,000 -3.2 -3.8 -10.1 20 27.8 26.1 Note: Returns up to 1 year are on absolute basis & more than 1 year are on CAGR basis. as on 12 Dec 25 Research Highlights & Commentary of 5 Funds showcased
Commentary ICICI Prudential Infrastructure Fund Motilal Oswal Midcap 30 Fund SBI PSU Fund HDFC Infrastructure Fund Nippon India Small Cap Fund Point 1 Lower mid AUM (₹8,232 Cr). Upper mid AUM (₹37,501 Cr). Bottom quartile AUM (₹5,714 Cr). Bottom quartile AUM (₹2,586 Cr). Highest AUM (₹68,969 Cr). Point 2 Oldest track record among peers (20 yrs). Established history (11+ yrs). Established history (15+ yrs). Established history (17+ yrs). Established history (15+ yrs). Point 3 Rating: 3★ (upper mid). Rating: 3★ (lower mid). Rating: 2★ (bottom quartile). Rating: 3★ (bottom quartile). Top rated. Point 4 Risk profile: High. Risk profile: Moderately High. Risk profile: High. Risk profile: High. Risk profile: Moderately High. Point 5 5Y return: 30.41% (top quartile). 5Y return: 28.39% (upper mid). 5Y return: 28.28% (lower mid). 5Y return: 27.97% (bottom quartile). 5Y return: 27.76% (bottom quartile). Point 6 3Y return: 23.91% (upper mid). 3Y return: 23.28% (bottom quartile). 3Y return: 25.95% (top quartile). 3Y return: 23.71% (lower mid). 3Y return: 20.00% (bottom quartile). Point 7 1Y return: -0.03% (top quartile). 1Y return: -12.62% (bottom quartile). 1Y return: -0.31% (upper mid). 1Y return: -4.25% (lower mid). 1Y return: -10.13% (bottom quartile). Point 8 Alpha: 0.00 (top quartile). Alpha: -4.22 (bottom quartile). Alpha: -0.58 (lower mid). Alpha: 0.00 (upper mid). Alpha: -2.66 (bottom quartile). Point 9 Sharpe: 0.00 (upper mid). Sharpe: -0.13 (lower mid). Sharpe: 0.09 (top quartile). Sharpe: -0.15 (bottom quartile). Sharpe: -0.35 (bottom quartile). Point 10 Information ratio: 0.00 (upper mid). Information ratio: 0.20 (top quartile). Information ratio: -0.57 (bottom quartile). Information ratio: 0.00 (lower mid). Information ratio: -0.11 (bottom quartile). ICICI Prudential Infrastructure Fund
Motilal Oswal Midcap 30 Fund
SBI PSU Fund
HDFC Infrastructure Fund
Nippon India Small Cap Fund
Talk to our investment specialist
ഡെറ്റ് മ്യൂച്വൽ ഫണ്ടുകളിലെ മികച്ച ലംപ് സം നിക്ഷേപം
ഡെറ്റ് ഫണ്ടുകൾ അവരുടെ ഫണ്ട് പണം വ്യത്യസ്തമായി നിക്ഷേപിക്കുന്നുസ്ഥിര വരുമാനം ട്രഷറി ബില്ലുകൾ, കോർപ്പറേറ്റ് തുടങ്ങിയ ഉപകരണങ്ങൾബോണ്ടുകൾ, അതോടൊപ്പം തന്നെ കുടുതല്. ഈ സ്കീമുകൾ ഹ്രസ്വ, ഇടത്തരം കാലയളവിനുള്ള ഒരു നല്ല ഓപ്ഷനായി കണക്കാക്കപ്പെടുന്നു. പല വ്യക്തികളും ഡെറ്റ് മ്യൂച്വൽ ഫണ്ടുകളിൽ ഒറ്റത്തവണ പണം നിക്ഷേപിക്കാൻ തിരഞ്ഞെടുക്കുന്നു. ചിലമികച്ച ഡെറ്റ് ഫണ്ടുകൾ ഒറ്റത്തവണ നിക്ഷേപത്തിനായി തിരഞ്ഞെടുക്കാവുന്നവ താഴെ പറയുന്നവയാണ്.
Fund NAV Net Assets (Cr) Min Investment 3 MO (%) 6 MO (%) 1 YR (%) 3 YR (%) 2024 (%) Debt Yield (YTM) Mod. Duration Eff. Maturity DSP Credit Risk Fund Growth ₹50.6533
↑ 0.01 ₹208 1,000 1.2 2.2 21 14.7 7.8 7.1% 2Y 29D 2Y 10M 24D Franklin India Credit Risk Fund Growth ₹25.3348
↑ 0.04 ₹104 5,000 2.9 5 7.5 11 0% Aditya Birla Sun Life Credit Risk Fund Growth ₹23.2386
↑ 0.01 ₹1,073 1,000 2.2 4.3 13.4 10.7 11.9 7.74% 2Y 1M 13D 3Y 1M 13D Aditya Birla Sun Life Medium Term Plan Growth ₹41.1214
↑ 0.01 ₹2,807 1,000 1.8 3.1 10.8 9.4 10.5 7.63% 3Y 8M 23D 5Y 29D Invesco India Credit Risk Fund Growth ₹1,978.41
↑ 0.19 ₹153 5,000 1.4 2.4 9.2 9.4 7.3 6.79% 2Y 3M 22D 3Y 29D Note: Returns up to 1 year are on absolute basis & more than 1 year are on CAGR basis. as on 12 Dec 25 Research Highlights & Commentary of 5 Funds showcased
Commentary DSP Credit Risk Fund Franklin India Credit Risk Fund Aditya Birla Sun Life Credit Risk Fund Aditya Birla Sun Life Medium Term Plan Invesco India Credit Risk Fund Point 1 Lower mid AUM (₹208 Cr). Bottom quartile AUM (₹104 Cr). Upper mid AUM (₹1,073 Cr). Highest AUM (₹2,807 Cr). Bottom quartile AUM (₹153 Cr). Point 2 Oldest track record among peers (22 yrs). Established history (14+ yrs). Established history (10+ yrs). Established history (16+ yrs). Established history (11+ yrs). Point 3 Top rated. Rating: 1★ (bottom quartile). Not Rated. Rating: 4★ (upper mid). Rating: 4★ (lower mid). Point 4 Risk profile: Moderate. Risk profile: Moderate. Risk profile: Moderate. Risk profile: Moderate. Risk profile: Moderate. Point 5 1Y return: 20.95% (top quartile). 1Y return: 7.45% (bottom quartile). 1Y return: 13.41% (upper mid). 1Y return: 10.81% (lower mid). 1Y return: 9.16% (bottom quartile). Point 6 1M return: 0.16% (bottom quartile). 1M return: 0.91% (top quartile). 1M return: 0.24% (lower mid). 1M return: 0.13% (bottom quartile). 1M return: 0.29% (upper mid). Point 7 Sharpe: 1.56 (lower mid). Sharpe: 0.29 (bottom quartile). Sharpe: 1.96 (upper mid). Sharpe: 2.04 (top quartile). Sharpe: 1.22 (bottom quartile). Point 8 Information ratio: 0.00 (top quartile). Information ratio: 0.00 (upper mid). Information ratio: 0.00 (lower mid). Information ratio: 0.00 (bottom quartile). Information ratio: 0.00 (bottom quartile). Point 9 Yield to maturity (debt): 7.10% (lower mid). Yield to maturity (debt): 0.00% (bottom quartile). Yield to maturity (debt): 7.74% (top quartile). Yield to maturity (debt): 7.63% (upper mid). Yield to maturity (debt): 6.79% (bottom quartile). Point 10 Modified duration: 2.08 yrs (upper mid). Modified duration: 0.00 yrs (top quartile). Modified duration: 2.12 yrs (lower mid). Modified duration: 3.73 yrs (bottom quartile). Modified duration: 2.31 yrs (bottom quartile). DSP Credit Risk Fund
Franklin India Credit Risk Fund
Aditya Birla Sun Life Credit Risk Fund
Aditya Birla Sun Life Medium Term Plan
Invesco India Credit Risk Fund
ലംപ് സം നിക്ഷേപത്തിനുള്ള മികച്ച ഹൈബ്രിഡ് ഫണ്ടുകൾ
ഹൈബ്രിഡ് ഫണ്ടുകൾ എന്നും അറിയപ്പെടുന്നുബാലൻസ്ഡ് ഫണ്ട് ഇക്വിറ്റിയിലും സ്ഥിരവരുമാനത്തിലും അവരുടെ പണം നിക്ഷേപിക്കുക. ഈ സ്കീമുകൾ തിരയുന്ന വ്യക്തികൾക്ക് അനുയോജ്യമാണ്മൂലധനം സ്ഥിരവരുമാനത്തിനൊപ്പം തലമുറ. സമതുലിതമായ സ്കീമുകൾ എന്നും അറിയപ്പെടുന്നു, വ്യക്തികൾക്ക് ഹൈബ്രിഡ് സ്കീമുകളിൽ ഒറ്റത്തവണ തുക നിക്ഷേപിക്കാൻ തിരഞ്ഞെടുക്കാം. ഒറ്റത്തവണ നിക്ഷേപത്തിനുള്ള ഏറ്റവും മികച്ച ചില ഹൈബ്രിഡ് ഫണ്ടുകൾ ചുവടെ പട്ടികപ്പെടുത്തിയിരിക്കുന്നു.
Fund NAV Net Assets (Cr) Min Investment 3 MO (%) 6 MO (%) 1 YR (%) 3 YR (%) 5 YR (%) 2024 (%) UTI Multi Asset Fund Growth ₹79.0799
↑ 0.59 ₹6,376 5,000 4 5.9 8 19.1 15.2 20.7 ICICI Prudential Multi-Asset Fund Growth ₹809.221
↑ 3.10 ₹71,900 5,000 4.8 6.8 13.8 19 21.8 16.1 ICICI Prudential Equity and Debt Fund Growth ₹410.41
↑ 1.94 ₹48,071 5,000 2.7 5.9 10.3 18.9 22.1 17.2 SBI Multi Asset Allocation Fund Growth ₹64.8124
↑ 0.38 ₹11,306 5,000 6.9 8.9 14.3 17.4 14.7 12.8 HDFC Balanced Advantage Fund Growth ₹532.27
↑ 2.49 ₹106,494 5,000 2.5 1.7 3.7 17.2 19.8 16.7 Note: Returns up to 1 year are on absolute basis & more than 1 year are on CAGR basis. as on 12 Dec 25 Research Highlights & Commentary of 5 Funds showcased
Commentary UTI Multi Asset Fund ICICI Prudential Multi-Asset Fund ICICI Prudential Equity and Debt Fund SBI Multi Asset Allocation Fund HDFC Balanced Advantage Fund Point 1 Bottom quartile AUM (₹6,376 Cr). Upper mid AUM (₹71,900 Cr). Lower mid AUM (₹48,071 Cr). Bottom quartile AUM (₹11,306 Cr). Highest AUM (₹106,494 Cr). Point 2 Established history (17+ yrs). Established history (23+ yrs). Oldest track record among peers (26 yrs). Established history (19+ yrs). Established history (25+ yrs). Point 3 Rating: 1★ (bottom quartile). Rating: 2★ (bottom quartile). Top rated. Rating: 4★ (upper mid). Rating: 4★ (lower mid). Point 4 Risk profile: Moderately High. Risk profile: Moderately High. Risk profile: Moderately High. Risk profile: Moderate. Risk profile: Moderately High. Point 5 5Y return: 15.19% (bottom quartile). 5Y return: 21.78% (upper mid). 5Y return: 22.12% (top quartile). 5Y return: 14.69% (bottom quartile). 5Y return: 19.79% (lower mid). Point 6 3Y return: 19.08% (top quartile). 3Y return: 18.97% (upper mid). 3Y return: 18.92% (lower mid). 3Y return: 17.45% (bottom quartile). 3Y return: 17.24% (bottom quartile). Point 7 1Y return: 8.03% (bottom quartile). 1Y return: 13.82% (upper mid). 1Y return: 10.34% (lower mid). 1Y return: 14.30% (top quartile). 1Y return: 3.69% (bottom quartile). Point 8 1M return: 0.64% (lower mid). 1M return: 0.99% (upper mid). 1M return: 0.44% (bottom quartile). 1M return: 1.87% (top quartile). 1M return: -0.33% (bottom quartile). Point 9 Alpha: 0.00 (upper mid). Alpha: 0.00 (lower mid). Alpha: 2.46 (top quartile). Alpha: 0.00 (bottom quartile). Alpha: 0.00 (bottom quartile). Point 10 Sharpe: 0.24 (bottom quartile). Sharpe: 0.86 (top quartile). Sharpe: 0.36 (lower mid). Sharpe: 0.70 (upper mid). Sharpe: -0.02 (bottom quartile). UTI Multi Asset Fund
ICICI Prudential Multi-Asset Fund
ICICI Prudential Equity and Debt Fund
SBI Multi Asset Allocation Fund
HDFC Balanced Advantage Fund
ലംപ് സം നിക്ഷേപത്തിനുള്ള മികച്ച ഇൻഡെക്സ് ഫണ്ടുകൾ
ഒരു സൂചിക ഫണ്ടിന്റെ പോർട്ട്ഫോളിയോയിൽ ഓഹരികളും മറ്റ് ഉപകരണങ്ങളും സൂചികയിലുള്ള അതേ അനുപാതത്തിൽ അടങ്ങിയിരിക്കുന്നു. മറ്റൊരു വിധത്തിൽ പറഞ്ഞാൽ, ഈ സ്കീമുകൾ ഒരു സൂചികയുടെ പ്രകടനത്തെ അനുകരിക്കുന്നു. ഇവ നിഷ്ക്രിയമായി കൈകാര്യം ചെയ്യപ്പെടുന്ന ഫണ്ടുകളാണ്, ഒറ്റത്തവണ നിക്ഷേപത്തിനുള്ള നല്ലൊരു ഓപ്ഷനായി ഇതിനെ കണക്കാക്കാം. മികച്ച ചിലത്ഇൻഡെക്സ് ഫണ്ടുകൾ ഒറ്റത്തവണ നിക്ഷേപത്തിനായി തിരഞ്ഞെടുക്കാവുന്നവ താഴെ പറയുന്നവയാണ്.
Fund NAV Net Assets (Cr) 3 MO (%) 6 MO (%) 1 YR (%) 3 YR (%) 5 YR (%) 2024 (%) Nippon India Index Fund - Sensex Plan Growth ₹43.436
↑ 0.23 ₹957 4 3.2 4.8 11.6 13.6 8.9 LIC MF Index Fund Sensex Growth ₹159.378
↑ 0.83 ₹92 4 4.4 4.9 11.3 13.2 8.2 Franklin India Index Fund Nifty Plan Growth ₹210.351
↑ 1.19 ₹775 3.8 5.1 6.9 12.6 14.5 9.5 IDBI Nifty Index Fund Growth ₹36.2111
↓ -0.02 ₹208 9.1 11.9 16.2 20.3 11.7 Nippon India Index Fund - Nifty Plan Growth ₹44.2411
↑ 0.25 ₹2,864 3.6 3.5 5.9 12.5 14.3 9.4 Note: Returns up to 1 year are on absolute basis & more than 1 year are on CAGR basis. as on 12 Dec 25 Research Highlights & Commentary of 5 Funds showcased
Commentary Nippon India Index Fund - Sensex Plan LIC MF Index Fund Sensex Franklin India Index Fund Nifty Plan IDBI Nifty Index Fund Nippon India Index Fund - Nifty Plan Point 1 Upper mid AUM (₹957 Cr). Bottom quartile AUM (₹92 Cr). Lower mid AUM (₹775 Cr). Bottom quartile AUM (₹208 Cr). Highest AUM (₹2,864 Cr). Point 2 Established history (15+ yrs). Established history (23+ yrs). Oldest track record among peers (25 yrs). Established history (15+ yrs). Established history (15+ yrs). Point 3 Top rated. Rating: 1★ (upper mid). Rating: 1★ (lower mid). Rating: 1★ (bottom quartile). Rating: 1★ (bottom quartile). Point 4 Risk profile: Moderately High. Risk profile: Moderately High. Risk profile: Moderately High. Risk profile: Moderately High. Risk profile: Moderately High. Point 5 5Y return: 13.62% (lower mid). 5Y return: 13.20% (bottom quartile). 5Y return: 14.53% (top quartile). 5Y return: 11.74% (bottom quartile). 5Y return: 14.33% (upper mid). Point 6 3Y return: 11.61% (bottom quartile). 3Y return: 11.32% (bottom quartile). 3Y return: 12.65% (upper mid). 3Y return: 20.28% (top quartile). 3Y return: 12.51% (lower mid). Point 7 1Y return: 4.76% (bottom quartile). 1Y return: 4.94% (bottom quartile). 1Y return: 6.85% (upper mid). 1Y return: 16.16% (top quartile). 1Y return: 5.91% (lower mid). Point 8 1M return: 1.07% (upper mid). 1M return: 0.86% (lower mid). 1M return: 0.68% (bottom quartile). 1M return: 3.68% (top quartile). 1M return: 0.75% (bottom quartile). Point 9 Alpha: -0.50 (upper mid). Alpha: -1.15 (bottom quartile). Alpha: -0.59 (lower mid). Alpha: -1.03 (bottom quartile). Alpha: -0.48 (top quartile). Point 10 Sharpe: 0.07 (bottom quartile). Sharpe: 0.01 (bottom quartile). Sharpe: 0.11 (lower mid). Sharpe: 1.04 (top quartile). Sharpe: 0.12 (upper mid). Nippon India Index Fund - Sensex Plan
LIC MF Index Fund Sensex
Franklin India Index Fund Nifty Plan
IDBI Nifty Index Fund
Nippon India Index Fund - Nifty Plan
കഴിഞ്ഞ ഒരു മാസത്തെ അടിസ്ഥാനമാക്കിയുള്ള മികച്ച മ്യൂച്വൽ ഫണ്ടുകൾ
"The primary investment objective of the Scheme is to seek capital appreciation by investing predominantly in units of MLIIF - WGF. The Scheme may, at the discretion of the Investment Manager, also invest in the units of other similar overseas mutual fund schemes, which may constitute a significant part of its corpus. The Scheme may also invest a certain portion of its corpus in money market securities and/or units of money market/liquid schemes of DSP Merrill Lynch Mutual Fund, in order to meet liquidity requirements from time to time. However, there is no assurance that the investment objective of the Scheme will be realized." Below is the key information for DSP World Gold Fund Returns up to 1 year are on The primary investment objective of the Scheme is to seek capital appreciation by investing predominantly in the units of BlackRock Global Funds – World Mining Fund. The Scheme may, at the discretion of the Investment Manager, also invest in the units of other similar overseas mutual fund schemes, which may
constitute a significant part of its corpus. The Scheme may also invest a certain portion of its corpus in money market securities and/or money market/liquid schemes of DSP BlackRock Mutual Fund, in order to meet liquidity requirements from time to time. Research Highlights for DSP World Mining Fund Below is the key information for DSP World Mining Fund Returns up to 1 year are on ICICI Prudential Regular Gold Savings Fund (the Scheme) is a fund of funds scheme with the primary objective to generate returns by investing in units of ICICI Prudential Gold Exchange Traded Fund (IPru Gold ETF).
However, there can be no assurance that the investment objectives of the Scheme will be realized. Research Highlights for ICICI Prudential Regular Gold Savings Fund Below is the key information for ICICI Prudential Regular Gold Savings Fund Returns up to 1 year are on The investment objective of the scheme is to generate returns by investing in units of Kotak Gold Exchange Traded Fund. Research Highlights for Kotak Gold Fund Below is the key information for Kotak Gold Fund Returns up to 1 year are on The investment objective of ICICI Prudential US Bluechip Equity Fund is to provide long term capital appreciation to investors by primarily investing in equity and equity related securities (including ADRs/GDRs issued by Indian and foreign companies) of companies listed on New York Stock Exchange and/or NASDAQ. However, there can be no assurance that the investment objective of the Scheme will be realized. Research Highlights for ICICI Prudential US Bluechip Equity Fund Below is the key information for ICICI Prudential US Bluechip Equity Fund Returns up to 1 year are on 1. DSP World Gold Fund
DSP World Gold Fund
Growth Launch Date 14 Sep 07 NAV (11 Dec 25) ₹51.4804 ↑ 1.81 (3.64 %) Net Assets (Cr) ₹1,498 on 31 Oct 25 Category Equity - Global AMC DSP BlackRock Invmt Managers Pvt. Ltd. Rating ☆☆☆ Risk High Expense Ratio 1.41 Sharpe Ratio 1.83 Information Ratio -1.04 Alpha Ratio -4.16 Min Investment 1,000 Min SIP Investment 500 Exit Load 0-12 Months (1%),12 Months and above(NIL) Growth of 10,000 investment over the years.
Date Value 30 Nov 20 ₹10,000 30 Nov 21 ₹9,903 30 Nov 22 ₹8,659 30 Nov 23 ₹9,599 30 Nov 24 ₹12,026 30 Nov 25 ₹27,573 Returns for DSP World Gold Fund
absolute basis & more than 1 year are on CAGR (Compound Annual Growth Rate) basis. as on 11 Dec 25 Duration Returns 1 Month 14% 3 Month 27.4% 6 Month 70% 1 Year 132.4% 3 Year 47.2% 5 Year 22.4% 10 Year 15 Year Since launch 9.4% Historical performance (Yearly) on absolute basis
Year Returns 2024 15.9% 2023 7% 2022 -7.7% 2021 -9% 2020 31.4% 2019 35.1% 2018 -10.7% 2017 -4% 2016 52.7% 2015 -18.5% Fund Manager information for DSP World Gold Fund
Name Since Tenure Jay Kothari 1 Mar 13 12.68 Yr. Data below for DSP World Gold Fund as on 31 Oct 25
Equity Sector Allocation
Sector Value Basic Materials 95.15% Asset Allocation
Asset Class Value Cash 2.29% Equity 95.15% Debt 0.02% Other 2.54% Top Securities Holdings / Portfolio
Name Holding Value Quantity BGF World Gold I2
Investment Fund | -75% ₹1,127 Cr 1,347,933
↓ -108,097 VanEck Gold Miners ETF
- | GDX24% ₹367 Cr 573,719 Treps / Reverse Repo Investments
CBLO/Reverse Repo | -2% ₹23 Cr Net Receivables/Payables
Net Current Assets | -1% -₹20 Cr 2. DSP World Mining Fund
DSP World Mining Fund
Growth Launch Date 29 Dec 09 NAV (11 Dec 25) ₹25.6059 ↑ 0.68 (2.73 %) Net Assets (Cr) ₹169 on 31 Oct 25 Category Equity - Global AMC DSP BlackRock Invmt Managers Pvt. Ltd. Rating ☆☆☆ Risk High Expense Ratio 1.14 Sharpe Ratio 1.28 Information Ratio 0 Alpha Ratio 0 Min Investment 1,000 Min SIP Investment 500 Exit Load 0-12 Months (1%),12 Months and above(NIL) Growth of 10,000 investment over the years.
Date Value 30 Nov 20 ₹10,000 30 Nov 21 ₹12,339 30 Nov 22 ₹14,572 30 Nov 23 ₹13,637 30 Nov 24 ₹14,706 30 Nov 25 ₹21,988 Returns for DSP World Mining Fund
absolute basis & more than 1 year are on CAGR (Compound Annual Growth Rate) basis. as on 11 Dec 25 Duration Returns 1 Month 10% 3 Month 22.4% 6 Month 49.7% 1 Year 56.1% 3 Year 15.1% 5 Year 16.3% 10 Year 15 Year Since launch 6.1% Historical performance (Yearly) on absolute basis
Year Returns 2024 -8.1% 2023 0% 2022 12.2% 2021 18% 2020 34.9% 2019 21.5% 2018 -9.4% 2017 21.1% 2016 49.7% 2015 -36% Fund Manager information for DSP World Mining Fund
Name Since Tenure Jay Kothari 1 Mar 13 12.68 Yr. Data below for DSP World Mining Fund as on 31 Oct 25
Equity Sector Allocation
Sector Value Basic Materials 96.18% Energy 1.1% Asset Allocation
Asset Class Value Cash 2.35% Equity 97.28% Debt 0.01% Other 0.36% Top Securities Holdings / Portfolio
Name Holding Value Quantity BGF World Mining I2
Investment Fund | -99% ₹167 Cr 193,620
↓ -1,404 Treps / Reverse Repo Investments
CBLO/Reverse Repo | -1% ₹2 Cr Net Receivables/Payables
Net Current Assets | -0% ₹0 Cr 3. ICICI Prudential Regular Gold Savings Fund
ICICI Prudential Regular Gold Savings Fund
Growth Launch Date 11 Oct 11 NAV (12 Dec 25) ₹40.8636 ↑ 0.91 (2.28 %) Net Assets (Cr) ₹3,770 on 31 Oct 25 Category Gold - Gold AMC ICICI Prudential Asset Management Company Limited Rating ☆ Risk Moderately High Expense Ratio 0.38 Sharpe Ratio 2.38 Information Ratio 0 Alpha Ratio 0 Min Investment 5,000 Min SIP Investment 100 Exit Load 0-15 Months (2%),15 Months and above(NIL) Growth of 10,000 investment over the years.
Date Value 30 Nov 20 ₹10,000 30 Nov 21 ₹9,688 30 Nov 22 ₹10,449 30 Nov 23 ₹12,281 30 Nov 24 ₹14,858 30 Nov 25 ₹24,046 Returns for ICICI Prudential Regular Gold Savings Fund
absolute basis & more than 1 year are on CAGR (Compound Annual Growth Rate) basis. as on 11 Dec 25 Duration Returns 1 Month 6.7% 3 Month 20% 6 Month 34.4% 1 Year 66.8% 3 Year 33.1% 5 Year 20.3% 10 Year 15 Year Since launch 10.4% Historical performance (Yearly) on absolute basis
Year Returns 2024 19.5% 2023 13.5% 2022 12.7% 2021 -5.4% 2020 26.6% 2019 22.7% 2018 7.4% 2017 0.8% 2016 8.9% 2015 -5.1% Fund Manager information for ICICI Prudential Regular Gold Savings Fund
Name Since Tenure Manish Banthia 27 Sep 12 13.1 Yr. Nishit Patel 29 Dec 20 4.84 Yr. Ashwini Bharucha 1 Nov 25 0 Yr. Venus Ahuja 1 Nov 25 0 Yr. Data below for ICICI Prudential Regular Gold Savings Fund as on 31 Oct 25
Asset Allocation
Asset Class Value Cash 1.4% Other 98.6% Top Securities Holdings / Portfolio
Name Holding Value Quantity ICICI Pru Gold ETF
- | -100% ₹3,768 Cr 364,653,102
↑ 33,144,958 Treps
CBLO/Reverse Repo | -1% ₹23 Cr Net Current Assets
Net Current Assets | -1% -₹21 Cr 4. Kotak Gold Fund
Kotak Gold Fund
Growth Launch Date 25 Mar 11 NAV (12 Dec 25) ₹50.6768 ↑ 1.21 (2.44 %) Net Assets (Cr) ₹4,540 on 31 Oct 25 Category Gold - Gold AMC Kotak Mahindra Asset Management Co Ltd Rating ☆ Risk Moderately High Expense Ratio 0.5 Sharpe Ratio 2.49 Information Ratio 0 Alpha Ratio 0 Min Investment 5,000 Min SIP Investment 1,000 Exit Load 0-6 Months (2%),6-12 Months (1%),12 Months and above(NIL) Growth of 10,000 investment over the years.
Date Value 30 Nov 20 ₹10,000 30 Nov 21 ₹9,788 30 Nov 22 ₹10,506 30 Nov 23 ₹12,325 30 Nov 24 ₹14,831 30 Nov 25 ₹23,984 Returns for Kotak Gold Fund
absolute basis & more than 1 year are on CAGR (Compound Annual Growth Rate) basis. as on 11 Dec 25 Duration Returns 1 Month 6.5% 3 Month 20.1% 6 Month 34.3% 1 Year 66% 3 Year 32.8% 5 Year 20.1% 10 Year 15 Year Since launch 11.7% Historical performance (Yearly) on absolute basis
Year Returns 2024 18.9% 2023 13.9% 2022 11.7% 2021 -4.7% 2020 26.6% 2019 24.1% 2018 7.3% 2017 2.5% 2016 10.2% 2015 -8.4% Fund Manager information for Kotak Gold Fund
Name Since Tenure Abhishek Bisen 25 Mar 11 14.62 Yr. Jeetu Sonar 1 Oct 22 3.09 Yr. Data below for Kotak Gold Fund as on 31 Oct 25
Asset Allocation
Asset Class Value Cash 1.51% Other 98.49% Top Securities Holdings / Portfolio
Name Holding Value Quantity Kotak Gold ETF
- | -100% ₹4,540 Cr 450,546,713
↑ 18,692,026 Net Current Assets/(Liabilities)
Net Current Assets | -0% -₹10 Cr Triparty Repo
CBLO/Reverse Repo | -0% ₹9 Cr 5. ICICI Prudential US Bluechip Equity Fund
ICICI Prudential US Bluechip Equity Fund
Growth Launch Date 6 Jul 12 NAV (11 Dec 25) ₹73.37 ↑ 0.74 (1.02 %) Net Assets (Cr) ₹3,396 on 31 Oct 25 Category Equity - Global AMC ICICI Prudential Asset Management Company Limited Rating ☆☆☆☆ Risk High Expense Ratio 2.06 Sharpe Ratio 0.4 Information Ratio -0.95 Alpha Ratio -10.82 Min Investment 5,000 Min SIP Investment 100 Exit Load 0-3 Months (3%),3-12 Months (1%),12 Months and above(NIL) Growth of 10,000 investment over the years.
Date Value 30 Nov 20 ₹10,000 30 Nov 21 ₹11,976 30 Nov 22 ₹12,082 30 Nov 23 ₹13,954 30 Nov 24 ₹17,192 30 Nov 25 ₹18,875 Returns for ICICI Prudential US Bluechip Equity Fund
absolute basis & more than 1 year are on CAGR (Compound Annual Growth Rate) basis. as on 11 Dec 25 Duration Returns 1 Month 5.9% 3 Month 7.9% 6 Month 18.1% 1 Year 13.3% 3 Year 18.5% 5 Year 14% 10 Year 15 Year Since launch 16% Historical performance (Yearly) on absolute basis
Year Returns 2024 10.4% 2023 30.6% 2022 -7.1% 2021 22.5% 2020 18.6% 2019 34.3% 2018 5.2% 2017 14.1% 2016 11.6% 2015 0.7% Fund Manager information for ICICI Prudential US Bluechip Equity Fund
Name Since Tenure Ritesh Lunawat 13 Sep 24 1.13 Yr. Sharmila D’mello 1 Jul 22 3.34 Yr. Nitya Mishra 4 Nov 24 0.99 Yr. Data below for ICICI Prudential US Bluechip Equity Fund as on 31 Oct 25
Equity Sector Allocation
Sector Value Health Care 25.21% Technology 17.74% Consumer Defensive 17.05% Industrials 16.53% Financial Services 7.76% Communication Services 4.94% Consumer Cyclical 4.75% Basic Materials 2.92% Energy 0.51% Asset Allocation
Asset Class Value Cash 2.58% Equity 97.42% Top Securities Holdings / Portfolio
Name Holding Value Quantity Huntington Ingalls Industries Inc (Industrials)
Equity, Since 29 Feb 24 | HII3% ₹109 Cr 38,068
↓ -611 Alphabet Inc Class C (Communication Services)
Equity, Since 31 Jan 18 | GOOG3% ₹103 Cr 41,278
↓ -4,700 The Estee Lauder Companies Inc Class A (Consumer Defensive)
Equity, Since 30 Jun 23 | EL3% ₹99 Cr 115,367 Agilent Technologies Inc (Healthcare)
Equity, Since 30 Jun 23 | A3% ₹98 Cr 75,728 West Pharmaceutical Services Inc (Healthcare)
Equity, Since 31 Dec 24 | WST3% ₹93 Cr 37,138
↓ -3,500 Thermo Fisher Scientific Inc (Healthcare)
Equity, Since 31 Dec 23 | TMO3% ₹89 Cr 17,720 Zimmer Biomet Holdings Inc (Healthcare)
Equity, Since 31 Mar 17 | ZBH2% ₹84 Cr 93,999 Bristol-Myers Squibb Co (Healthcare)
Equity, Since 31 Dec 23 | BMY2% ₹83 Cr 202,849
↑ 21,000 U.S. Bancorp (Financial Services)
Equity, Since 31 Mar 23 | USB2% ₹80 Cr 194,027 Merck & Co Inc (Healthcare)
Equity, Since 31 Dec 24 | MRK2% ₹80 Cr 105,300
ഒറ്റത്തവണ നിക്ഷേപം നടത്തുമ്പോൾ ശ്രദ്ധിക്കേണ്ട കാര്യങ്ങൾ
മ്യൂച്വൽ ഫണ്ടുകളിൽ നിക്ഷേപിക്കുന്നതിന് മുമ്പ് വ്യക്തികൾ ധാരാളം പാരാമീറ്ററുകൾ ശ്രദ്ധിക്കേണ്ടതുണ്ട്. ഇതിൽ ഉൾപ്പെടുന്നു:
മാർക്കറ്റ് സമയം
ഒറ്റത്തവണ നിക്ഷേപത്തിന്റെ കാര്യം വരുമ്പോൾ, വ്യക്തികൾ എപ്പോഴും അന്വേഷിക്കേണ്ടതുണ്ട്വിപണി പ്രത്യേകിച്ച് ഇക്വിറ്റി അധിഷ്ഠിത ഫണ്ടുകളുമായി ബന്ധപ്പെട്ട സമയങ്ങൾ. ഒറ്റത്തവണ നിക്ഷേപം നടത്താനുള്ള നല്ല സമയമാണ് വിപണികൾ താഴ്ന്നതും ഉടൻ തന്നെ അവർ വിലമതിക്കാൻ തുടങ്ങുന്നതും. എന്നിരുന്നാലും, വിപണികൾ ഇതിനകം ഏറ്റവും ഉയർന്ന നിലയിലാണെങ്കിൽ, ഒറ്റത്തവണ നിക്ഷേപത്തിൽ നിന്ന് വിട്ടുനിൽക്കുന്നതാണ് നല്ലത്.
വൈവിധ്യവൽക്കരണം
ഒറ്റത്തവണ നിക്ഷേപിക്കുന്നതിന് മുമ്പ് പരിഗണിക്കേണ്ട ഒരു പ്രധാന വശം കൂടിയാണ് വൈവിധ്യവൽക്കരണം. ഒറ്റത്തവണ നിക്ഷേപം നടത്തുന്ന വ്യക്തികൾ ഒന്നിലധികം വഴികളിലേക്ക് വ്യാപിച്ചുകൊണ്ട് അവരുടെ നിക്ഷേപം വൈവിധ്യവത്കരിക്കണം. സ്കീമുകളിലൊന്ന് പ്രവർത്തിക്കുന്നില്ലെങ്കിൽപ്പോലും അവരുടെ മൊത്തത്തിലുള്ള പോർട്ട്ഫോളിയോ നന്നായി പ്രവർത്തിക്കുന്നുവെന്ന് ഉറപ്പാക്കാൻ ഇത് സഹായിക്കും.
നിങ്ങളുടെ ലക്ഷ്യം അനുസരിച്ച് നിങ്ങളുടെ നിക്ഷേപം നടത്തുക
വ്യക്തികൾ ചെയ്യുന്ന ഏതൊരു നിക്ഷേപവും ഒരു പ്രത്യേക ലക്ഷ്യം കൈവരിക്കാനാണ്. അതിനാൽ, സ്കീമിന്റെ സമീപനം യോജിച്ചതാണോ എന്ന് വ്യക്തികൾ പരിശോധിക്കണംനിക്ഷേപകൻന്റെ ലക്ഷ്യം. ഇവിടെ, വ്യക്തികൾ വിവിധ പാരാമീറ്ററുകൾക്കായി നോക്കണംസിഎജിആർ സ്കീമിൽ നിക്ഷേപിക്കുന്നതിന് മുമ്പുള്ള വരുമാനം, സമ്പൂർണ്ണ വരുമാനം, നികുതിയുടെ സ്വാധീനം എന്നിവയും അതിലേറെയും.
ശരിയായ സമയത്ത് വീണ്ടെടുക്കൽ നടത്തണം
വ്യക്തികൾ അവരുടെ കാര്യം ചെയ്യണംമോചനം കൃത്യമായ സമയത്ത് ഒറ്റത്തവണ നിക്ഷേപം. നിക്ഷേപലക്ഷ്യം അനുസരിച്ച് ഇത് സാധ്യമാണെങ്കിലും; വ്യക്തികൾ അവർ നിക്ഷേപിക്കാൻ ഉദ്ദേശിക്കുന്ന സ്കീമിനെക്കുറിച്ച് സമയബന്ധിതമായി അവലോകനം ചെയ്യണം. എന്നിരുന്നാലും, അവർക്ക് പരമാവധി ആനുകൂല്യങ്ങൾ ആസ്വദിക്കാൻ കഴിയുന്ന തരത്തിൽ ദീർഘകാലത്തേക്ക് നിക്ഷേപം നിലനിർത്തേണ്ടതുണ്ട്.
മ്യൂച്വൽ ഫണ്ട് ലംപ് സം റിട്ടേൺ കാൽക്കുലേറ്റർ
മ്യൂച്വൽ ഫണ്ട് ലംപ് സം റിട്ടേൺ കാൽക്കുലേറ്റർ ഒരു വ്യക്തിയുടെ ലംപ് സം നിക്ഷേപം ഒരു നിശ്ചിത സമയപരിധിയിൽ എങ്ങനെ വളരുന്നു എന്ന് കാണിക്കാൻ വ്യക്തികളെ സഹായിക്കുന്നു. ലംപ് സം കാൽക്കുലേറ്ററിൽ ഇൻപുട്ട് ചെയ്യേണ്ട ചില ഡാറ്റയിൽ നിക്ഷേപത്തിന്റെ കാലാവധി, പ്രാരംഭ നിക്ഷേപ തുക, ദീർഘകാല പ്രതീക്ഷിക്കുന്ന വളർച്ചാ നിരക്ക് എന്നിവയും അതിലേറെയും ഉൾപ്പെടുന്നു. മ്യൂച്വൽ ഫണ്ട് ലംപ്സം റിട്ടേൺ കാൽക്കുലേറ്ററിന്റെ ഒരു ചിത്രീകരണം ഇനിപ്പറയുന്നതാണ്.
ചിത്രീകരണം
ലംപ് സം നിക്ഷേപം: 25 രൂപ,000
നിക്ഷേപ കാലാവധി: 15 വർഷം
ദീർഘകാല വളർച്ചാ നിരക്ക് (ഏകദേശം): 15%
ലംപ് സം കാൽക്കുലേറ്റർ അനുസരിച്ച് പ്രതീക്ഷിക്കുന്ന വരുമാനം: 2,03,427 രൂപ
നിക്ഷേപത്തിലെ അറ്റാദായം: 1,78,427 രൂപ
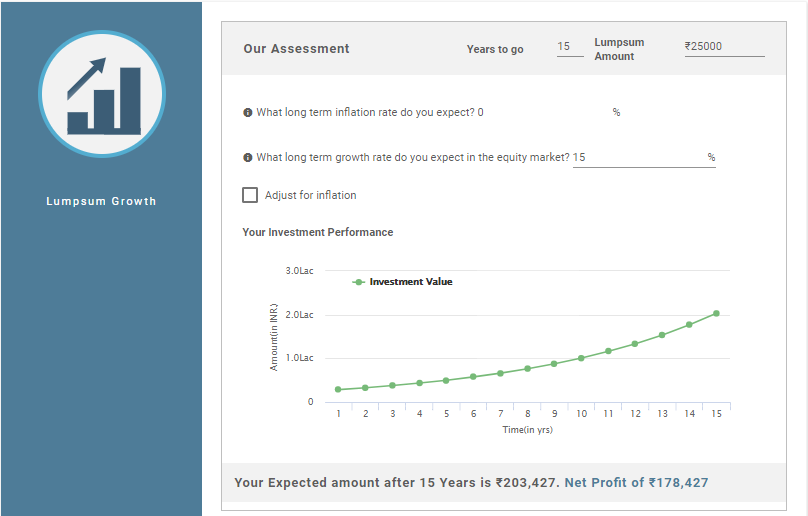
അതിനാൽ, മുകളിലെ കണക്കുകൂട്ടൽ കാണിക്കുന്നത് നിങ്ങളുടെ നിക്ഷേപത്തിലെ നിക്ഷേപത്തിന്റെ അറ്റാദായം 1,78,427 രൂപയാണെന്നും നിങ്ങളുടെ നിക്ഷേപത്തിന്റെ ആകെ മൂല്യം 2,03,427 രൂപയാണെന്നും ആണ്..
മ്യൂച്വൽ ഫണ്ടിലെ ഒറ്റത്തവണ നിക്ഷേപത്തിന്റെ ഗുണങ്ങളും ദോഷങ്ങളും
SIP-ന് സമാനമായി, ലംപ് സം നിക്ഷേപത്തിനും അതിന്റേതായ ഗുണങ്ങളും ദോഷങ്ങളുമുണ്ട്. അതിനാൽ, നമുക്ക് ഈ ഗുണങ്ങളും ദോഷങ്ങളും നോക്കാം.
പ്രയോജനങ്ങൾ
ലംപ് സം നിക്ഷേപത്തിന്റെ ഗുണങ്ങൾ താഴെ പറയുന്നവയാണ്.
- വലിയ തുക നിക്ഷേപിക്കുക: വ്യക്തികൾക്ക് മ്യൂച്വൽ ഫണ്ടുകളിൽ വലിയ തുക നിക്ഷേപിക്കാനും ഫണ്ടുകൾ നിഷ്ക്രിയമായി സൂക്ഷിക്കുന്നതിനുപകരം ഉയർന്ന വരുമാനം നേടാനും കഴിയും.
- ദീർഘകാലത്തേക്ക് അനുയോജ്യം: ദീർഘകാല നിക്ഷേപങ്ങൾക്ക്, പ്രത്യേകിച്ച് ഇക്വിറ്റി ഫണ്ടുകളുടെ കാര്യത്തിൽ, ലംപ് സം നിക്ഷേപ രീതി നല്ലതാണ്. എന്നിരുന്നാലും, ഡെറ്റ് ഫണ്ടുകളുടെ കാര്യത്തിൽ, കാലാവധി ഹ്രസ്വമോ ഇടത്തരമോ ആകാം
- സൗകര്യം: പേയ്മെന്റ് ഒരു തവണ മാത്രമേ ചെയ്യുന്നുള്ളൂ എന്നതിനാലും കൃത്യമായ ഇടവേളകളിൽ കുറയ്ക്കാത്തതിനാലും ഒറ്റത്തവണ നിക്ഷേപ രീതി സൗകര്യപ്രദമാണ്.
ദോഷങ്ങൾ
ലംപ് സം നിക്ഷേപത്തിന്റെ ദോഷങ്ങൾ ഇവയാണ്:
- ക്രമരഹിതമായ നിക്ഷേപം: ലംപ് സം നിക്ഷേപം സ്ഥിരമായ സമ്പാദ്യശീലം വളർത്തിയെടുക്കാത്തതിനാൽ നിക്ഷേപകന്റെ സ്ഥിരമായ സമ്പാദ്യം ഉറപ്പാക്കുന്നില്ല.
- ഉയർന്ന അപകടസാധ്യത: ലംപ് സം നിക്ഷേപത്തിൽ, സമയക്രമം നോക്കേണ്ടത് പ്രധാനമാണ്. കാരണം, ലംപ്സം മോഡിൽ നിക്ഷേപം ഒരു തവണ മാത്രമേ ചെയ്യുന്നുള്ളൂ, കൃത്യമായ ഇടവേളകളിൽ അല്ല. അതിനാൽ, വ്യക്തികൾ സമയം കണക്കാക്കിയില്ലെങ്കിൽ, അവർ നഷ്ടത്തിലായേക്കാം.
ഉപസംഹാരം
അതിനാൽ, മുകളിലുള്ള പോയിന്ററുകളിൽ നിന്ന്, മ്യൂച്വൽ ഫണ്ടുകളിൽ നിക്ഷേപിക്കാനുള്ള ഒരു നല്ല മാർഗമാണ് ലംപ്സം മോഡ് എന്ന് പറയാം. എന്നിരുന്നാലും, സ്കീമിൽ ഒറ്റത്തവണ തുക നിക്ഷേപിക്കുമ്പോൾ വ്യക്തികൾ ആത്മവിശ്വാസം പുലർത്തേണ്ടതുണ്ട്. ഇല്ലെങ്കിൽ, അവർക്ക് നിക്ഷേപത്തിന്റെ SIP മോഡ് തിരഞ്ഞെടുക്കാം. കൂടാതെ, നിക്ഷേപം നടത്തുന്നതിന് മുമ്പ് ആളുകൾ സ്കീമിന്റെ രീതികൾ മനസ്സിലാക്കണം. ആവശ്യമെങ്കിൽ, അവർക്ക് ഒരു ഉപദേശം പോലും നൽകാംസാമ്പത്തിക ഉപദേഷ്ടാവ്. അവരുടെ പണം സുരക്ഷിതമാണെന്നും അവരുടെ ലക്ഷ്യങ്ങൾ കൃത്യസമയത്ത് പൂർത്തീകരിക്കപ്പെടുന്നുവെന്നും ഉറപ്പാക്കാൻ ഇത് അവരെ സഹായിക്കും.
ഇവിടെ നൽകിയിരിക്കുന്ന വിവരങ്ങൾ കൃത്യമാണെന്ന് ഉറപ്പാക്കാൻ എല്ലാ ശ്രമങ്ങളും നടത്തിയിട്ടുണ്ട്. എന്നിരുന്നാലും, ഡാറ്റയുടെ കൃത്യത സംബന്ധിച്ച് യാതൊരു ഉറപ്പും നൽകുന്നില്ല. എന്തെങ്കിലും നിക്ഷേപം നടത്തുന്നതിന് മുമ്പ് സ്കീം വിവര രേഖ ഉപയോഗിച്ച് പരിശോധിക്കുക.
You Might Also Like


AMFI Registration No. 112358 | CIN: U74999MH2016PTC282153
Shepard Technologies Pvt. Ltd. (with ARN code 112358) makes no warranties or representations, express or implied, on products offered through the platform. It accepts no liability for any damages or losses, however caused, in connection with the use of, or on the reliance of its product or related services. Terms and conditions of the website are applicable.
©2025 Shepard Technologies Private Limited. All Rights Reserved
Research Highlights for DSP World Gold Fund