Table of Contents
एसआयपी विरुद्ध एफडी
एक चांगला गुंतवणूक पर्याय कोणता आहे?
यापैकी निवडताना व्यक्ती नेहमी 22 च्या स्थितीत असतातएफडी आणिSIP गुंतवणुकीसाठी.एसआयपी ही गुंतवणुकीची पद्धत आहेम्युच्युअल फंड ज्याद्वारे व्यक्ती नियमित अंतराने लहान रक्कम जमा करू शकतात.दुसरीकडे, एफडी, एक गुंतवणुकीचा मार्ग आहे जेथे लोक निश्चित कालावधीसाठी विशिष्ट रक्कम जमा करतात आणि मुदतपूर्ती दरम्यान व्याजासह रक्कम परत मिळवतात.. तर, एफडी आणि एसआयपी, एसआयपी रिटर्न कॅल्क्युलेटरमध्ये कोणते चांगले आहे ते समजून घेऊया,शीर्ष SIP गुंतवणूक करण्यासाठी, आणि बरेच काही.
पद्धतशीर गुंतवणूक योजना किंवा SIP म्हणजे काय?
पद्धतशीरगुंतवणूक योजना किंवा एसआयपी हा म्युच्युअल फंडातील एक गुंतवणुकीचा मार्ग आहे जो लोकांना नियमित अंतराने लहान रक्कम जमा करू देतो. SIP ला लक्ष्य-आधारित गुंतवणूक म्हणून देखील संदर्भित केले जाऊ शकते. SIP ही म्युच्युअल फंडाची एक सुंदरता आहे ज्याद्वारे लोक त्यांच्या सोयीनुसार गुंतवणूक करू शकतात. SIP द्वारे लोक घर खरेदी, वाहन खरेदी, उच्च शिक्षणाचे नियोजन आणि बरेच काही यासारखी अनेक उद्दिष्टे साध्य करण्याची योजना करू शकतात. गुंतवणुकीचा एसआयपी मोड अनेक योजनांमध्ये उपलब्ध असला तरी, सामान्यतः याचा संदर्भइक्विटी फंड.

लोक त्यांची सुरुवात करू शकतातएसआयपी गुंतवणूक INR 500 इतक्या कमी रकमेसह.
मुदत ठेव किंवा FD म्हणजे काय?
FD ची मुदत ठेव म्हणजे गुंतवणुकीचा मार्ग आहे जो सामान्यतः बँकांद्वारे ऑफर केला जातो आणिपोस्ट ऑफिस. FD च्या बाबतीत, लोकांना निश्चित कालावधीसाठी एक-वेळ पेमेंट म्हणून लक्षणीय रक्कम जमा करणे आवश्यक आहे. येथे, लोकांना त्यांच्या गुंतवणुकीची रक्कम कार्यकाळाच्या शेवटी परत मिळते. तथापि, लोक कार्यकाळात FD खंडित करू शकत नाहीत आणि त्यांनी खंडित करण्याचा प्रयत्न केल्यास त्यांना काही शुल्क भरावे लागेलबँक. एफडीउत्पन्न गुंतवणुकीवर व्याज मिळते. हे व्याज उत्पन्न गुंतवणूकदारांच्या हातात करपात्र असते.
कोणता निवडायचा?
म्युच्युअल फंडामध्ये एसआयपी हा गुंतवणुकीचा मार्ग आहे तर एफडी हा गुंतवणुकीचा मार्ग आहे; ते दोन्ही भिन्न वैशिष्ट्ये दर्शवतात. तर, त्या दोघांमधील फरक समजून घेऊया.
किमान गुंतवणूक
गुंतवणुकीच्या SIP पद्धतीद्वारे म्युच्युअल फंडातील किमान गुंतवणूक सुरू होतेINR 500. त्यामुळे लोकांच्या खिशाला फारसा धक्का लागणार नाही याची खात्री करता येते. शिवाय, एसआयपीची वारंवारता लोकांच्या सोयीनुसार मासिक किंवा त्रैमासिक म्हणून देखील सेट केली जाऊ शकते. दुसरीकडे, FD मध्ये किमान गुंतवणूक रक्कम INR 1 च्या दरम्यान असते,000-10,0000. FD गुंतवणूक एकरकमी पद्धतीने होत असल्याने, लोक गुंतवणूक करत नाहीतगुंतवणूक रक्कम.
कार्यकाळ
एफडी हा पारंपरिक गुंतवणुकीचा मार्ग असल्याने अल्पकालीन आणि दीर्घकालीन अशा दोन्ही प्रकारच्या गुंतवणुकीसाठी विचार केला जातो. FD चा कालावधी 6 महिने, 1 वर्ष असू शकतो आणि 5 वर्षांपर्यंत जाऊ शकतो. याउलट, दीर्घकालीन गुंतवणुकीसाठी एसआयपीची निवड केली जाते. SIP चा सामान्यतः इक्विटी फंडांच्या संदर्भात संदर्भ दिला जात असल्याने, दीर्घकालीन गुंतवणूक तुम्हाला जास्तीत जास्त महसूल मिळविण्यात मदत करेल. शिवाय, जास्त काळ ठेवल्यास लोक जास्तीत जास्त लाभ घेऊ शकतात.
परतावा
FD वरील परतावा व्याजाच्या स्वरूपात निश्चित केला जातो जो ठराविक कालावधीत बदलत नाही. आर्थिक वर्ष 2017-18 साठी, FD दरश्रेणी गुंतवणूक एका वर्षासाठी ठेवल्यास अंदाजे 6%-7% दरम्यान. याउलट, एसआयपीच्या बाबतीत, परतावा निश्चित केला जात नाही कारण परतावा हे त्याच्या कामगिरीवर अवलंबून असते.अंतर्निहित इक्विटी शेअर्स. तथापि, जर म्युच्युअल फंड पाच वर्षांपेक्षा जास्त कालावधीसाठी आयोजित केले असतील तर त्यांनी 15% पेक्षा जास्त ऐतिहासिक परतावा दिला आहे.
Talk to our investment specialist
जोखीम भूक
एसआयपीच्या तुलनेत एफडीची जोखीम-भूक कमी मानली जाते. एफडी सामान्यतः बँका देतात. दुसरीकडे, दजोखीम भूक SIP ची रक्कम FD पेक्षा जास्त आहे. तथापि, एसआयपी दीर्घ कालावधीसाठी ठेवल्यास, तोटा होण्याची शक्यता कमी होते.
तरलता
दतरलता एफडीच्या तुलनेत एसआयपी अधिक आहे. एसआयपीच्या बाबतीत, जर लोकांनी त्यांच्या गुंतवणूकीची पूर्तता केली तर ते पैसे परत मिळवू शकतातइक्विटी फंडांसाठी T+3 दिवस. तथापि, बाबतीतकर्ज निधी, सेटलमेंट कालावधी आहेT+1 दिवस. तथापि, मुदत ठेवींच्या बाबतीत, त्याची पूर्तता करणे सोपे नाही. जरी लोकांनी मुदतपूर्व पैसे काढण्याचा प्रयत्न केला तरी त्यांना बँकेला काही शुल्क भरावे लागेल.
कर आकारणी
म्युच्युअल फंड आणि एफडी या दोन्ही बाबतीत कर आकारणीचे नियम वेगळे आहेत. FD च्या बाबतीत, आर्थिक वर्ष 2017-18 साठी, कमावलेले व्याज व्यक्तीच्या नियमित कर स्लॅबनुसार आकारले जाते. तथापि, SIP साधारणपणे इक्विटी फंडांच्या संदर्भात असते, म्हणून इक्विटी फंडाशी संबंधित कर नियम खालीलप्रमाणे स्पष्ट केले आहेत.
आर्थिक वर्ष 2017-18 साठी, जर इक्विटी फंड खरेदीच्या तारखेपासून एक वर्षानंतर विकले गेले, तर ते दीर्घ मुदतीसाठी लागू होतील.भांडवल नफा जो करपात्र नाही. तथापि, जर हे निधी खरेदीच्या तारखेपासून एक वर्षापूर्वी विकले गेले तर; ते अल्पकालीन आहेभांडवली लाभ जे a वर आकारले जातेफ्लॅट व्यक्तीच्या कर स्लॅबची पर्वा न करता 15% चा दर.
वैशिष्ट्ये
एसआयपीमध्ये बरीच वैशिष्ट्ये आहेत जसे की रुपयाची सरासरी किंमत, दकंपाउंडिंगची शक्ती, आणि असेच, जे FD च्या बाबतीत उपलब्ध नाही. तर, या वैशिष्ट्यांचा अर्थ काय ते पाहू.
1. रुपयाची सरासरी किंमत
एसआयपीच्या बाबतीत, लोकम्युच्युअल फंडात गुंतवणूक करा बाजार भिन्न किंमत वर्तन दर्शवत असताना नियमित कालावधीत युनिट्स. त्यामुळे, जेव्हा बाजार मंदी दाखवत असतो, तेव्हा लोक अधिक युनिट्स खरेदी करू शकतात आणि त्याउलट. त्यामुळे, SIP मुळे युनिट्सची खरेदी किंमत सरासरी निघते. तथापि, FD च्या बाबतीत, ही सुविधा उपलब्ध नाही कारण रक्कम फक्त एकदाच जमा केली जाते.
2. कंपाउंडिंगची शक्ती
एसआयपी कंपाउंडिंगसाठी लागू आहे. चक्रवाढ म्हणजे चक्रवाढ व्याज जेथे व्याजाची रक्कम मूळ रकमेवर मोजली जाते आणि आधीच जमा केलेले व्याज. FD च्या बाबतीत, व्याजाची रक्कम देखील चक्रवाढीच्या अधीन आहे.
3. शिस्तबद्ध बचत सवय
एसआयपी व्यक्तींमध्ये शिस्तबद्ध बचतीची सवय विकसित करते कारण लोकांना नियमित अंतराने पैसे जमा करावे लागतात. याउलट, FD मध्ये लोक फक्त एकदाच पैसे जमा करतात, त्यांना शिस्तबद्ध बचतीची सवय लागू शकते किंवा नाही.
खाली दिलेला तक्ता SIP आणि मुदत ठेवींमधील फरक सारांशित करतो.
| पॅरामीटर्स | SIP | मुदत ठेवी |
|---|---|---|
| परतावा | फंडाच्या कामगिरीनुसार बदलते | पूर्वनिर्धारित |
| किमान गुंतवणूक | INR 500 पासून सुरू होते | INR 1,000 - 10,000 च्या दरम्यान श्रेणी |
| कार्यकाळ | साधारणपणे दीर्घकाळासाठी वापरले जाते | अल्पकालीन आणि दीर्घकालीन दोन्ही कार्यकाळ |
| धोका | उच्च | कमी |
| तरलता | उच्च | कमी |
| कर आकारणी | अल्पकालीन: 15% सपाट दराने कर आकारलादीर्घकालीन: कर नाही | व्यक्तीच्या स्लॅब दरांनुसार कर आकारला जातो |
| वैशिष्ट्ये | रुपयाची किंमत सरासरी, चक्रवाढीची शक्ती आणि शिस्तबद्ध बचतीची सवय | कंपाउंडिंगची शक्ती |
आर्थिक वर्ष 22 - 23 साठी गुंतवणूक करण्यासाठी सर्वोत्तम SIP
The primary objective of the Scheme is to achieve long-term capital appreciation by investing in equity & equity related instruments of mid cap & small cap companies. Principal Emerging Bluechip Fund is a Equity - Large & Mid Cap fund was launched on 12 Nov 08. It is a fund with Moderately High risk and has given a Below is the key information for Principal Emerging Bluechip Fund Returns up to 1 year are on (Erstwhile Invesco India Growth Fund) The investment objective of the Scheme is to generate long-term capital growth from a diversified portfolio of predominantly equity and equity-related securities. However, there can be no assurance that the objectives of the scheme will be achieved. Invesco India Growth Opportunities Fund is a Equity - Large & Mid Cap fund was launched on 9 Aug 07. It is a fund with Moderately High risk and has given a Below is the key information for Invesco India Growth Opportunities Fund Returns up to 1 year are on ICICI Prudential Banking and Financial Services Fund is an Open-ended equity scheme that seeks to generate long-term capital appreciation to unitholders from a portfolio that is invested predominantly in equity and equity related securities of companies engaged in banking and financial services. However, there can be no assurance that the investment objective of the Scheme will be realized. ICICI Prudential Banking and Financial Services Fund is a Equity - Sectoral fund was launched on 22 Aug 08. It is a fund with High risk and has given a Below is the key information for ICICI Prudential Banking and Financial Services Fund Returns up to 1 year are on (Erstwhile Motilal Oswal MOSt Focused Multicap 35 Fund) The investment objective of the Scheme is to achieve long term capital appreciation by primarily investing in a maximum of 35 equity & equity related instruments across sectors and market-capitalization levels.However, there can be no assurance or guarantee that the investment objective of the Scheme would be achieved. Motilal Oswal Multicap 35 Fund is a Equity - Multi Cap fund was launched on 28 Apr 14. It is a fund with Moderately High risk and has given a Below is the key information for Motilal Oswal Multicap 35 Fund Returns up to 1 year are on The primary investment objective of the Scheme is to generate long-term capital appreciation to unit holders from a portfolio that is invested predominantly in equity and equity related securities of companies engaged in banking and financial services. The Scheme does not guarantee/indicate any returns. There can be no assurance that the schemes’ objectives will be achieved. Aditya Birla Sun Life Banking And Financial Services Fund is a Equity - Sectoral fund was launched on 14 Dec 13. It is a fund with High risk and has given a Below is the key information for Aditya Birla Sun Life Banking And Financial Services Fund Returns up to 1 year are on Fund NAV Net Assets (Cr) Min SIP Investment 3 MO (%) 6 MO (%) 1 YR (%) 3 YR (%) 5 YR (%) 2024 (%) Principal Emerging Bluechip Fund Growth ₹183.316
↑ 2.03 ₹3,124 100 2.9 13.6 38.9 21.9 19.2 Invesco India Growth Opportunities Fund Growth ₹91.44
↑ 1.86 ₹6,432 100 3.7 -3.6 20.2 21.2 26.5 37.5 ICICI Prudential Banking and Financial Services Fund Growth ₹129.8
↑ 1.73 ₹9,008 100 11.8 4.4 19.4 16.2 25.1 11.6 Motilal Oswal Multicap 35 Fund Growth ₹57.1833
↑ 0.85 ₹12,267 500 0.7 -6.6 16.7 20.2 22.8 45.7 Aditya Birla Sun Life Banking And Financial Services Fund Growth ₹59.54
↑ 1.03 ₹3,248 1,000 13.7 4.4 16.4 16.7 25.9 8.7 Note: Returns up to 1 year are on absolute basis & more than 1 year are on CAGR basis. as on 31 Dec 21 1. Principal Emerging Bluechip Fund
CAGR/Annualized return of 24.8% since its launch. Ranked 1 in Large & Mid Cap category. . Principal Emerging Bluechip Fund
Growth Launch Date 12 Nov 08 NAV (31 Dec 21) ₹183.316 ↑ 2.03 (1.12 %) Net Assets (Cr) ₹3,124 on 30 Nov 21 Category Equity - Large & Mid Cap AMC Principal Pnb Asset Mgmt. Co. Priv. Ltd. Rating ☆☆☆☆☆ Risk Moderately High Expense Ratio 2.08 Sharpe Ratio 2.74 Information Ratio 0.22 Alpha Ratio 2.18 Min Investment 5,000 Min SIP Investment 100 Exit Load 0-1 Years (1%),1 Years and above(NIL) Growth of 10,000 investment over the years.
Date Value 31 Mar 20 ₹10,000 31 Mar 21 ₹17,552 Returns for Principal Emerging Bluechip Fund
absolute basis & more than 1 year are on CAGR (Compound Annual Growth Rate) basis. as on 31 Dec 21 Duration Returns 1 Month 2.9% 3 Month 2.9% 6 Month 13.6% 1 Year 38.9% 3 Year 21.9% 5 Year 19.2% 10 Year 15 Year Since launch 24.8% Historical performance (Yearly) on absolute basis
Year Returns 2024 2023 2022 2021 2020 2019 2018 2017 2016 2015 Fund Manager information for Principal Emerging Bluechip Fund
Name Since Tenure Data below for Principal Emerging Bluechip Fund as on 30 Nov 21
Equity Sector Allocation
Sector Value Asset Allocation
Asset Class Value Top Securities Holdings / Portfolio
Name Holding Value Quantity 2. Invesco India Growth Opportunities Fund
CAGR/Annualized return of 13.3% since its launch. Ranked 6 in Large & Mid Cap category. Return for 2024 was 37.5% , 2023 was 31.6% and 2022 was -0.4% . Invesco India Growth Opportunities Fund
Growth Launch Date 9 Aug 07 NAV (21 Apr 25) ₹91.44 ↑ 1.86 (2.08 %) Net Assets (Cr) ₹6,432 on 31 Mar 25 Category Equity - Large & Mid Cap AMC Invesco Asset Management (India) Private Ltd Rating ☆☆☆☆☆ Risk Moderately High Expense Ratio 1.88 Sharpe Ratio 0.44 Information Ratio 0.6 Alpha Ratio 7.06 Min Investment 5,000 Min SIP Investment 100 Exit Load 0-1 Years (1%),1 Years and above(NIL) Growth of 10,000 investment over the years.
Date Value 31 Mar 20 ₹10,000 31 Mar 21 ₹16,107 31 Mar 22 ₹18,853 31 Mar 23 ₹18,682 31 Mar 24 ₹28,076 31 Mar 25 ₹32,206 Returns for Invesco India Growth Opportunities Fund
absolute basis & more than 1 year are on CAGR (Compound Annual Growth Rate) basis. as on 31 Dec 21 Duration Returns 1 Month 4.9% 3 Month 3.7% 6 Month -3.6% 1 Year 20.2% 3 Year 21.2% 5 Year 26.5% 10 Year 15 Year Since launch 13.3% Historical performance (Yearly) on absolute basis
Year Returns 2024 37.5% 2023 31.6% 2022 -0.4% 2021 29.7% 2020 13.3% 2019 10.7% 2018 -0.2% 2017 39.6% 2016 3.3% 2015 3.8% Fund Manager information for Invesco India Growth Opportunities Fund
Name Since Tenure Aditya Khemani 9 Nov 23 1.31 Yr. Amit Ganatra 21 Jan 22 3.11 Yr. Data below for Invesco India Growth Opportunities Fund as on 31 Mar 25
Equity Sector Allocation
Sector Value Financial Services 27.11% Consumer Cyclical 23.58% Health Care 14.39% Industrials 10.18% Technology 7.63% Real Estate 6.51% Basic Materials 4.56% Consumer Defensive 2.23% Communication Services 1.79% Asset Allocation
Asset Class Value Cash 2.01% Equity 97.99% Top Securities Holdings / Portfolio
Name Holding Value Quantity InterGlobe Aviation Ltd (Industrials)
Equity, Since 31 Mar 24 | INDIGO5% ₹274 Cr 612,171 Cholamandalam Investment and Finance Co Ltd (Financial Services)
Equity, Since 28 Feb 23 | CHOLAFIN5% ₹269 Cr 1,921,954
↑ 84,346 Trent Ltd (Consumer Cyclical)
Equity, Since 28 Feb 22 | 5002514% ₹263 Cr 542,689
↑ 59,081 Swiggy Ltd (Consumer Cyclical)
Equity, Since 30 Nov 24 | SWIGGY4% ₹223 Cr 6,673,912
↑ 1,381,517 ICICI Bank Ltd (Financial Services)
Equity, Since 31 Dec 15 | ICICIBANK4% ₹210 Cr 1,741,069
↓ -336,652 Zomato Ltd (Consumer Cyclical)
Equity, Since 30 Jun 23 | 5433203% ₹203 Cr 9,152,597 Max Healthcare Institute Ltd Ordinary Shares (Healthcare)
Equity, Since 30 Nov 22 | MAXHEALTH3% ₹195 Cr 1,993,259 Dixon Technologies (India) Ltd (Technology)
Equity, Since 30 Sep 22 | DIXON3% ₹182 Cr 130,340 L&T Finance Ltd (Financial Services)
Equity, Since 30 Apr 24 | LTF3% ₹181 Cr 13,404,597 The Federal Bank Ltd (Financial Services)
Equity, Since 30 Nov 22 | FEDERALBNK3% ₹178 Cr 10,039,804 3. ICICI Prudential Banking and Financial Services Fund
CAGR/Annualized return of 16.6% since its launch. Return for 2024 was 11.6% , 2023 was 17.9% and 2022 was 11.9% . ICICI Prudential Banking and Financial Services Fund
Growth Launch Date 22 Aug 08 NAV (21 Apr 25) ₹129.8 ↑ 1.73 (1.35 %) Net Assets (Cr) ₹9,008 on 31 Mar 25 Category Equity - Sectoral AMC ICICI Prudential Asset Management Company Limited Rating ☆☆☆☆☆ Risk High Expense Ratio 1.98 Sharpe Ratio 0.59 Information Ratio 0.07 Alpha Ratio -4.45 Min Investment 5,000 Min SIP Investment 100 Exit Load 0-1 Years (1%),1 Years and above(NIL) Growth of 10,000 investment over the years.
Date Value 31 Mar 20 ₹10,000 31 Mar 21 ₹17,701 31 Mar 22 ₹19,901 31 Mar 23 ₹21,205 31 Mar 24 ₹26,444 31 Mar 25 ₹30,205 Returns for ICICI Prudential Banking and Financial Services Fund
absolute basis & more than 1 year are on CAGR (Compound Annual Growth Rate) basis. as on 31 Dec 21 Duration Returns 1 Month 7.3% 3 Month 11.8% 6 Month 4.4% 1 Year 19.4% 3 Year 16.2% 5 Year 25.1% 10 Year 15 Year Since launch 16.6% Historical performance (Yearly) on absolute basis
Year Returns 2024 11.6% 2023 17.9% 2022 11.9% 2021 23.5% 2020 -5.5% 2019 14.5% 2018 -0.4% 2017 45.1% 2016 21.1% 2015 -7.2% Fund Manager information for ICICI Prudential Banking and Financial Services Fund
Name Since Tenure Roshan Chutkey 29 Jan 18 7.09 Yr. Sharmila D’mello 30 Jun 22 2.67 Yr. Data below for ICICI Prudential Banking and Financial Services Fund as on 31 Mar 25
Equity Sector Allocation
Sector Value Financial Services 92.1% Industrials 0.18% Technology 0.07% Asset Allocation
Asset Class Value Cash 7.65% Equity 92.35% Top Securities Holdings / Portfolio
Name Holding Value Quantity HDFC Bank Ltd (Financial Services)
Equity, Since 31 Oct 08 | HDFCBANK21% ₹1,887 Cr 10,891,127 ICICI Bank Ltd (Financial Services)
Equity, Since 31 Oct 08 | ICICIBANK18% ₹1,619 Cr 13,445,003 Axis Bank Ltd (Financial Services)
Equity, Since 28 Feb 19 | 5322158% ₹730 Cr 7,188,596
↑ 173,125 State Bank of India (Financial Services)
Equity, Since 31 Oct 08 | SBIN6% ₹568 Cr 8,244,914
↑ 1,706,850 SBI Life Insurance Co Ltd (Financial Services)
Equity, Since 30 Sep 17 | SBILIFE5% ₹477 Cr 3,332,802
↑ 255,647 IndusInd Bank Ltd (Financial Services)
Equity, Since 30 Apr 24 | INDUSINDBK5% ₹433 Cr 4,371,007 HDFC Life Insurance Co Ltd (Financial Services)
Equity, Since 30 Sep 23 | HDFCLIFE4% ₹330 Cr 5,423,546
↑ 984,400 Kotak Mahindra Bank Ltd (Financial Services)
Equity, Since 31 Jan 23 | KOTAKBANK3% ₹284 Cr 1,491,184
↓ -480,000 ICICI Lombard General Insurance Co Ltd (Financial Services)
Equity, Since 30 Sep 19 | ICICIGI3% ₹236 Cr 1,396,761
↑ 311,863 Max Financial Services Ltd (Financial Services)
Equity, Since 31 Aug 19 | 5002712% ₹169 Cr 1,697,397
↑ 34,116 4. Motilal Oswal Multicap 35 Fund
CAGR/Annualized return of 17.2% since its launch. Ranked 5 in Multi Cap category. Return for 2024 was 45.7% , 2023 was 31% and 2022 was -3% . Motilal Oswal Multicap 35 Fund
Growth Launch Date 28 Apr 14 NAV (21 Apr 25) ₹57.1833 ↑ 0.85 (1.51 %) Net Assets (Cr) ₹12,267 on 31 Mar 25 Category Equity - Multi Cap AMC Motilal Oswal Asset Management Co. Ltd Rating ☆☆☆☆☆ Risk Moderately High Expense Ratio 0.94 Sharpe Ratio 0.56 Information Ratio 0.79 Alpha Ratio 11.84 Min Investment 5,000 Min SIP Investment 500 Exit Load 0-1 Years (1%),1 Years and above(NIL) Growth of 10,000 investment over the years.
Date Value 31 Mar 20 ₹10,000 31 Mar 21 ₹16,169 31 Mar 22 ₹16,552 31 Mar 23 ₹16,009 31 Mar 24 ₹24,719 31 Mar 25 ₹29,279 Returns for Motilal Oswal Multicap 35 Fund
absolute basis & more than 1 year are on CAGR (Compound Annual Growth Rate) basis. as on 31 Dec 21 Duration Returns 1 Month 1.3% 3 Month 0.7% 6 Month -6.6% 1 Year 16.7% 3 Year 20.2% 5 Year 22.8% 10 Year 15 Year Since launch 17.2% Historical performance (Yearly) on absolute basis
Year Returns 2024 45.7% 2023 31% 2022 -3% 2021 15.3% 2020 10.3% 2019 7.9% 2018 -7.8% 2017 43.1% 2016 8.5% 2015 14.6% Fund Manager information for Motilal Oswal Multicap 35 Fund
Name Since Tenure Ajay Khandelwal 1 Oct 24 0.41 Yr. Niket Shah 1 Jul 22 2.67 Yr. Rakesh Shetty 22 Nov 22 2.27 Yr. Atul Mehra 1 Oct 24 0.41 Yr. Sunil Sawant 1 Jul 24 0.67 Yr. Data below for Motilal Oswal Multicap 35 Fund as on 31 Mar 25
Equity Sector Allocation
Sector Value Technology 20.44% Industrials 18.3% Consumer Cyclical 17.23% Financial Services 9.73% Communication Services 9.21% Health Care 1.75% Asset Allocation
Asset Class Value Cash 23.82% Equity 76.18% Top Securities Holdings / Portfolio
Name Holding Value Quantity Coforge Ltd (Technology)
Equity, Since 31 May 23 | COFORGE10% ₹1,104 Cr 1,500,000
↑ 137,475 Polycab India Ltd (Industrials)
Equity, Since 31 Jan 24 | POLYCAB8% ₹845 Cr 1,793,750
↑ 6,917 Kalyan Jewellers India Ltd (Consumer Cyclical)
Equity, Since 30 Sep 23 | KALYANKJIL7% ₹809 Cr 17,500,000
↑ 250,000 Persistent Systems Ltd (Technology)
Equity, Since 31 Mar 23 | PERSISTENT7% ₹782 Cr 1,475,000
↓ -321,350 Trent Ltd (Consumer Cyclical)
Equity, Since 31 Jan 23 | 5002517% ₹728 Cr 1,500,000
↓ -335,546 Cholamandalam Investment and Finance Co Ltd (Financial Services)
Equity, Since 31 Mar 23 | CHOLAFIN6% ₹630 Cr 4,500,000 CG Power & Industrial Solutions Ltd (Industrials)
Equity, Since 31 Jan 25 | 5000935% ₹601 Cr 10,500,000
↑ 4,000,000 Bharti Airtel Ltd (Partly Paid Rs.1.25) (Communication Services)
Equity, Since 30 Apr 24 | 8901575% ₹558 Cr 5,000,000 Bharti Airtel Ltd (Communication Services)
Equity, Since 30 Apr 24 | BHARTIARTL4% ₹471 Cr 3,000,000 PG Electroplast Ltd (Technology)
Equity, Since 31 Dec 24 | PGEL4% ₹397 Cr 5,000,000 5. Aditya Birla Sun Life Banking And Financial Services Fund
CAGR/Annualized return of 17% since its launch. Ranked 3 in Sectoral category. Return for 2024 was 8.7% , 2023 was 21.7% and 2022 was 11.5% . Aditya Birla Sun Life Banking And Financial Services Fund
Growth Launch Date 14 Dec 13 NAV (21 Apr 25) ₹59.54 ↑ 1.03 (1.76 %) Net Assets (Cr) ₹3,248 on 31 Mar 25 Category Equity - Sectoral AMC Birla Sun Life Asset Management Co Ltd Rating ☆☆☆☆☆ Risk High Expense Ratio 1.99 Sharpe Ratio 0.33 Information Ratio 0.03 Alpha Ratio -9.7 Min Investment 1,000 Min SIP Investment 1,000 Exit Load 0-365 Days (1%),365 Days and above(NIL) Growth of 10,000 investment over the years.
Date Value 31 Mar 20 ₹10,000 31 Mar 21 ₹17,760 31 Mar 22 ₹19,860 31 Mar 23 ₹20,711 31 Mar 24 ₹27,001 31 Mar 25 ₹30,038 Returns for Aditya Birla Sun Life Banking And Financial Services Fund
absolute basis & more than 1 year are on CAGR (Compound Annual Growth Rate) basis. as on 31 Dec 21 Duration Returns 1 Month 8.1% 3 Month 13.7% 6 Month 4.4% 1 Year 16.4% 3 Year 16.7% 5 Year 25.9% 10 Year 15 Year Since launch 17% Historical performance (Yearly) on absolute basis
Year Returns 2024 8.7% 2023 21.7% 2022 11.5% 2021 16.8% 2020 1.1% 2019 14.9% 2018 -2.4% 2017 47.6% 2016 15.7% 2015 -0.5% Fund Manager information for Aditya Birla Sun Life Banking And Financial Services Fund
Name Since Tenure Dhaval Gala 26 Aug 15 9.52 Yr. Dhaval Joshi 21 Nov 22 2.28 Yr. Data below for Aditya Birla Sun Life Banking And Financial Services Fund as on 31 Mar 25
Equity Sector Allocation
Sector Value Financial Services 97.02% Technology 1.09% Asset Allocation
Asset Class Value Cash 1.89% Equity 98.11% Other 0% Top Securities Holdings / Portfolio
Name Holding Value Quantity ICICI Bank Ltd (Financial Services)
Equity, Since 31 Dec 13 | ICICIBANK20% ₹601 Cr 4,993,129 HDFC Bank Ltd (Financial Services)
Equity, Since 31 Dec 13 | HDFCBANK19% ₹578 Cr 3,336,948 Bajaj Finance Ltd (Financial Services)
Equity, Since 30 Sep 16 | 5000347% ₹199 Cr 233,725 Axis Bank Ltd (Financial Services)
Equity, Since 31 Oct 18 | 5322157% ₹196 Cr 1,927,100 State Bank of India (Financial Services)
Equity, Since 31 Oct 17 | SBIN5% ₹162 Cr 2,351,492 Cholamandalam Financial Holdings Ltd (Financial Services)
Equity, Since 31 Jan 20 | CHOLAHLDNG4% ₹110 Cr 667,972 Shriram Finance Ltd (Financial Services)
Equity, Since 30 Jun 23 | SHRIRAMFIN3% ₹97 Cr 1,577,700 Kotak Mahindra Bank Ltd (Financial Services)
Equity, Since 31 Jan 19 | KOTAKBANK3% ₹89 Cr 469,972 AU Small Finance Bank Ltd (Financial Services)
Equity, Since 30 Nov 23 | 5406112% ₹74 Cr 1,308,861 Repco Home Finance Ltd (Financial Services)
Equity, Since 31 Dec 13 | 5353222% ₹58 Cr 1,751,838
↓ -180,986
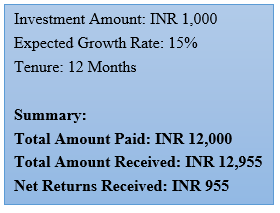
एसआयपी रिटर्न कॅल्क्युलेटर
SIP चे परतावे बदलत राहतात. तथापि, परताव्याचा ऐतिहासिक दर 15% गृहीत धरून, 12 महिन्यांच्या कालावधीत INR 1,000 ची SIP गुंतवणूक कशी वाढते ते पाहू.
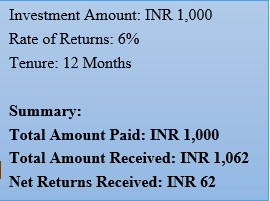
एफडी कॅल्क्युलेटर
एफडीचे दरही बँकेनुसार बदलत राहतात. तथापि, 6% व्याजदर गृहीत धरून, गुंतवणुकीची रक्कम INR 1,000 असल्यास FD 12 महिन्यांच्या कालावधीत कशी कामगिरी करेल ते पाहू.
MF SIP मध्ये ऑनलाइन गुंतवणूक कशी करावी?
Fincash.com वर आजीवन मोफत गुंतवणूक खाते उघडा.
तुमची नोंदणी आणि KYC प्रक्रिया पूर्ण करा
दस्तऐवज अपलोड करा (PAN, आधार इ.).आणि, तुम्ही गुंतवणूक करण्यास तयार आहात!
निष्कर्ष: SIP किंवा FD
निष्कर्षापर्यंत, असे म्हणता येईल की एफडीच्या तुलनेत एसआयपीचे अधिक फायदे आहेत. तथापि, लोकांना नेहमी सल्ला दिला जातो की त्यांनी गुंतवणूक करण्यापूर्वी योजनेचे कार्य पूर्णपणे समजून घ्यावे. याव्यतिरिक्त, ते वैयक्तिक सल्ला देखील घेऊ शकतातआर्थिक सल्लागार त्यांची गुंतवणूक सुरक्षित आहे आणि त्यांची उद्दिष्टे पूर्ण झाली आहेत याची खात्री करण्यासाठी.
येथे प्रदान केलेली माहिती अचूक असल्याची खात्री करण्यासाठी सर्व प्रयत्न केले गेले आहेत. तथापि, डेटाच्या अचूकतेबद्दल कोणतीही हमी दिली जात नाही. कृपया कोणतीही गुंतवणूक करण्यापूर्वी योजना माहिती दस्तऐवजासह सत्यापित करा.


")


AMFI Registration No. 112358 | CIN: U74999MH2016PTC282153
Shepard Technologies Pvt. Ltd. (with ARN code 112358) makes no warranties or representations, express or implied, on products offered through the platform. It accepts no liability for any damages or losses, however caused, in connection with the use of, or on the reliance of its product or related services. Terms and conditions of the website are applicable.
©2025 Shepard Technologies Private Limited. All Rights Reserved