Table of Contents
- മികച്ച നിക്ഷേപ ഓപ്ഷൻ ഏതാണ്?
- എന്താണ് ഒരു സിസ്റ്റമാറ്റിക് ഇൻവെസ്റ്റ്മെന്റ് പ്ലാൻ അല്ലെങ്കിൽ SIP?
- എന്താണ് ഒരു ഫിക്സഡ് ഡിപ്പോസിറ്റ് അല്ലെങ്കിൽ FD?
- ഏതാണ് തിരഞ്ഞെടുക്കേണ്ടത്?
- FY 22 - 23 ലേക്ക് നിക്ഷേപിക്കുന്നതിനുള്ള മികച്ച SIP
- SIP റിട്ടേൺ കാൽക്കുലേറ്റർ
- FD കാൽക്കുലേറ്റർ
- MF SIP ഓൺലൈനിൽ എങ്ങനെ നിക്ഷേപിക്കാം?
- ഉപസംഹാരം: SIP അല്ലെങ്കിൽ FD
Top 5 Funds
SIP Vs FD
മികച്ച നിക്ഷേപ ഓപ്ഷൻ ഏതാണ്?
ഇടയിൽ തിരഞ്ഞെടുക്കുമ്പോൾ വ്യക്തികൾ എപ്പോഴും ഒരു ക്യാച്ച് 22 സാഹചര്യത്തിലാണ്FD ഒപ്പംഎസ്.ഐ.പി നിക്ഷേപത്തിനായി.SIP എന്നത് ഒരു നിക്ഷേപ രീതിയാണ്മ്യൂച്വൽ ഫണ്ടുകൾ അതിലൂടെ വ്യക്തികൾക്ക് കൃത്യമായ ഇടവേളകളിൽ ചെറിയ തുകകൾ നിക്ഷേപിക്കാം.മറുവശത്ത്, FD എന്നത് ഒരു നിക്ഷേപ വഴിയാണ്. അതിനാൽ, FD, SIP എന്നിവയ്ക്കിടയിൽ ഏതാണ് മികച്ചതെന്ന് നമുക്ക് മനസിലാക്കാം, SIP റിട്ടേൺ കാൽക്കുലേറ്റർ,ടോപ്പ് SIP നിക്ഷേപിക്കാൻ, കൂടാതെ മറ്റു പലതും.
എന്താണ് ഒരു സിസ്റ്റമാറ്റിക് ഇൻവെസ്റ്റ്മെന്റ് പ്ലാൻ അല്ലെങ്കിൽ SIP?
വ്യവസ്ഥാപിതംനിക്ഷേപ പദ്ധതി അല്ലെങ്കിൽ കൃത്യമായ ഇടവേളകളിൽ ചെറിയ തുക നിക്ഷേപിക്കാൻ ആളുകളെ അനുവദിക്കുന്ന മ്യൂച്വൽ ഫണ്ടുകളിലെ നിക്ഷേപ രീതിയാണ് SIP. എസ്ഐപിയെ ലക്ഷ്യം അടിസ്ഥാനമാക്കിയുള്ള നിക്ഷേപം എന്നും വിളിക്കാം. ആളുകൾക്ക് അവരുടെ സൗകര്യത്തിനനുസരിച്ച് നിക്ഷേപിക്കാൻ കഴിയുന്ന മ്യൂച്വൽ ഫണ്ടുകളുടെ മനോഹരങ്ങളിലൊന്നാണ് SIP. ഒരു വീട് വാങ്ങുക, വാഹനം വാങ്ങുക, ഉന്നതവിദ്യാഭ്യാസത്തിനായി ആസൂത്രണം ചെയ്യുക, തുടങ്ങി നിരവധി ലക്ഷ്യങ്ങൾ കൈവരിക്കാൻ SIP-യിലൂടെ ആളുകൾക്ക് ആസൂത്രണം ചെയ്യാൻ കഴിയും. പല സ്കീമുകളിലും എസ്ഐപി നിക്ഷേപ രീതി ലഭ്യമാണെങ്കിലും, ഇത് പൊതുവെ പരാമർശിക്കപ്പെടുന്നുഇക്വിറ്റി ഫണ്ടുകൾ.

ആളുകൾക്ക് തുടങ്ങാംSIP നിക്ഷേപം 500 രൂപയിൽ താഴെയുള്ള തുകയിൽ.
എന്താണ് ഒരു ഫിക്സഡ് ഡിപ്പോസിറ്റ് അല്ലെങ്കിൽ FD?
FD യുടെ ഫിക്സഡ് ഡിപ്പോസിറ്റ് എന്നത് ബാങ്കുകളും പൊതുവെ വാഗ്ദാനം ചെയ്യുന്ന ഒരു നിക്ഷേപ മാർഗത്തെ സൂചിപ്പിക്കുന്നുപോസ്റ്റ് ഓഫീസ്. എഫ്ഡിയുടെ കാര്യത്തിൽ, ഒരു നിശ്ചിത സമയ ഫ്രെയിമിനായി ആളുകൾ ഒറ്റത്തവണ പേയ്മെന്റായി ഗണ്യമായ തുക നിക്ഷേപിക്കേണ്ടതുണ്ട്. ഇവിടെ, കാലാവധിയുടെ അവസാനത്തിൽ ആളുകൾക്ക് അവരുടെ നിക്ഷേപ തുക തിരികെ ലഭിക്കും. എന്നിരുന്നാലും, കാലാവധിയിൽ ആളുകൾക്ക് FD തകർക്കാൻ കഴിയില്ല, അവർ തകർക്കാൻ ശ്രമിക്കുകയാണെങ്കിൽ ചില നിരക്കുകൾ നൽകേണ്ടതുണ്ട്ബാങ്ക്. FDവരുമാനം നിക്ഷേപത്തിന് പലിശ ലഭിക്കുന്നു. ഈ പലിശ വരുമാനം നിക്ഷേപകരുടെ കൈകളിൽ നികുതി വിധേയമാണ്.
ഏതാണ് തിരഞ്ഞെടുക്കേണ്ടത്?
എസ്ഐപി മ്യൂച്വൽ ഫണ്ടുകളിലെ ഒരു നിക്ഷേപ രീതിയായതിനാൽ എഫ്ഡി അത് തന്നെ ഒരു നിക്ഷേപ മാർഗമാണ്; രണ്ടും വ്യത്യസ്ത സ്വഭാവങ്ങൾ കാണിക്കുന്നു. അതിനാൽ, അവ രണ്ടും തമ്മിലുള്ള വ്യത്യാസങ്ങൾ നമുക്ക് മനസ്സിലാക്കാം.
കുറഞ്ഞ നിക്ഷേപം
എസ്ഐപി വഴിയുള്ള മ്യൂച്വൽ ഫണ്ടുകളിലെ ഏറ്റവും കുറഞ്ഞ നിക്ഷേപം ആരംഭിക്കുന്നത്500 രൂപ. അതുകൊണ്ട് തന്നെ അത് ആളുകളുടെ പോക്കറ്റിൽ അധികം നുള്ളുന്നില്ലെന്ന് ഉറപ്പാക്കാം. മാത്രമല്ല, ആളുകളുടെ സൗകര്യത്തിനനുസരിച്ച് SIP-യുടെ ആവൃത്തി പ്രതിമാസമോ ത്രൈമാസമോ ആയി സജ്ജീകരിക്കാവുന്നതാണ്. മറുവശത്ത്, FD-യിൽ ഏറ്റവും കുറഞ്ഞ നിക്ഷേപ തുക INR 1-ന് ഇടയിലാണ്.000-10,0000. FD നിക്ഷേപം ലംപ് സം മോഡിലൂടെ ആയതിനാൽ, ആളുകൾ അത് തുടരുന്നില്ലനിക്ഷേപിക്കുന്നു തുക.
കാലാവധി
ഒരു പരമ്പരാഗത നിക്ഷേപ മാർഗമായ FD-കൾ ഹ്രസ്വകാല നിക്ഷേപത്തിനും ദീർഘകാല നിക്ഷേപത്തിനും പരിഗണിക്കപ്പെടുന്നു. FD യുടെ കാലാവധി 6 മാസവും 1 വർഷവും ആകാം, കൂടാതെ 5 വർഷം വരെയാകാം. നേരെമറിച്ച്, ദീർഘകാല നിക്ഷേപത്തിനായി SIP സാധാരണയായി തിരഞ്ഞെടുക്കപ്പെടുന്നു. എസ്ഐപി പൊതുവെ ഇക്വിറ്റി ഫണ്ടുകളുടെ പശ്ചാത്തലത്തിൽ പരാമർശിക്കപ്പെടുന്നതിനാൽ, ദീർഘകാല നിക്ഷേപം പരമാവധി വരുമാനം നേടാൻ നിങ്ങളെ സഹായിക്കും. ഇതുകൂടാതെ, കൂടുതൽ സമയം കൈവശം വച്ചാൽ ആളുകൾക്ക് പരമാവധി ആനുകൂല്യങ്ങൾ ആസ്വദിക്കാനാകും.
മടങ്ങുന്നു
FD-യിലെ റിട്ടേണുകൾ ഒരു നിശ്ചിത കാലയളവിൽ മാറാത്ത പലിശയുടെ രൂപത്തിലാണ് നിശ്ചയിച്ചിരിക്കുന്നത്. 2017-18 സാമ്പത്തിക വർഷത്തിൽ, FD നിരക്കുകൾപരിധി നിക്ഷേപം ഒരു വർഷത്തേക്ക് സൂക്ഷിച്ചാൽ ഏകദേശം 6%-7%. നേരെമറിച്ച്, എസ്ഐപിയുടെ കാര്യത്തിൽ, റിട്ടേണുകൾ സ്ഥിരമല്ല, കാരണം റിട്ടേണുകൾ പ്രകടനത്തെ ആശ്രയിച്ചിരിക്കുന്നു.അടിവരയിടുന്നു ഓഹരി ഓഹരികൾ. എന്നിരുന്നാലും, മ്യൂച്വൽ ഫണ്ടുകൾ അഞ്ച് വർഷത്തിലേറെയായി കൈവശം വച്ചിട്ടുണ്ടെങ്കിൽ 15%-ത്തിലധികം ചരിത്രപരമായ വരുമാനം നൽകിയിട്ടുണ്ട്.
Talk to our investment specialist
റിസ്ക് വിശപ്പ്
എസ്ഐപിയുമായി താരതമ്യപ്പെടുത്തുമ്പോൾ എഫ്ഡിയുടെ അപകടസാധ്യത-വിശപ്പ് കുറവായി കണക്കാക്കപ്പെടുന്നു. FDകൾ സാധാരണയായി ബാങ്കുകൾ വാഗ്ദാനം ചെയ്യുന്നു. മറുവശത്ത്, ദിറിസ്ക് വിശപ്പ് എസ്ഐപി എഫ്ഡിയേക്കാൾ കൂടുതലാണ്. എന്നിരുന്നാലും, SIP ദീർഘകാലത്തേക്ക് കൈവശം വച്ചാൽ, നഷ്ടത്തിന്റെ സാധ്യത കുറയുന്നു.
ദ്രവ്യത
ദിദ്രവ്യത എസ്ഐപിയുടെ കാര്യത്തിൽ എഫ്ഡിയെ അപേക്ഷിച്ച് കൂടുതലാണ്. എസ്ഐപിയുടെ കാര്യത്തിൽ, ആളുകൾ അവരുടെ നിക്ഷേപം വീണ്ടെടുക്കുകയാണെങ്കിൽ അവർക്ക് പണം തിരികെ ലഭിക്കുംഇക്വിറ്റി ഫണ്ടുകൾക്ക് T+3 ദിവസം. എന്നിരുന്നാലും, കാര്യത്തിൽഡെറ്റ് ഫണ്ട്, സെറ്റിൽമെന്റ് കാലയളവ് ആണ്T+1 ദിവസം. എന്നിരുന്നാലും, സ്ഥിര നിക്ഷേപങ്ങളുടെ കാര്യത്തിൽ, അത് വീണ്ടെടുക്കുന്നത് എളുപ്പമല്ല. ആളുകൾ അകാലത്തിൽ പണം പിൻവലിക്കാൻ ശ്രമിച്ചാലും, അവർ ബാങ്കിൽ കുറച്ച് ചാർജുകൾ അടയ്ക്കേണ്ടതുണ്ട്.
നികുതി
മ്യൂച്വൽ ഫണ്ടുകളുടെയും എഫ്ഡികളുടെയും കാര്യത്തിൽ നികുതി നിയമങ്ങൾ വ്യത്യസ്തമാണ്. FD-കളുടെ കാര്യത്തിൽ, 2017-18 സാമ്പത്തിക വർഷത്തിൽ, വ്യക്തിയുടെ പതിവ് നികുതി സ്ലാബുകൾ അനുസരിച്ച് സമ്പാദിച്ച പലിശ ഈടാക്കും. എന്നിരുന്നാലും, എസ്ഐപി പൊതുവെ ഇക്വിറ്റി ഫണ്ടുകളെ സംബന്ധിച്ചുള്ളതിനാൽ, ഇക്വിറ്റി ഫണ്ടുകളുമായി ബന്ധപ്പെട്ട നികുതി നിയമങ്ങൾ ഇനിപ്പറയുന്ന രീതിയിൽ വിശദീകരിക്കുന്നു.
2017-18 സാമ്പത്തിക വർഷത്തിൽ, ഇക്വിറ്റി ഫണ്ടുകൾ വാങ്ങിയ തീയതി മുതൽ ഒരു വർഷത്തിന് ശേഷം വിൽക്കുകയാണെങ്കിൽ, അവ ദീർഘകാലത്തേക്ക് ബാധകമാണ്മൂലധനം നികുതി ബാധകമല്ലാത്ത നേട്ടങ്ങൾ. എന്നിരുന്നാലും, ഈ ഫണ്ടുകൾ വാങ്ങിയ തീയതി മുതൽ ഒരു വർഷത്തിന് മുമ്പ് വിൽക്കുകയാണെങ്കിൽ; അത് ഹ്രസ്വകാലത്തിന് വിധേയമാണ്മൂലധന നേട്ടം a യിൽ ഈടാക്കുന്നത്ഫ്ലാറ്റ് വ്യക്തിയുടെ നികുതി സ്ലാബ് പരിഗണിക്കാതെ 15% നിരക്ക്.
സ്വഭാവഗുണങ്ങൾ
എസ്ഐപിക്ക് രൂപയുടെ ചെലവ് ശരാശരി, എന്നിങ്ങനെ നിരവധി സവിശേഷതകൾ ഉണ്ട്സംയുക്തത്തിന്റെ ശക്തിഎഫ്ഡിയുടെ കാര്യത്തിൽ ലഭ്യമല്ലാത്തതും. അതിനാൽ, ഈ സവിശേഷതകൾ എന്താണ് അർത്ഥമാക്കുന്നത് എന്ന് നോക്കാം.
1. രൂപയുടെ ചെലവ് ശരാശരി
എസ്ഐപിയുടെ കാര്യത്തിൽ, ആളുകൾമ്യൂച്വൽ ഫണ്ടിൽ നിക്ഷേപിക്കുക വിപണികൾ വ്യത്യസ്ത വില സ്വഭാവം കാണിക്കുമ്പോൾ കൃത്യമായ സമയ കാലയളവിലെ യൂണിറ്റുകൾ. അതിനാൽ, വിപണികൾ മാന്ദ്യം കാണിക്കുമ്പോൾ, ആളുകൾക്ക് കൂടുതൽ യൂണിറ്റുകൾ വാങ്ങാം, തിരിച്ചും. അതിനാൽ, SIP കാരണം യൂണിറ്റുകളുടെ വാങ്ങൽ വില ശരാശരിയായി ലഭിക്കുന്നു. എന്നിരുന്നാലും, എഫ്ഡിയുടെ കാര്യത്തിൽ, തുക ഒരു തവണ മാത്രം നിക്ഷേപിക്കുന്നതിനാൽ ഈ ഫീച്ചർ ലഭ്യമല്ല.
2. പവർ ഓഫ് കോമ്പൗണ്ടിംഗ്
കോമ്പൗണ്ടിംഗിന് SIP ബാധകമാണ്. കോമ്പൗണ്ടിംഗ് എന്നത് സംയുക്ത പലിശയെ സൂചിപ്പിക്കുന്നു, അവിടെ പലിശ തുക മുഖ്യ തുകയും ഇതിനകം സഞ്ചിത പലിശയും കണക്കാക്കുന്നു. എഫ്ഡിയുടെ കാര്യത്തിൽ, പലിശ തുകയും കോമ്പൗണ്ടിംഗിന് വിധേയമാണ്.
3. അച്ചടക്കമുള്ള സമ്പാദ്യശീലം
ആളുകൾക്ക് കൃത്യമായ ഇടവേളകളിൽ പണം നിക്ഷേപിക്കേണ്ടതിനാൽ SIP വ്യക്തികൾക്കിടയിൽ അച്ചടക്കമുള്ള സമ്പാദ്യശീലം വികസിപ്പിക്കുന്നു. നേരെമറിച്ച്, FD-യിൽ ആളുകൾ ഒരിക്കൽ മാത്രം പണം നിക്ഷേപിക്കുന്നതിനാൽ, അവർ അച്ചടക്കത്തോടെയുള്ള സമ്പാദ്യശീലം വളർത്തിയെടുക്കുകയോ ചെയ്യാതിരിക്കുകയോ ചെയ്യാം.
താഴെ നൽകിയിരിക്കുന്ന പട്ടിക എസ്ഐപിയും ഫിക്സഡ് ഡിപ്പോസിറ്റുകളും തമ്മിലുള്ള വ്യത്യാസങ്ങൾ സംഗ്രഹിക്കുന്നു.
| പരാമീറ്ററുകൾ | എസ്.ഐ.പി | സ്ഥിര നിക്ഷേപങ്ങൾ |
|---|---|---|
| മടങ്ങുന്നു | ഫണ്ടിന്റെ പ്രകടനം അനുസരിച്ച് വ്യത്യാസപ്പെടുന്നു | മുൻകൂട്ടി നിശ്ചയിച്ചത് |
| കുറഞ്ഞ നിക്ഷേപം | 500 രൂപ മുതൽ ആരംഭിക്കുന്നു | 1,000-10,000 രൂപയ്ക്കിടയിലുള്ള ശ്രേണി |
| കാലാവധി | സാധാരണയായി ദീർഘകാലത്തേക്ക് ഉപയോഗിക്കുന്നു | ഹ്രസ്വകാലവും ദീർഘകാലവുമായ കാലാവധി |
| റിസ്ക് | ഉയർന്ന | താഴ്ന്നത് |
| ദ്രവ്യത | ഉയർന്ന | താഴ്ന്നത് |
| നികുതി | ഷോർട്ട് ടേം: 15% ഫ്ലാറ്റ് നിരക്കിൽ നികുതി ചുമത്തിദീർഘകാല: നികുതി ചുമത്തിയിട്ടില്ല | വ്യക്തിയുടെ സ്ലാബ് നിരക്കുകൾ അനുസരിച്ച് നികുതി ചുമത്തുന്നു |
| സവിശേഷതകൾ | റുപ്പി കോസ്റ്റ് ആവറേജിംഗ്, പവർ ഓഫ് കോമ്പൗണ്ടിംഗ്, & അച്ചടക്കമുള്ള സേവിംഗ്സ് ശീലം | സംയുക്തത്തിന്റെ ശക്തി |
FY 22 - 23 ലേക്ക് നിക്ഷേപിക്കുന്നതിനുള്ള മികച്ച SIP
The primary objective of the Scheme is to achieve long-term capital appreciation by investing in equity & equity related instruments of mid cap & small cap companies. Principal Emerging Bluechip Fund is a Equity - Large & Mid Cap fund was launched on 12 Nov 08. It is a fund with Moderately High risk and has given a Below is the key information for Principal Emerging Bluechip Fund Returns up to 1 year are on (Erstwhile Motilal Oswal MOSt Focused Multicap 35 Fund) The investment objective of the Scheme is to achieve long term capital appreciation by primarily investing in a maximum of 35 equity & equity related instruments across sectors and market-capitalization levels.However, there can be no assurance or guarantee that the investment objective of the Scheme would be achieved. Motilal Oswal Multicap 35 Fund is a Equity - Multi Cap fund was launched on 28 Apr 14. It is a fund with Moderately High risk and has given a Below is the key information for Motilal Oswal Multicap 35 Fund Returns up to 1 year are on (Erstwhile Invesco India Growth Fund) The investment objective of the Scheme is to generate long-term capital growth from a diversified portfolio of predominantly equity and equity-related securities. However, there can be no assurance that the objectives of the scheme will be achieved. Invesco India Growth Opportunities Fund is a Equity - Large & Mid Cap fund was launched on 9 Aug 07. It is a fund with Moderately High risk and has given a Below is the key information for Invesco India Growth Opportunities Fund Returns up to 1 year are on (Erstwhile DSP BlackRock Opportunities Fund) The primary investment objective is to seek to generate long term capital appreciation from a portfolio that is substantially constituted of equity and equity related securities of large and midcap companies. From time to time, the fund manager will also seek participation in other equity and equity related securities to achieve optimal portfolio construction. There is no assurance that the investment objective of the Scheme will be realized DSP BlackRock Equity Opportunities Fund is a Equity - Large & Mid Cap fund was launched on 16 May 00. It is a fund with Moderately High risk and has given a Below is the key information for DSP BlackRock Equity Opportunities Fund Returns up to 1 year are on (Erstwhile Sundaram Rural India Fund) The primary investment objective of the scheme is to generate consistent long-term returns by investing predominantly in equity & equity related instruments of companies that are focusing on Rural India. Sundaram Rural and Consumption Fund is a Equity - Sectoral fund was launched on 12 May 06. It is a fund with Moderately High risk and has given a Below is the key information for Sundaram Rural and Consumption Fund Returns up to 1 year are on Fund NAV Net Assets (Cr) Min SIP Investment 3 MO (%) 6 MO (%) 1 YR (%) 3 YR (%) 5 YR (%) 2024 (%) Principal Emerging Bluechip Fund Growth ₹183.316
↑ 2.03 ₹3,124 100 2.9 13.6 38.9 21.9 19.2 Motilal Oswal Multicap 35 Fund Growth ₹53.8796
↓ -0.15 ₹11,855 500 -17.5 -13.2 17.4 20.3 18.1 45.7 Invesco India Growth Opportunities Fund Growth ₹81.41
↓ -0.24 ₹6,250 100 -17.3 -15.7 12.8 18.6 20.8 37.5 DSP BlackRock Equity Opportunities Fund Growth ₹545.549
↓ -3.47 ₹13,444 500 -12.3 -14.3 10.8 18.4 22 23.9 Sundaram Rural and Consumption Fund Growth ₹85.8746
↓ -0.31 ₹1,518 100 -13.7 -17.3 9.1 16.8 17.4 20.1 Note: Returns up to 1 year are on absolute basis & more than 1 year are on CAGR basis. as on 31 Dec 21 1. Principal Emerging Bluechip Fund
CAGR/Annualized return of 24.8% since its launch. Ranked 1 in Large & Mid Cap category. . Principal Emerging Bluechip Fund
Growth Launch Date 12 Nov 08 NAV (31 Dec 21) ₹183.316 ↑ 2.03 (1.12 %) Net Assets (Cr) ₹3,124 on 30 Nov 21 Category Equity - Large & Mid Cap AMC Principal Pnb Asset Mgmt. Co. Priv. Ltd. Rating ☆☆☆☆☆ Risk Moderately High Expense Ratio 2.08 Sharpe Ratio 2.74 Information Ratio 0.22 Alpha Ratio 2.18 Min Investment 5,000 Min SIP Investment 100 Exit Load 0-1 Years (1%),1 Years and above(NIL) Growth of 10,000 investment over the years.
Date Value 29 Feb 20 ₹10,000 28 Feb 21 ₹13,144 Returns for Principal Emerging Bluechip Fund
absolute basis & more than 1 year are on CAGR (Compound Annual Growth Rate) basis. as on 31 Dec 21 Duration Returns 1 Month 2.9% 3 Month 2.9% 6 Month 13.6% 1 Year 38.9% 3 Year 21.9% 5 Year 19.2% 10 Year 15 Year Since launch 24.8% Historical performance (Yearly) on absolute basis
Year Returns 2024 2023 2022 2021 2020 2019 2018 2017 2016 2015 Fund Manager information for Principal Emerging Bluechip Fund
Name Since Tenure Data below for Principal Emerging Bluechip Fund as on 30 Nov 21
Equity Sector Allocation
Sector Value Asset Allocation
Asset Class Value Top Securities Holdings / Portfolio
Name Holding Value Quantity 2. Motilal Oswal Multicap 35 Fund
CAGR/Annualized return of 16.8% since its launch. Ranked 5 in Multi Cap category. Return for 2024 was 45.7% , 2023 was 31% and 2022 was -3% . Motilal Oswal Multicap 35 Fund
Growth Launch Date 28 Apr 14 NAV (13 Mar 25) ₹53.8796 ↓ -0.15 (-0.27 %) Net Assets (Cr) ₹11,855 on 31 Jan 25 Category Equity - Multi Cap AMC Motilal Oswal Asset Management Co. Ltd Rating ☆☆☆☆☆ Risk Moderately High Expense Ratio 0.94 Sharpe Ratio 0.9 Information Ratio 0.49 Alpha Ratio 13.01 Min Investment 5,000 Min SIP Investment 500 Exit Load 0-1 Years (1%),1 Years and above(NIL) Growth of 10,000 investment over the years.
Date Value 29 Feb 20 ₹10,000 28 Feb 21 ₹11,931 28 Feb 22 ₹12,199 28 Feb 23 ₹12,226 29 Feb 24 ₹18,009 28 Feb 25 ₹20,280 Returns for Motilal Oswal Multicap 35 Fund
absolute basis & more than 1 year are on CAGR (Compound Annual Growth Rate) basis. as on 31 Dec 21 Duration Returns 1 Month -3.3% 3 Month -17.5% 6 Month -13.2% 1 Year 17.4% 3 Year 20.3% 5 Year 18.1% 10 Year 15 Year Since launch 16.8% Historical performance (Yearly) on absolute basis
Year Returns 2024 45.7% 2023 31% 2022 -3% 2021 15.3% 2020 10.3% 2019 7.9% 2018 -7.8% 2017 43.1% 2016 8.5% 2015 14.6% Fund Manager information for Motilal Oswal Multicap 35 Fund
Name Since Tenure Ajay Khandelwal 1 Oct 24 0.41 Yr. Niket Shah 1 Jul 22 2.67 Yr. Santosh Singh 1 Aug 23 1.58 Yr. Rakesh Shetty 22 Nov 22 2.27 Yr. Atul Mehra 1 Oct 24 0.41 Yr. Sunil Sawant 1 Jul 24 0.67 Yr. Data below for Motilal Oswal Multicap 35 Fund as on 31 Jan 25
Equity Sector Allocation
Sector Value Consumer Cyclical 22.53% Technology 21.94% Industrials 18.17% Financial Services 9.9% Communication Services 9.17% Health Care 1.79% Asset Allocation
Asset Class Value Cash 20.96% Equity 79.04% Top Securities Holdings / Portfolio
Name Holding Value Quantity Coforge Ltd (Technology)
Equity, Since 31 May 23 | COFORGE9% ₹1,126 Cr 1,362,525
↓ -77,475 Persistent Systems Ltd (Technology)
Equity, Since 31 Mar 23 | PERSISTENT9% ₹1,084 Cr 1,796,350
↓ -203,650 Polycab India Ltd (Industrials)
Equity, Since 31 Jan 24 | POLYCAB9% ₹1,079 Cr 1,786,833
↓ -13,167 Trent Ltd (Consumer Cyclical)
Equity, Since 31 Jan 23 | 5002519% ₹1,056 Cr 1,835,546
↑ 10,546 Kalyan Jewellers India Ltd (Consumer Cyclical)
Equity, Since 30 Sep 23 | KALYANKJIL7% ₹868 Cr 17,250,000 Mahindra & Mahindra Ltd (Consumer Cyclical)
Equity, Since 31 Oct 24 | M&M6% ₹747 Cr 2,500,000
↓ -750,000 Bharti Airtel Ltd (Partly Paid Rs.1.25) (Communication Services)
Equity, Since 30 Apr 24 | 8901575% ₹600 Cr 5,000,000 Cholamandalam Investment and Finance Co Ltd (Financial Services)
Equity, Since 31 Mar 23 | CHOLAFIN5% ₹579 Cr 4,500,000 Bharti Airtel Ltd (Communication Services)
Equity, Since 30 Apr 24 | BHARTIARTL4% ₹488 Cr 3,000,000 CG Power & Industrial Solutions Ltd (Industrials)
Equity, Since 31 Jan 25 | 5000933% ₹413 Cr 6,500,000
↑ 6,500,000 3. Invesco India Growth Opportunities Fund
CAGR/Annualized return of 12.7% since its launch. Ranked 6 in Large & Mid Cap category. Return for 2024 was 37.5% , 2023 was 31.6% and 2022 was -0.4% . Invesco India Growth Opportunities Fund
Growth Launch Date 9 Aug 07 NAV (13 Mar 25) ₹81.41 ↓ -0.24 (-0.29 %) Net Assets (Cr) ₹6,250 on 31 Jan 25 Category Equity - Large & Mid Cap AMC Invesco Asset Management (India) Private Ltd Rating ☆☆☆☆☆ Risk Moderately High Expense Ratio 1.88 Sharpe Ratio 0.84 Information Ratio 0.37 Alpha Ratio 8.74 Min Investment 5,000 Min SIP Investment 100 Exit Load 0-1 Years (1%),1 Years and above(NIL) Growth of 10,000 investment over the years.
Date Value 29 Feb 20 ₹10,000 28 Feb 21 ₹12,351 28 Feb 22 ₹13,887 28 Feb 23 ₹14,248 29 Feb 24 ₹21,121 28 Feb 25 ₹22,851 Returns for Invesco India Growth Opportunities Fund
absolute basis & more than 1 year are on CAGR (Compound Annual Growth Rate) basis. as on 31 Dec 21 Duration Returns 1 Month -4.1% 3 Month -17.3% 6 Month -15.7% 1 Year 12.8% 3 Year 18.6% 5 Year 20.8% 10 Year 15 Year Since launch 12.7% Historical performance (Yearly) on absolute basis
Year Returns 2024 37.5% 2023 31.6% 2022 -0.4% 2021 29.7% 2020 13.3% 2019 10.7% 2018 -0.2% 2017 39.6% 2016 3.3% 2015 3.8% Fund Manager information for Invesco India Growth Opportunities Fund
Name Since Tenure Aditya Khemani 9 Nov 23 1.31 Yr. Amit Ganatra 21 Jan 22 3.11 Yr. Data below for Invesco India Growth Opportunities Fund as on 31 Jan 25
Equity Sector Allocation
Sector Value Financial Services 27.46% Consumer Cyclical 23.77% Health Care 13.77% Industrials 10.04% Technology 8.91% Real Estate 6.66% Basic Materials 4.9% Consumer Defensive 2.25% Communication Services 1.96% Asset Allocation
Asset Class Value Cash 0.27% Equity 99.73% Top Securities Holdings / Portfolio
Name Holding Value Quantity Trent Ltd (Consumer Cyclical)
Equity, Since 28 Feb 22 | 5002514% ₹278 Cr 483,608
↑ 62,658 InterGlobe Aviation Ltd (Industrials)
Equity, Since 31 Mar 24 | INDIGO4% ₹265 Cr 612,171
↑ 38,698 ICICI Bank Ltd (Financial Services)
Equity, Since 31 Dec 15 | ICICIBANK4% ₹260 Cr 2,077,721
↑ 399,318 Cholamandalam Investment and Finance Co Ltd (Financial Services)
Equity, Since 28 Feb 23 | CHOLAFIN4% ₹236 Cr 1,837,608
↑ 217,790 Swiggy Ltd (Consumer Cyclical)
Equity, Since 30 Nov 24 | SWIGGY4% ₹220 Cr 5,292,395
↑ 2,115,144 Max Healthcare Institute Ltd Ordinary Shares (Healthcare)
Equity, Since 30 Nov 22 | MAXHEALTH3% ₹212 Cr 1,993,259 Zomato Ltd (Consumer Cyclical)
Equity, Since 30 Jun 23 | 5433203% ₹202 Cr 9,152,597
↑ 2,446,793 BSE Ltd (Financial Services)
Equity, Since 31 Oct 23 | BSE3% ₹200 Cr 376,990 Dixon Technologies (India) Ltd (Technology)
Equity, Since 30 Sep 22 | DIXON3% ₹195 Cr 130,340 L&T Finance Ltd (Financial Services)
Equity, Since 30 Apr 24 | LTF3% ₹195 Cr 13,404,597
↑ 949,280 4. DSP BlackRock Equity Opportunities Fund
CAGR/Annualized return of 17.5% since its launch. Ranked 4 in Large & Mid Cap category. Return for 2024 was 23.9% , 2023 was 32.5% and 2022 was 4.4% . DSP BlackRock Equity Opportunities Fund
Growth Launch Date 16 May 00 NAV (13 Mar 25) ₹545.549 ↓ -3.47 (-0.63 %) Net Assets (Cr) ₹13,444 on 31 Jan 25 Category Equity - Large & Mid Cap AMC DSP BlackRock Invmt Managers Pvt. Ltd. Rating ☆☆☆☆☆ Risk Moderately High Expense Ratio 1.88 Sharpe Ratio 0.63 Information Ratio 0.16 Alpha Ratio 4.23 Min Investment 1,000 Min SIP Investment 500 Exit Load 0-12 Months (1%),12 Months and above(NIL) Growth of 10,000 investment over the years.
Date Value 29 Feb 20 ₹10,000 28 Feb 21 ₹12,843 28 Feb 22 ₹14,709 28 Feb 23 ₹15,596 29 Feb 24 ₹22,326 28 Feb 25 ₹23,616 Returns for DSP BlackRock Equity Opportunities Fund
absolute basis & more than 1 year are on CAGR (Compound Annual Growth Rate) basis. as on 31 Dec 21 Duration Returns 1 Month -2.4% 3 Month -12.3% 6 Month -14.3% 1 Year 10.8% 3 Year 18.4% 5 Year 22% 10 Year 15 Year Since launch 17.5% Historical performance (Yearly) on absolute basis
Year Returns 2024 23.9% 2023 32.5% 2022 4.4% 2021 31.2% 2020 14.2% 2019 11.4% 2018 -9.2% 2017 40.1% 2016 11.2% 2015 6.1% Fund Manager information for DSP BlackRock Equity Opportunities Fund
Name Since Tenure Rohit Singhania 1 Jun 15 9.76 Yr. Data below for DSP BlackRock Equity Opportunities Fund as on 31 Jan 25
Equity Sector Allocation
Sector Value Financial Services 32.76% Basic Materials 10.92% Consumer Cyclical 10.79% Health Care 9.87% Technology 7.57% Industrials 6.88% Energy 5.95% Utility 4.51% Consumer Defensive 4.17% Communication Services 3.27% Real Estate 1.13% Asset Allocation
Asset Class Value Cash 2.18% Equity 97.82% Top Securities Holdings / Portfolio
Name Holding Value Quantity ICICI Bank Ltd (Financial Services)
Equity, Since 31 Oct 16 | ICICIBANK5% ₹637 Cr 5,087,254
↓ -279,997 HDFC Bank Ltd (Financial Services)
Equity, Since 31 Oct 08 | HDFCBANK5% ₹620 Cr 3,647,782
↓ -202,369 Axis Bank Ltd (Financial Services)
Equity, Since 30 Sep 20 | 5322154% ₹520 Cr 5,272,691
↑ 685,031 State Bank of India (Financial Services)
Equity, Since 30 Jun 20 | SBIN3% ₹414 Cr 5,356,659
↑ 769,911 Kotak Mahindra Bank Ltd (Financial Services)
Equity, Since 31 Oct 22 | KOTAKBANK3% ₹412 Cr 2,168,587
↓ -334,046 Infosys Ltd (Technology)
Equity, Since 28 Feb 18 | INFY2% ₹322 Cr 1,714,083 Larsen & Toubro Ltd (Industrials)
Equity, Since 30 Jun 24 | LT2% ₹290 Cr 813,304
↑ 118,185 Cipla Ltd (Healthcare)
Equity, Since 30 Apr 23 | 5000872% ₹284 Cr 1,919,149
↑ 93,780 Hindustan Petroleum Corp Ltd (Energy)
Equity, Since 30 Jun 22 | HINDPETRO2% ₹281 Cr 7,840,242
↑ 372,472 Ipca Laboratories Ltd (Healthcare)
Equity, Since 30 Sep 18 | 5244942% ₹274 Cr 1,901,164 5. Sundaram Rural and Consumption Fund
CAGR/Annualized return of 12.1% since its launch. Ranked 2 in Sectoral category. Return for 2024 was 20.1% , 2023 was 30.2% and 2022 was 9.3% . Sundaram Rural and Consumption Fund
Growth Launch Date 12 May 06 NAV (13 Mar 25) ₹85.8746 ↓ -0.31 (-0.36 %) Net Assets (Cr) ₹1,518 on 31 Jan 25 Category Equity - Sectoral AMC Sundaram Asset Management Company Ltd Rating ☆☆☆☆☆ Risk Moderately High Expense Ratio 2.23 Sharpe Ratio 0.63 Information Ratio -0.03 Alpha Ratio 0.8 Min Investment 5,000 Min SIP Investment 100 Exit Load 0-12 Months (1%),12 Months and above(NIL) Growth of 10,000 investment over the years.
Date Value 29 Feb 20 ₹10,000 28 Feb 21 ₹11,448 28 Feb 22 ₹13,007 28 Feb 23 ₹13,929 29 Feb 24 ₹18,860 28 Feb 25 ₹20,135 Returns for Sundaram Rural and Consumption Fund
absolute basis & more than 1 year are on CAGR (Compound Annual Growth Rate) basis. as on 31 Dec 21 Duration Returns 1 Month -5.8% 3 Month -13.7% 6 Month -17.3% 1 Year 9.1% 3 Year 16.8% 5 Year 17.4% 10 Year 15 Year Since launch 12.1% Historical performance (Yearly) on absolute basis
Year Returns 2024 20.1% 2023 30.2% 2022 9.3% 2021 19.3% 2020 13.5% 2019 2.7% 2018 -7.8% 2017 38.7% 2016 21.1% 2015 6.3% Fund Manager information for Sundaram Rural and Consumption Fund
Name Since Tenure Ratish Varier 1 Jan 22 3.16 Yr. Data below for Sundaram Rural and Consumption Fund as on 31 Jan 25
Equity Sector Allocation
Sector Value Consumer Cyclical 43.4% Consumer Defensive 32.21% Communication Services 12.27% Health Care 2.81% Financial Services 2.64% Real Estate 1.64% Basic Materials 1.46% Asset Allocation
Asset Class Value Cash 3.57% Equity 96.43% Top Securities Holdings / Portfolio
Name Holding Value Quantity Bharti Airtel Ltd (Communication Services)
Equity, Since 31 Oct 22 | BHARTIARTL10% ₹153 Cr 939,519 ITC Ltd (Consumer Defensive)
Equity, Since 31 Jul 13 | ITC9% ₹134 Cr 2,991,251 Titan Co Ltd (Consumer Cyclical)
Equity, Since 29 Feb 20 | TITAN7% ₹106 Cr 303,263 Mahindra & Mahindra Ltd (Consumer Cyclical)
Equity, Since 30 Apr 22 | M&M7% ₹105 Cr 350,492 Hindustan Unilever Ltd (Consumer Defensive)
Equity, Since 30 Apr 16 | HINDUNILVR6% ₹86 Cr 350,212 Maruti Suzuki India Ltd (Consumer Cyclical)
Equity, Since 31 Jul 12 | MARUTI5% ₹83 Cr 67,306 Zomato Ltd (Consumer Cyclical)
Equity, Since 31 May 24 | 5433204% ₹66 Cr 3,000,962 United Spirits Ltd (Consumer Defensive)
Equity, Since 31 Dec 18 | UNITDSPR4% ₹65 Cr 453,496 Safari Industries (India) Ltd (Consumer Cyclical)
Equity, Since 28 Feb 22 | 5230254% ₹59 Cr 245,560 Trent Ltd (Consumer Cyclical)
Equity, Since 29 Feb 24 | 5002513% ₹50 Cr 86,291
↑ 9,192
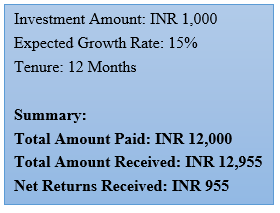
SIP റിട്ടേൺ കാൽക്കുലേറ്റർ
എസ്ഐപിയുടെ റിട്ടേണുകൾ വ്യത്യാസപ്പെടുന്നു. എന്നിരുന്നാലും, റിട്ടേണുകളുടെ ചരിത്രപരമായ നിരക്ക് 15% ആണെന്ന് കരുതുക, 12 മാസ കാലയളവിൽ INR 1,000 ന്റെ SIP നിക്ഷേപം എങ്ങനെ വളരുന്നുവെന്ന് നോക്കാം.
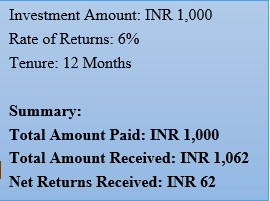
FD കാൽക്കുലേറ്റർ
FD നിരക്കുകളും ഓരോ ബാങ്കിനും വ്യത്യാസപ്പെട്ടുകൊണ്ടിരിക്കുന്നു. എന്നിരുന്നാലും, പലിശ നിരക്ക് 6% ആണെന്ന് കരുതുക, നിക്ഷേപ തുക INR 1,000 ആണെങ്കിൽ 12 മാസ കാലയളവിൽ FD എങ്ങനെ പ്രവർത്തിക്കുമെന്ന് നോക്കാം.
MF SIP ഓൺലൈനിൽ എങ്ങനെ നിക്ഷേപിക്കാം?
Fincash.com-ൽ ആജീവനാന്ത സൗജന്യ നിക്ഷേപ അക്കൗണ്ട് തുറക്കുക.
നിങ്ങളുടെ രജിസ്ട്രേഷനും KYC പ്രക്രിയയും പൂർത്തിയാക്കുക
രേഖകൾ അപ്ലോഡ് ചെയ്യുക (പാൻ, ആധാർ മുതലായവ).കൂടാതെ, നിങ്ങൾ നിക്ഷേപിക്കാൻ തയ്യാറാണ്!
ഉപസംഹാരം: SIP അല്ലെങ്കിൽ FD
ഉപസംഹാരമായി, എഫ്ഡിയുമായി താരതമ്യപ്പെടുത്തുമ്പോൾ എസ്ഐപിക്ക് കൂടുതൽ നേട്ടങ്ങളുണ്ടെന്ന് പറയാം. എന്നിരുന്നാലും, നിക്ഷേപം നടത്തുന്നതിന് മുമ്പ് ഒരു സ്കീമിന്റെ പ്രവർത്തനം പൂർണ്ണമായും മനസ്സിലാക്കണമെന്ന് ആളുകൾക്ക് എപ്പോഴും ഉപദേശിക്കാറുണ്ട്. കൂടാതെ, അവർക്ക് ഒരു വ്യക്തിയുമായി കൂടിയാലോചിക്കാംസാമ്പത്തിക ഉപദേഷ്ടാവ് അവരുടെ നിക്ഷേപം സുരക്ഷിതമാണെന്നും അവരുടെ ലക്ഷ്യങ്ങൾ നിറവേറ്റപ്പെടുന്നുവെന്നും ഉറപ്പാക്കാൻ.
ഇവിടെ നൽകിയിരിക്കുന്ന വിവരങ്ങൾ കൃത്യമാണെന്ന് ഉറപ്പാക്കാൻ എല്ലാ ശ്രമങ്ങളും നടത്തിയിട്ടുണ്ട്. എന്നിരുന്നാലും, ഡാറ്റയുടെ കൃത്യത സംബന്ധിച്ച് യാതൊരു ഉറപ്പും നൽകുന്നില്ല. എന്തെങ്കിലും നിക്ഷേപം നടത്തുന്നതിന് മുമ്പ് സ്കീം വിവര രേഖ ഉപയോഗിച്ച് പരിശോധിക്കുക.


")


AMFI Registration No. 112358 | CIN: U74999MH2016PTC282153
Shepard Technologies Pvt. Ltd. (with ARN code 112358) makes no warranties or representations, express or implied, on products offered through the platform. It accepts no liability for any damages or losses, however caused, in connection with the use of, or on the reliance of its product or related services. Terms and conditions of the website are applicable.
©2025 Shepard Technologies Private Limited. All Rights Reserved