 +91-22-48913909
Table of Contents
- ഫണ്ട് ഓഫ് ഫണ്ടുകൾ എന്തൊക്കെയാണ്?
- ഫണ്ടുകളുടെ ഫണ്ടുകളുടെ തരങ്ങൾ എന്തൊക്കെയാണ്?
- ഫണ്ട് ഓഫ് ഫണ്ടുകളിൽ ആരാണ് നിക്ഷേപിക്കേണ്ടത്?
- ഫണ്ട് ഓഫ് ഫണ്ടുകളിൽ നിക്ഷേപിക്കുന്നതിന്റെ പ്രയോജനങ്ങൾ
- ഫണ്ട് ഓഫ് ഫണ്ടുകളുടെ പരിമിതികൾ
- 2022-ൽ നിക്ഷേപിക്കാൻ ഏറ്റവും മികച്ച ഫണ്ട് ഫണ്ട്
- ഫണ്ട് ഓഫ് ഫണ്ടുകളുടെ പ്രയോജനങ്ങൾ
- ഒരു ഫണ്ട് ഫണ്ട് എങ്ങനെയാണ് പ്രവർത്തിക്കുന്നത്?
- എന്തുകൊണ്ടാണ് ഫണ്ടുകളുടെ ഫണ്ട് തിരഞ്ഞെടുക്കുന്നത്?
- FOF മ്യൂച്വൽ ഫണ്ടുകളിൽ ഓൺലൈനിൽ എങ്ങനെ നിക്ഷേപിക്കാം?
- പതിവുചോദ്യങ്ങൾ
- 1. FOF-കളുടെ ഏറ്റവും പ്രധാനപ്പെട്ട നേട്ടം എന്താണ്?
- 2. വ്യത്യസ്ത തരം FOF-കൾ ഏതൊക്കെയാണ്?
- 3. FOF-കളിൽ നിക്ഷേപിക്കുമ്പോൾ പരിഗണിക്കേണ്ട പാരാമീറ്ററുകൾ എന്തൊക്കെയാണ്?
- 4. ഏത് FOF ആണ് മികച്ച വരുമാനം കാണിച്ചത്?
- 5. ഏറ്റവും സാധാരണമായ ഏതെങ്കിലും FOF-കൾ ഉണ്ടോ?
- 6. FOF ന്റെ ഏറ്റവും നിർണായകമായ പരിമിതികളിൽ ഒന്ന് എന്താണ്?
- 7. FOF-കൾക്ക് ദീർഘമായ ലോക്ക്-ഇൻ പിരീഡ് ഉണ്ടോ?
Top 7 Funds
- IDBI Nifty Index Fund
- ICICI Prudential Advisor Series - Passive Strategy Fund
- ICICI Prudential Advisor Series - Hybrid Fund
- Aditya Birla Sun Life Financial Planning FOF Aggressive Plan
- ICICI Prudential Advisor Series - Conservative Fund
- ICICI Prudential Advisor Series - Debt Management Fund
- Kotak Asset Allocator Fund - FOF
2022 ലെ ഇന്ത്യയിലെ ഏറ്റവും മികച്ച ഫണ്ടുകളുടെ 7
ഫണ്ടുകളുടെ ഫണ്ട് അതിലൊന്നാണ്മുൻനിര മ്യൂച്വൽ ഫണ്ടുകൾ നിക്ഷേപ തുകകൾ വളരെ വലുതല്ലാത്ത നിക്ഷേപകർക്ക് ഒരു ഫണ്ട് (ഫണ്ടുകളുടെ ഒരു ഫണ്ട്) കൈകാര്യം ചെയ്യാൻ എളുപ്പമാണ്മ്യൂച്വൽ ഫണ്ടുകൾ. മ്യൂച്വൽ ഫണ്ട് നിക്ഷേപ തന്ത്രത്തിന്റെ ഈ രൂപത്തിൽ, നിക്ഷേപകർക്ക് ഒരു ഫണ്ടിന്റെ കുടക്കീഴിൽ നിരവധി ഫണ്ടുകൾ കൈവശം വയ്ക്കാൻ കഴിയും, അതിനാൽ ഫണ്ടുകളുടെ ഫണ്ടുകൾ എന്ന് പേര്.
പലപ്പോഴും മൾട്ടി മാനേജർ നിക്ഷേപം എന്ന പേരിൽ പോകുന്നു; ഇത് മ്യൂച്വൽ ഫണ്ട് വിഭാഗങ്ങളിലൊന്നായി കണക്കാക്കപ്പെടുന്നു. മൾട്ടി-മാനേജർ നിക്ഷേപങ്ങളുടെ പ്രധാന നേട്ടങ്ങളിലൊന്ന്, കുറഞ്ഞ ടിക്കറ്റ് വലുപ്പത്തിൽ,നിക്ഷേപകൻ മ്യൂച്വൽ ഫണ്ട് സ്കീമുകളുടെ ഒരു ശ്രേണിയിലുടനീളം സ്വയം വൈവിധ്യവത്കരിക്കാനാകും. അതിനാൽ, ഫണ്ടുകളുടെ ഫണ്ടിൽ എന്തിന് നിക്ഷേപിക്കണം, ഫണ്ടുകളുടെ ഫണ്ടിന്റെ നേട്ടങ്ങൾ, ഇന്ത്യയിലെ ഫണ്ടുകളുടെ ഫണ്ട്, ഫണ്ടുകളുടെ ഫണ്ടിന്റെ പ്രകടനം, മറ്റ് പ്രധാന വശങ്ങൾ എന്നിങ്ങനെയുള്ള ഫണ്ടുകളുടെ നിരവധി വശങ്ങളിലൂടെ നമുക്ക് പോകാം.
ഫണ്ട് ഓഫ് ഫണ്ടുകൾ എന്തൊക്കെയാണ്?
ലളിതമായി പറഞ്ഞാൽ, എമ്യൂച്വൽ ഫണ്ട് നിക്ഷേപം മറ്റൊരു മ്യൂച്വൽ ഫണ്ടിൽ (ഒന്നോ അതിലധികമോ) ശേഖരിച്ച പണത്തെ ഫണ്ടുകളുടെ ഫണ്ട് എന്ന് വിളിക്കുന്നു. അവരുടെ പോർട്ട്ഫോളിയോകളിലെ നിക്ഷേപകർ വ്യത്യസ്ത ഫണ്ടുകളിലേക്ക് എക്സ്പോഷർ ചെയ്യുകയും അവ പ്രത്യേകം ട്രാക്ക് ചെയ്യുകയും ചെയ്യുന്നു. എന്നിരുന്നാലും, വഴിനിക്ഷേപിക്കുന്നു മൾട്ടി-മാനേജർ മ്യൂച്വൽ ഫണ്ടുകളിൽ ഈ പ്രക്രിയ കൂടുതൽ ലളിതമാക്കുന്നു, കാരണം നിക്ഷേപകർക്ക് ഒരു ഫണ്ട് മാത്രമേ ട്രാക്ക് ചെയ്യേണ്ടതുള്ളൂ, അത് അതിനുള്ളിൽ നിരവധി മ്യൂച്വൽ ഫണ്ടുകൾ സൂക്ഷിക്കുന്നു. സ്റ്റോക്കുകൾ പോലുള്ള വിവിധ സാമ്പത്തിക ആസ്തികളിൽ എക്സ്പോഷർ ഉള്ള 10 വ്യത്യസ്ത ഫണ്ടുകളിൽ ഒരു വ്യക്തി നിക്ഷേപിച്ചിട്ടുണ്ടെന്ന് കരുതുക.ബോണ്ടുകൾ, ഗവൺമെന്റ് സെക്യൂരിറ്റികൾ, സ്വർണ്ണം മുതലായവ. എന്നിരുന്നാലും, ഓരോ ഫണ്ടിന്റെയും പ്രത്യേകം ട്രാക്ക് ചെയ്യേണ്ടതിനാൽ ആ ഫണ്ടുകൾ കൈകാര്യം ചെയ്യുന്നത് അദ്ദേഹത്തിന് ബുദ്ധിമുട്ടാണ്. അതിനാൽ, അത്തരം തടസ്സങ്ങൾ ഒഴിവാക്കാൻ, നിക്ഷേപകൻ വിവിധ മ്യൂച്വൽ ഫണ്ടുകളിൽ അതിന്റെ ഓഹരികളുള്ള ഒരു മൾട്ടി-മാനേജ്മെന്റ് നിക്ഷേപത്തിൽ (അല്ലെങ്കിൽ ഫണ്ടുകളുടെ ഒരു ഫണ്ട് തന്ത്രം) പണം നിക്ഷേപിക്കുന്നു.
ഫണ്ടുകളുടെ ഫണ്ടുകളുടെ തരങ്ങൾ എന്തൊക്കെയാണ്?
1. അസറ്റ് അലോക്കേഷൻ ഫണ്ട്
ഈ ഫണ്ടുകളിൽ വൈവിധ്യമാർന്ന അസറ്റ് പൂൾ അടങ്ങിയിരിക്കുന്നു - ഇക്വിറ്റി, ഡെറ്റ് ഉപകരണങ്ങൾ, വിലയേറിയ ലോഹങ്ങൾ മുതലായവ അടങ്ങുന്ന സെക്യൂരിറ്റികൾ. ഇത് അനുവദിക്കുന്നുഅസറ്റ് അലോക്കേഷൻ പോർട്ട്ഫോളിയോയിലുള്ള താരതമ്യേന സ്ഥിരതയുള്ള സെക്യൂരിറ്റികൾ ഉറപ്പുനൽകുന്ന കുറഞ്ഞ റിസ്ക് ലെവലിൽ, മികച്ച പ്രകടനം കാഴ്ചവയ്ക്കുന്ന ഉപകരണത്തിലൂടെ ഉയർന്ന വരുമാനം സൃഷ്ടിക്കുന്നതിനുള്ള ഫണ്ടുകൾ.
2. ഗോൾഡ് ഫണ്ടുകൾ
വ്യത്യസ്ത മ്യൂച്വൽ ഫണ്ടുകളിൽ നിക്ഷേപിക്കുന്നത്, പ്രാഥമികമായി സ്വർണ്ണ സെക്യൂരിറ്റികളിലെ വ്യാപാരം സ്വർണ്ണ ഫണ്ടുകളാണ്. ഈ വിഭാഗത്തിൽ പെട്ട ഫണ്ടുകളുടെ ഫണ്ടിന് ബന്ധപ്പെട്ട അസറ്റ് മാനേജ്മെന്റ് കമ്പനിയെ ആശ്രയിച്ച് മ്യൂച്വൽ ഫണ്ടുകളുടെയോ സ്വർണ്ണ വ്യാപാര കമ്പനികളുടെയോ ഒരു പോർട്ട്ഫോളിയോ ഉണ്ടായിരിക്കാം.
3. ഫണ്ടുകളുടെ അന്താരാഷ്ട്ര ഫണ്ട്
വിദേശ രാജ്യങ്ങളിൽ പ്രവർത്തിക്കുന്ന മ്യൂച്വൽ ഫണ്ടുകൾ ലക്ഷ്യമിടുന്നുഅന്താരാഷ്ട്ര ഫണ്ട് ഫണ്ടുകളുടെ. അതാത് രാജ്യത്തെ മികച്ച പ്രകടനം കാഴ്ചവെക്കുന്ന സ്റ്റോക്കുകളും ബോണ്ടുകളും വഴി ഉയർന്ന വരുമാനം നൽകാൻ നിക്ഷേപകരെ ഇത് അനുവദിക്കുന്നു.
4. ഫണ്ടുകളുടെ മൾട്ടി മാനേജർ ഫണ്ട്
മ്യൂച്വൽ ഫണ്ടുകളിൽ ലഭ്യമായ ഫണ്ടുകളുടെ ഏറ്റവും സാധാരണമായ ഫണ്ടാണിത്വിപണി. അത്തരം ഒരു ഫണ്ടിന്റെ അസറ്റ് ബേസ് പ്രൊഫഷണലായി കൈകാര്യം ചെയ്യുന്ന വിവിധ മ്യൂച്വൽ ഫണ്ടുകൾ ഉൾക്കൊള്ളുന്നു, അവയ്ക്കെല്ലാം വ്യത്യസ്ത പോർട്ട്ഫോളിയോ കോൺസൺട്രേഷൻ ഉണ്ട്. ഫണ്ടുകളുടെ ഒരു മൾട്ടി-മാനേജർ ഫണ്ടിന് സാധാരണയായി ഒന്നിലധികം പോർട്ട്ഫോളിയോ മാനേജർമാരുണ്ട്, ഓരോരുത്തരും മ്യൂച്വൽ ഫണ്ടിൽ നിലവിലുള്ള ഒരു പ്രത്യേക അസറ്റുമായി ഇടപെടുന്നു.
Talk to our investment specialist
5. ഫണ്ടുകളുടെ ഇടിഎഫ് ഫണ്ട്
അടങ്ങുന്ന ഫണ്ടുകളുടെ ഫണ്ട്എക്സ്ചേഞ്ച് ട്രേഡഡ് ഫണ്ട് അവരുടെ പോർട്ട്ഫോളിയോ രാജ്യത്തെ ഒരു ജനപ്രിയ നിക്ഷേപ ഉപകരണമാണ്. ഫണ്ട് ഓഫ് ഫണ്ട് വഴി ഒരു ഇടിഎഫിൽ നിക്ഷേപിക്കുന്നത് ഈ ഉപകരണത്തിലെ നേരിട്ടുള്ള നിക്ഷേപത്തേക്കാൾ കൂടുതൽ ആക്സസ് ചെയ്യാവുന്നതാണ്. ഇടിഎഫുകൾക്ക് ഡീമാറ്റ് ആവശ്യമാണ് എന്നതിനാലാണിത്ട്രേഡിംഗ് അക്കൗണ്ട് ഫണ്ടുകളുടെ ഇടിഎഫ് ഫണ്ടിൽ നിക്ഷേപിക്കുമ്പോൾ അത്തരം പരിമിതികളൊന്നുമില്ല.
എന്നിരുന്നാലും, ഇടിഎഫുകൾക്ക് അൽപ്പം ഉയർന്ന അപകടസാധ്യതയുണ്ട്ഘടകം സ്റ്റോക്ക് മാർക്കറ്റിലെ ഷെയറുകൾ പോലെ ട്രേഡ് ചെയ്യപ്പെടുന്നതിനാൽ അവയുമായി ബന്ധപ്പെട്ടിരിക്കുന്നു, ഈ ഫണ്ടുകളുടെ ഫണ്ട് മാർക്കറ്റിന്റെ ചാഞ്ചാട്ടത്തിന് കൂടുതൽ വിധേയമാക്കുന്നു.
ഫണ്ട് ഓഫ് ഫണ്ടുകളിൽ ആരാണ് നിക്ഷേപിക്കേണ്ടത്?
കുറഞ്ഞ അപകടസാധ്യതയുള്ള വ്യത്യസ്ത പോർട്ട്ഫോളിയോയിൽ നിക്ഷേപിച്ച് വരുമാനം വർദ്ധിപ്പിക്കുക എന്നതാണ് ഫണ്ടുകളുടെ ടോപ്പ് ഫണ്ടിന്റെ പ്രധാന ലക്ഷ്യം. കൂടുതൽ കാലയളവിലേക്ക് മാറ്റിവെക്കാൻ കഴിയുന്ന ഒരു ചെറിയ സാമ്പത്തിക സ്രോതസ്സുകളിലേക്ക് പ്രവേശനമുള്ള വ്യക്തികൾക്ക് അത്തരമൊരു മ്യൂച്വൽ ഫണ്ട് തിരഞ്ഞെടുക്കാം. അത്തരം ഫണ്ടുകളുടെ പോർട്ട്ഫോളിയോ വ്യത്യസ്തമായതിനാൽമ്യൂച്വൽ ഫണ്ടുകളുടെ തരങ്ങൾ, ഇത് ഉയർന്നതിലേക്കുള്ള പ്രവേശനം ഉറപ്പാക്കുന്നു-മൂല്യ ഫണ്ടുകൾ അതുപോലെ.
എബൌട്ട്, താരതമ്യേന കുറഞ്ഞ വിഭവങ്ങളുള്ള നിക്ഷേപകർദ്രവ്യത വിപണിയിൽ ലഭ്യമായ ഫണ്ടുകളുടെ മുൻനിര ഫണ്ടിൽ നിക്ഷേപിക്കാൻ ആവശ്യങ്ങൾ തിരഞ്ഞെടുക്കാം. കുറഞ്ഞ റിസ്കിൽ പരമാവധി വരുമാനം നേടാൻ ഇത് അവരെ പ്രാപ്തരാക്കുന്നു.
ഫണ്ട് ഓഫ് ഫണ്ടുകളിൽ നിക്ഷേപിക്കുന്നതിന്റെ പ്രയോജനങ്ങൾ
പലതരമുണ്ട്നിക്ഷേപത്തിന്റെ നേട്ടങ്ങൾ ഫണ്ടുകളുടെ ഒരു ഫണ്ടിൽ മ്യൂച്വൽ ഫണ്ട് -
1. വൈവിധ്യവൽക്കരണം
ഫണ്ടുകളുടെ ഫണ്ട് വിവിധ ലക്ഷ്യങ്ങൾമികച്ച പ്രകടനം നടത്തുന്ന മ്യൂച്വൽ ഫണ്ടുകൾ വിപണിയിൽ, ഓരോന്നും ഒരു പ്രത്യേക അസറ്റിലോ ഫണ്ടിന്റെ മേഖലയിലോ സ്പെഷ്യലൈസ് ചെയ്യുന്നു. ഇത് വൈവിധ്യവൽക്കരണത്തിലൂടെയുള്ള നേട്ടങ്ങൾ ഉറപ്പാക്കുന്നു, കാരണം അടിസ്ഥാന പോർട്ട്ഫോളിയോ വൈവിധ്യം കാരണം റിട്ടേണുകളും റിസ്കുകളും ഒപ്റ്റിമൈസ് ചെയ്യപ്പെടുന്നു.
2. പ്രൊഫഷണൽ പരിശീലനം ലഭിച്ച മാനേജർമാർ
വർഷങ്ങളുടെ അനുഭവപരിചയമുള്ള ഉയർന്ന പരിശീലനം ലഭിച്ച ആളുകളാണ് ഫണ്ടുകളുടെ ഫണ്ട് കൈകാര്യം ചെയ്യുന്നത്. അത്തരം പോർട്ട്ഫോളിയോ മാനേജർമാർ നടത്തിയ ശരിയായ വിശകലനവും കണക്കുകൂട്ടിയ വിപണി പ്രവചനങ്ങളും സങ്കീർണ്ണമായ നിക്ഷേപ തന്ത്രങ്ങളിലൂടെ ഉയർന്ന ആദായം ഉറപ്പാക്കുന്നു.
3. കുറഞ്ഞ വിഭവ ആവശ്യകതകൾ
പരിമിതമായ സാമ്പത്തിക സ്രോതസ്സുകളുള്ള ഒരു വ്യക്തിക്ക് ഉയർന്ന ലാഭം നേടുന്നതിന് ലഭ്യമായ ഫണ്ടുകളുടെ ടോപ്പ് ഫണ്ടിൽ എളുപ്പത്തിൽ നിക്ഷേപിക്കാൻ കഴിയും. നിക്ഷേപിക്കാൻ ഫണ്ടുകളുടെ ഒരു ഫണ്ട് തിരഞ്ഞെടുക്കുമ്പോൾ പ്രതിമാസ നിക്ഷേപ പദ്ധതികളും പ്രയോജനപ്പെടുത്താം.
ഫണ്ട് ഓഫ് ഫണ്ടുകളുടെ പരിമിതികൾ
1. ചെലവ് അനുപാതം
ഫണ്ടുകളുടെ ഒരു ഫണ്ട് മാനേജ് ചെയ്യുന്നതിനുള്ള ചെലവ് അനുപാതം മ്യൂച്വൽ ഫണ്ടുകൾ സ്റ്റാൻഡേർഡ് മ്യൂച്വൽ ഫണ്ടുകളേക്കാൾ ഉയർന്നതാണ്, കാരണം അതിന് ഉയർന്ന മാനേജിംഗ് ചെലവ് ഉണ്ട്. അധികച്ചെലവുകളിൽ പ്രാഥമികമായി നിക്ഷേപിക്കാനുള്ള ശരിയായ അസറ്റ് തിരഞ്ഞെടുക്കുന്നത് ഉൾപ്പെടുന്നു, അത് ഇടയ്ക്കിടെ ചാഞ്ചാട്ടം തുടരുന്നു.
2. നികുതി
ഫണ്ടുകളുടെ ഒരു ഫണ്ടിന്മേൽ ചുമത്തുന്ന നികുതി ഒരു നിക്ഷേപകൻ അടയ്ക്കേണ്ടതാണ്, ഈ കാലയളവിൽ മാത്രംമോചനം പ്രധാന തുകയുടെ. എന്നിരുന്നാലും, വീണ്ടെടുക്കൽ സമയത്ത്, ഹ്രസ്വകാലവും ദീർഘകാലവുംമൂലധനം വാർഷികത്തെ ആശ്രയിച്ച് നേട്ടങ്ങൾ നികുതി കിഴിവുകൾക്ക് വിധേയമാണ്വരുമാനം നിക്ഷേപകന്റെയും നിക്ഷേപത്തിന്റെ കാലാവധിയും.
2022-ൽ നിക്ഷേപിക്കാൻ ഏറ്റവും മികച്ച ഫണ്ട് ഫണ്ട്
Fund NAV Net Assets (Cr) 3 MO (%) 6 MO (%) 1 YR (%) 3 YR (%) 5 YR (%) 2024 (%) IDBI Nifty Index Fund Growth ₹36.2111
↓ -0.02 ₹208 9.1 11.9 16.2 20.3 11.7 ICICI Prudential Advisor Series - Passive Strategy Fund Growth ₹156.135
↑ 2.42 ₹168 3.9 -2.5 12.3 16.9 24.9 15.9 ICICI Prudential Advisor Series - Hybrid Fund Growth ₹61.5424
↑ 0.05 ₹263 2 2.3 11.6 11.2 12.7 12.3 Aditya Birla Sun Life Financial Planning FOF Aggressive Plan Growth ₹50.5648
↑ 0.46 ₹196 1.6 -4 10.7 13.8 19.2 16.9 ICICI Prudential Advisor Series - Conservative Fund Growth ₹115.254
↑ 0.76 ₹23,317 2.6 1.2 10 13 17.3 13.5 ICICI Prudential Advisor Series - Debt Management Fund Growth ₹44.4745
↑ 0.04 ₹112 3.3 4.9 9.7 7.8 7.1 8.1 Kotak Asset Allocator Fund - FOF Growth ₹219.26
↑ 1.50 ₹1,567 0.5 -2.3 9.5 16.9 22.1 19 Note: Returns up to 1 year are on absolute basis & more than 1 year are on CAGR basis. as on 28 Jul 23 ആസ്തി >= 50 കോടി &അടിസ്ഥാനമാക്കി അടുക്കി1 വർഷത്തെ റിട്ടേൺ.
The investment objective of the scheme is to invest in the stocks and equity related instruments comprising the S&P CNX Nifty Index in the same weights as these stocks represented in the Index with the intent to replicate the performance of the Total Returns Index of S&P CNX Nifty index. The scheme will adopt a passive investment strategy and will seek to achieve the investment objective by minimizing the tracking error between the S&P CNX Nifty index (Total Returns Index) and the scheme. IDBI Nifty Index Fund is a Others - Index Fund fund was launched on 25 Jun 10. It is a fund with Moderately High risk and has given a Below is the key information for IDBI Nifty Index Fund Returns up to 1 year are on (Erstwhile ICICI Prudential Advisor Series - Long Term Savings Plan) The primary investment objective of this Plan is to seek to generate long term capital appreciation from a portfolio that is invested predominantly in the schemes of domestic or offshore Mutual Fund(s) mainly having asset allocation to: • Equity and equity related securities and • A small portion in debt and money market instruments. However, there can be no assurance that the investment objective of the Scheme will be realized. ICICI Prudential Advisor Series - Passive Strategy Fund is a Others - Fund of Fund fund was launched on 18 Dec 03. It is a fund with Moderately High risk and has given a Below is the key information for ICICI Prudential Advisor Series - Passive Strategy Fund Returns up to 1 year are on (Erstwhile ICICI Prudential Advisor Series - Cautious Plan) The primary investment objective of this Plan is to seek to generate regular income primarily through investments in the schemes of domestic or offshore Mutual Fund(s) having asset allocation: • Primarily to fixed income securities • To a lesser extent (maximum 35%) in equity and equity related securities so as to generate long-term capital appreciation. However, there can be no assurance that the investment objectives of the Plan/s will be realized. ICICI Prudential Advisor Series - Hybrid Fund is a Others - Fund of Fund fund was launched on 18 Dec 03. It is a fund with Moderately High risk and has given a Below is the key information for ICICI Prudential Advisor Series - Hybrid Fund Returns up to 1 year are on The Scheme aims to generate returns by investing in mutual fund schemes selected in accordance with the BSLAMC process, as per the risk-return profile of investors. Each of the 3 plans under the Scheme has a strategic asset allocation which is based on satisfying the needs to a specific risk-return profile of investors. There can be no assurance that the investment objective of the Scheme will be realized. Aditya Birla Sun Life Financial Planning FOF Aggressive Plan is a Others - Fund of Fund fund was launched on 9 May 11. It is a fund with Moderately High risk and has given a Below is the key information for Aditya Birla Sun Life Financial Planning FOF Aggressive Plan Returns up to 1 year are on (Erstwhile ICICI Prudential Advisor Series - Moderate Plan) The primary investment objective of this Plan is to seek to generate long term capital appreciation and current income by creating a portfolio that is invested in the schemes of domestic or offshore Mutual Fund(s) mainly having asset allocation to: • Equity and equity related securities as well as • Fixed income securities. However, there can be no assurance that the investment objectives of the Plan/s will be realized. ICICI Prudential Advisor Series - Conservative Fund is a Others - Fund of Fund fund was launched on 18 Dec 03. It is a fund with Moderately High risk and has given a Below is the key information for ICICI Prudential Advisor Series - Conservative Fund Returns up to 1 year are on (Erstwhile ICICI Prudential Advisor Series - Dynamic Accrual Plan) The primary investment objective of this Plan is to seek to provide reasonable returns, commensurate with low risk while providing a high level of liquidity, through investments made primarily in the schemes of domestic or offshore Mutual Fund(s) having asset allocation to: • Money market and debt securities. This Plan may be considered to be ideal for investors having a low risk appetite and a shorter duration of investment. However, there can be no assurance that the investment objectives of the Plan/s will be realized. ICICI Prudential Advisor Series - Debt Management Fund is a Others - Fund of Fund fund was launched on 18 Dec 03. It is a fund with Moderate risk and has given a Below is the key information for ICICI Prudential Advisor Series - Debt Management Fund Returns up to 1 year are on The investment objective of the scheme is to generate long-term capital appreciation from a portfolio created by investing in
specified open-ended equity, and debt schemes of Kotak Mahindra Mutual Fund. However, there is no assurance that the investment objective of the Scheme will be realized Kotak Asset Allocator Fund - FOF is a Others - Fund of Fund fund was launched on 9 Aug 04. It is a fund with Moderately High risk and has given a Below is the key information for Kotak Asset Allocator Fund - FOF Returns up to 1 year are on 1. IDBI Nifty Index Fund
CAGR/Annualized return of 10.3% since its launch. Ranked 83 in Index Fund category. . IDBI Nifty Index Fund
Growth Launch Date 25 Jun 10 NAV (28 Jul 23) ₹36.2111 ↓ -0.02 (-0.06 %) Net Assets (Cr) ₹208 on 30 Jun 23 Category Others - Index Fund AMC IDBI Asset Management Limited Rating ☆ Risk Moderately High Expense Ratio 0.9 Sharpe Ratio 1.04 Information Ratio -3.93 Alpha Ratio -1.03 Min Investment 5,000 Min SIP Investment 500 Exit Load NIL Growth of 10,000 investment over the years.
Date Value 31 Mar 20 ₹10,000 31 Mar 21 ₹17,049 31 Mar 22 ₹20,178 31 Mar 23 ₹20,108 Returns for IDBI Nifty Index Fund
absolute basis & more than 1 year are on CAGR (Compound Annual Growth Rate) basis. as on 28 Jul 23 Duration Returns 1 Month 3.7% 3 Month 9.1% 6 Month 11.9% 1 Year 16.2% 3 Year 20.3% 5 Year 11.7% 10 Year 15 Year Since launch 10.3% Historical performance (Yearly) on absolute basis
Year Returns 2024 2023 2022 2021 2020 2019 2018 2017 2016 2015 Fund Manager information for IDBI Nifty Index Fund
Name Since Tenure Data below for IDBI Nifty Index Fund as on 30 Jun 23
Asset Allocation
Asset Class Value Top Securities Holdings / Portfolio
Name Holding Value Quantity 2. ICICI Prudential Advisor Series - Passive Strategy Fund
CAGR/Annualized return of 13.8% since its launch. Return for 2024 was 15.9% , 2023 was 29.3% and 2022 was 4.2% . ICICI Prudential Advisor Series - Passive Strategy Fund
Growth Launch Date 18 Dec 03 NAV (17 Apr 25) ₹156.135 ↑ 2.42 (1.58 %) Net Assets (Cr) ₹168 on 28 Feb 25 Category Others - Fund of Fund AMC ICICI Prudential Asset Management Company Limited Rating Risk Moderately High Expense Ratio 0.35 Sharpe Ratio -0.21 Information Ratio 0.7 Alpha Ratio 1.82 Min Investment 5,000 Min SIP Investment 1,000 Exit Load 0-3 Years (1%),3 Years and above(NIL) Growth of 10,000 investment over the years.
Date Value 31 Mar 20 ₹10,000 31 Mar 21 ₹16,722 31 Mar 22 ₹19,475 31 Mar 23 ₹20,515 31 Mar 24 ₹28,252 31 Mar 25 ₹30,879 Returns for ICICI Prudential Advisor Series - Passive Strategy Fund
absolute basis & more than 1 year are on CAGR (Compound Annual Growth Rate) basis. as on 28 Jul 23 Duration Returns 1 Month 7.8% 3 Month 3.9% 6 Month -2.5% 1 Year 12.3% 3 Year 16.9% 5 Year 24.9% 10 Year 15 Year Since launch 13.8% Historical performance (Yearly) on absolute basis
Year Returns 2024 15.9% 2023 29.3% 2022 4.2% 2021 30.3% 2020 10.7% 2019 6.7% 2018 4% 2017 19.2% 2016 11.2% 2015 1.2% Fund Manager information for ICICI Prudential Advisor Series - Passive Strategy Fund
Name Since Tenure Sankaran Naren 5 Sep 18 6.57 Yr. Dharmesh Kakkad 28 May 18 6.85 Yr. Sharmila D’mello 13 May 24 0.88 Yr. Masoomi Jhurmarvala 4 Nov 24 0.4 Yr. Data below for ICICI Prudential Advisor Series - Passive Strategy Fund as on 28 Feb 25
Asset Allocation
Asset Class Value Cash 2.28% Equity 97.72% Top Securities Holdings / Portfolio
Name Holding Value Quantity ICICI Pru Nifty Private Banks ETF
- | -21% ₹35 Cr 14,540,963
↑ 347,000 ICICI Pru Nifty Bank ETF
- | -17% ₹29 Cr 5,929,440 ICICI Pru Nifty FMCG ETF
- | -10% ₹17 Cr 3,156,300 ICICI Pru Nifty India Consumption ETF
- | -9% ₹15 Cr 1,450,930 ICICI Pru Nifty Healthcare ETF
- | -9% ₹15 Cr 1,136,801 ICICI Prudential Nifty Oil & Gas ETF
- | -8% ₹13 Cr 13,306,960
↑ 430,000 ICICI Pru Nifty IT ETF
- | -7% ₹11 Cr 2,831,290
↑ 197,000 CPSE ETF
- | -5% ₹9 Cr 1,198,200
↑ 440,000 ICICI Prudential Nifty Infra ETF
- | -5% ₹8 Cr 1,068,642 ICICI Prudential Nifty Commodities ETF
- | -4% ₹6 Cr 820,000 3. ICICI Prudential Advisor Series - Hybrid Fund
CAGR/Annualized return of 8.9% since its launch. Return for 2024 was 12.3% , 2023 was 14.4% and 2022 was 6.7% . ICICI Prudential Advisor Series - Hybrid Fund
Growth Launch Date 18 Dec 03 NAV (17 Apr 25) ₹61.5424 ↑ 0.05 (0.09 %) Net Assets (Cr) ₹263 on 28 Feb 25 Category Others - Fund of Fund AMC ICICI Prudential Asset Management Company Limited Rating ☆☆☆ Risk Moderately High Expense Ratio 1.06 Sharpe Ratio 0.77 Information Ratio 0 Alpha Ratio 0 Min Investment 5,000 Min SIP Investment 1,000 Exit Load 0-1 Months (0.25%),1 Months and above(NIL) Growth of 10,000 investment over the years.
Date Value 31 Mar 20 ₹10,000 31 Mar 21 ₹12,326 31 Mar 22 ₹13,495 31 Mar 23 ₹14,384 31 Mar 24 ₹16,692 31 Mar 25 ₹18,551 Returns for ICICI Prudential Advisor Series - Hybrid Fund
absolute basis & more than 1 year are on CAGR (Compound Annual Growth Rate) basis. as on 28 Jul 23 Duration Returns 1 Month 1.8% 3 Month 2% 6 Month 2.3% 1 Year 11.6% 3 Year 11.2% 5 Year 12.7% 10 Year 15 Year Since launch 8.9% Historical performance (Yearly) on absolute basis
Year Returns 2024 12.3% 2023 14.4% 2022 6.7% 2021 10.8% 2020 9.2% 2019 8.6% 2018 6.4% 2017 5.8% 2016 9.6% 2015 3% Fund Manager information for ICICI Prudential Advisor Series - Hybrid Fund
Name Since Tenure Manish Banthia 16 Jun 17 7.8 Yr. Ritesh Lunawat 29 Dec 20 4.26 Yr. Dharmesh Kakkad 28 May 18 6.85 Yr. Sharmila D’mello 13 May 24 0.88 Yr. Masoomi Jhurmarvala 4 Nov 24 0.4 Yr. Data below for ICICI Prudential Advisor Series - Hybrid Fund as on 28 Feb 25
Asset Allocation
Asset Class Value Cash 23.56% Equity 16.58% Debt 59.69% Other 0.16% Top Securities Holdings / Portfolio
Name Holding Value Quantity ICICI Pru Short Term Dir Gr
Investment Fund | -58% ₹154 Cr 24,284,437 ICICI Pru Equity Savings Dir Gr
Investment Fund | -29% ₹76 Cr 33,123,018
↓ -1,130,938 ICICI Prudential Eq Min Var Dir Gr
Investment Fund | -6% ₹17 Cr 18,161,560
↑ 2,933,895 ICICI Pru Exports and Services Dir Gr
Investment Fund | -5% ₹14 Cr 913,829
↑ 78,309 Net Current Assets
Net Current Assets | -1% ₹2 Cr Treps
CBLO/Reverse Repo | -0% ₹0 Cr 4. Aditya Birla Sun Life Financial Planning FOF Aggressive Plan
CAGR/Annualized return of 12.3% since its launch. Ranked 54 in Fund of Fund category. Return for 2024 was 16.9% , 2023 was 24.5% and 2022 was 3.6% . Aditya Birla Sun Life Financial Planning FOF Aggressive Plan
Growth Launch Date 9 May 11 NAV (17 Apr 25) ₹50.5648 ↑ 0.46 (0.91 %) Net Assets (Cr) ₹196 on 28 Feb 25 Category Others - Fund of Fund AMC Birla Sun Life Asset Management Co Ltd Rating ☆☆ Risk Moderately High Expense Ratio 1.05 Sharpe Ratio -0.2 Information Ratio 0.68 Alpha Ratio 1.47 Min Investment 1,000 Min SIP Investment 100 Exit Load 0-365 Days (1%),365 Days and above(NIL) Growth of 10,000 investment over the years.
Date Value 31 Mar 20 ₹10,000 31 Mar 21 ₹14,735 31 Mar 22 ₹17,075 31 Mar 23 ₹17,427 31 Mar 24 ₹22,822 31 Mar 25 ₹25,071 Returns for Aditya Birla Sun Life Financial Planning FOF Aggressive Plan
absolute basis & more than 1 year are on CAGR (Compound Annual Growth Rate) basis. as on 28 Jul 23 Duration Returns 1 Month 6.5% 3 Month 1.6% 6 Month -4% 1 Year 10.7% 3 Year 13.8% 5 Year 19.2% 10 Year 15 Year Since launch 12.3% Historical performance (Yearly) on absolute basis
Year Returns 2024 16.9% 2023 24.5% 2022 3.6% 2021 21.1% 2020 19.2% 2019 6.9% 2018 -2.6% 2017 26.5% 2016 7.5% 2015 4.4% Fund Manager information for Aditya Birla Sun Life Financial Planning FOF Aggressive Plan
Name Since Tenure Vinod Bhat 16 Aug 19 5.63 Yr. Dhaval Joshi 21 Nov 22 2.36 Yr. Data below for Aditya Birla Sun Life Financial Planning FOF Aggressive Plan as on 28 Feb 25
Asset Allocation
Asset Class Value Cash 3.28% Equity 71.09% Debt 15.9% Other 9.74% Top Securities Holdings / Portfolio
Name Holding Value Quantity ICICI Pru Bluechip Dir Gr
Investment Fund | -15% ₹29 Cr 2,752,217 Aditya BSL Flexi Cap Dir Gr
Investment Fund | -15% ₹29 Cr 168,282 Nippon India Growth Dir Gr
Investment Fund | -15% ₹29 Cr 76,688 HDFC Large and Mid Cap Dir Gr
Investment Fund | -14% ₹28 Cr 922,521 Kotak Multicap Dir Gr
Investment Fund | -14% ₹27 Cr 16,294,420 Aditya BSL Gold ETF
- | -10% ₹19 Cr 2,566,942 HDFC Corporate Bond Dir Gr
Investment Fund | -10% ₹19 Cr 5,903,025 Aditya BSL Gov Sec Dir Gr
Investment Fund | -6% ₹11 Cr 1,324,230 Aditya BSL Short Term Dir Gr
Investment Fund | -1% ₹2 Cr 411,264 Aditya BSL Nifty Next 50 Idx Dir Gr
Investment Fund | -1% ₹2 Cr 1,284,672 5. ICICI Prudential Advisor Series - Conservative Fund
CAGR/Annualized return of 12.1% since its launch. Return for 2024 was 13.5% , 2023 was 18.2% and 2022 was 8.2% . ICICI Prudential Advisor Series - Conservative Fund
Growth Launch Date 18 Dec 03 NAV (17 Apr 25) ₹115.254 ↑ 0.76 (0.66 %) Net Assets (Cr) ₹23,317 on 28 Feb 25 Category Others - Fund of Fund AMC ICICI Prudential Asset Management Company Limited Rating ☆☆ Risk Moderately High Expense Ratio 1.35 Sharpe Ratio 0.01 Information Ratio 0 Alpha Ratio 0 Min Investment 5,000 Min SIP Investment 1,000 Exit Load 0-1 Years (1%),1 Years and above(NIL) Growth of 10,000 investment over the years.
Date Value 31 Mar 20 ₹10,000 31 Mar 21 ₹14,584 31 Mar 22 ₹16,622 31 Mar 23 ₹17,888 31 Mar 24 ₹21,806 31 Mar 25 ₹23,881 Returns for ICICI Prudential Advisor Series - Conservative Fund
absolute basis & more than 1 year are on CAGR (Compound Annual Growth Rate) basis. as on 28 Jul 23 Duration Returns 1 Month 4.4% 3 Month 2.6% 6 Month 1.2% 1 Year 10% 3 Year 13% 5 Year 17.3% 10 Year 15 Year Since launch 12.1% Historical performance (Yearly) on absolute basis
Year Returns 2024 13.5% 2023 18.2% 2022 8.2% 2021 16.6% 2020 13.4% 2019 9.7% 2018 8.6% 2017 15.3% 2016 12.8% 2015 2.3% Fund Manager information for ICICI Prudential Advisor Series - Conservative Fund
Name Since Tenure Sankaran Naren 5 Sep 18 6.49 Yr. Manish Banthia 16 Jun 17 7.71 Yr. Ritesh Lunawat 12 Jun 23 1.72 Yr. Dharmesh Kakkad 28 May 18 6.76 Yr. Data below for ICICI Prudential Advisor Series - Conservative Fund as on 28 Feb 25
Asset Allocation
Asset Class Value Cash 11.1% Equity 50.13% Debt 35.36% Other 3.41% Top Securities Holdings / Portfolio
Name Holding Value Quantity ICICI Pru All Seasons Bond Dir Gr
Investment Fund | -12% ₹2,901 Cr 754,316,852 ICICI Pru Banking & Fin Svcs Dir Gr
Investment Fund | -8% ₹1,964 Cr 151,219,737 ICICI Pru Short Term Dir Gr
Investment Fund | -7% ₹1,659 Cr 262,025,065 ICICI Prudential Energy Opps Dir Gr
Investment Fund | -7% ₹1,543 Cr 1,815,385,602
↑ 803,898,073 ICICI Pru Infrastructure Dir Gr
Investment Fund | -6% ₹1,496 Cr 84,556,992
↑ 2,763,056 ICICI Pru Technology Dir Gr
Investment Fund | -5% ₹1,264 Cr 61,116,206
↑ 5,202,150 ICICI Pru Focused Equity Dir Gr
Investment Fund | -5% ₹1,109 Cr 126,175,849 ICICI Pru Innovt Dir Gr
Investment Fund | -5% ₹1,066 Cr 667,022,314 ICICI Pru Banking & PSU Debt Dir Gr
Investment Fund | -4% ₹1,015 Cr 307,857,485 ICICI Pru Savings Dir Gr
Investment Fund | -4% ₹919 Cr 17,183,792
↓ -10,268,883 6. ICICI Prudential Advisor Series - Debt Management Fund
CAGR/Annualized return of 7.2% since its launch. Ranked 8 in Fund of Fund category. Return for 2024 was 8.1% , 2023 was 7.5% and 2022 was 4% . ICICI Prudential Advisor Series - Debt Management Fund
Growth Launch Date 18 Dec 03 NAV (17 Apr 25) ₹44.4745 ↑ 0.04 (0.08 %) Net Assets (Cr) ₹112 on 28 Feb 25 Category Others - Fund of Fund AMC ICICI Prudential Asset Management Company Limited Rating ☆☆☆☆ Risk Moderate Expense Ratio 0.67 Sharpe Ratio 1.34 Information Ratio 0 Alpha Ratio 0 Min Investment 5,000 Min SIP Investment 100 Exit Load 0-6 Months (0.5%),6 Months and above(NIL) Growth of 10,000 investment over the years.
Date Value 31 Mar 20 ₹10,000 31 Mar 21 ₹10,863 31 Mar 22 ₹11,250 31 Mar 23 ₹11,888 31 Mar 24 ₹12,820 31 Mar 25 ₹13,909 Returns for ICICI Prudential Advisor Series - Debt Management Fund
absolute basis & more than 1 year are on CAGR (Compound Annual Growth Rate) basis. as on 28 Jul 23 Duration Returns 1 Month 1.9% 3 Month 3.3% 6 Month 4.9% 1 Year 9.7% 3 Year 7.8% 5 Year 7.1% 10 Year 15 Year Since launch 7.2% Historical performance (Yearly) on absolute basis
Year Returns 2024 8.1% 2023 7.5% 2022 4% 2021 4.2% 2020 9.7% 2019 8.7% 2018 6.2% 2017 6.5% 2016 11.2% 2015 11.1% Fund Manager information for ICICI Prudential Advisor Series - Debt Management Fund
Name Since Tenure Manish Banthia 16 Jun 17 7.79 Yr. Ritesh Lunawat 29 Dec 20 4.26 Yr. Data below for ICICI Prudential Advisor Series - Debt Management Fund as on 28 Feb 25
Asset Allocation
Asset Class Value Cash 5.96% Equity 0.14% Debt 93.64% Other 0.26% Top Securities Holdings / Portfolio
Name Holding Value Quantity ICICI Pru All Seasons Bond Dir Gr
Investment Fund | -40% ₹44 Cr 11,489,378 ICICI Pru Short Term Dir Gr
Investment Fund | -33% ₹37 Cr 5,832,596 ICICI Pru Medium Term Bond Dir Gr
Investment Fund | -13% ₹14 Cr 3,054,781 ICICI Pru Floating Interest Dir Gr
Investment Fund | -6% ₹6 Cr 139,373 ICICI Pru Const Mat Gilt Dir Gr
Investment Fund | -5% ₹6 Cr 2,428,656 HDFC Nifty G- Sec Jun 2027 Index Dir Gr
Investment Fund | -2% ₹2 Cr 1,759,375 HDFC Ultra S/T Fund Dir Gr
Investment Fund | -1% ₹1 Cr 524,400 Treps
CBLO/Reverse Repo | -1% ₹1 Cr Net Current Assets
Net Current Assets | -0% ₹0 Cr 7. Kotak Asset Allocator Fund - FOF
CAGR/Annualized return of 16.1% since its launch. Ranked 17 in Fund of Fund category. Return for 2024 was 19% , 2023 was 23.4% and 2022 was 11.3% . Kotak Asset Allocator Fund - FOF
Growth Launch Date 9 Aug 04 NAV (17 Apr 25) ₹219.26 ↑ 1.50 (0.69 %) Net Assets (Cr) ₹1,567 on 28 Feb 25 Category Others - Fund of Fund AMC Kotak Mahindra Asset Management Co Ltd Rating ☆☆☆☆ Risk Moderately High Expense Ratio 0.94 Sharpe Ratio 0.05 Information Ratio 0 Alpha Ratio 0 Min Investment 5,000 Min SIP Investment 1,000 Exit Load 0-1 Years (1%),1 Years and above(NIL) Growth of 10,000 investment over the years.
Date Value 31 Mar 20 ₹10,000 31 Mar 21 ₹15,338 31 Mar 22 ₹18,185 31 Mar 23 ₹20,109 31 Mar 24 ₹26,424 31 Mar 25 ₹28,891 Returns for Kotak Asset Allocator Fund - FOF
absolute basis & more than 1 year are on CAGR (Compound Annual Growth Rate) basis. as on 28 Jul 23 Duration Returns 1 Month 5% 3 Month 0.5% 6 Month -2.3% 1 Year 9.5% 3 Year 16.9% 5 Year 22.1% 10 Year 15 Year Since launch 16.1% Historical performance (Yearly) on absolute basis
Year Returns 2024 19% 2023 23.4% 2022 11.3% 2021 25% 2020 25% 2019 10.3% 2018 4.4% 2017 13.7% 2016 8.8% 2015 5.4% Fund Manager information for Kotak Asset Allocator Fund - FOF
Name Since Tenure Abhishek Bisen 15 Nov 21 3.29 Yr. Devender Singhal 9 May 19 5.82 Yr. Data below for Kotak Asset Allocator Fund - FOF as on 28 Feb 25
Asset Allocation
Asset Class Value Cash 2.7% Equity 60.07% Debt 23.14% Other 14.09% Top Securities Holdings / Portfolio
Name Holding Value Quantity Kotak Gold ETF
- | -14% ₹225 Cr 31,420,000
↓ -4,565,000 Kotak Gilt-Investment Growth - Direct
Investment Fund | -13% ₹203 Cr 19,261,359 Kotak Consumption Dir Gr
Investment Fund | -11% ₹177 Cr 146,659,548 Kotak Bond Dir Gr
Investment Fund | -11% ₹177 Cr 21,279,938 Kotak Nifty PSU Bank ETF
- | -8% ₹124 Cr 2,190,000 Kotak Infra & Econ Reform Dir Gr
Investment Fund | -7% ₹113 Cr 18,399,092 iShares NASDAQ 100 ETF USD Acc
- | -7% ₹106 Cr 10,300 Kotak Quant Dir Gr
Investment Fund | -6% ₹92 Cr 70,592,506 Kotak India EQ Contra Dir Gr
Investment Fund | -4% ₹67 Cr 4,460,689 Kotak Manufacture in India Dir Gr
Investment Fund | -4% ₹66 Cr 41,081,682
ഫണ്ട് ഓഫ് ഫണ്ടുകളുടെ പ്രയോജനങ്ങൾ
എല്ലാ മ്യൂച്വൽ ഫണ്ടുകളെയും പോലെ, ഫണ്ടുകളുടെ ഫണ്ടുകൾക്കും നിരവധി ഗുണങ്ങളുണ്ട്. അവയിൽ ചിലത്:
1. പോർട്ട്ഫോളിയോ വൈവിധ്യവൽക്കരണവും ഫണ്ട് അലോക്കേഷനും
പ്രധാന നേട്ടങ്ങളിലൊന്ന് പോർട്ട്ഫോളിയോ വൈവിധ്യവൽക്കരണമാണ്. ഇവിടെ, ഒരൊറ്റ ഫണ്ടിൽ നിക്ഷേപിച്ചിട്ടുണ്ടെങ്കിലും, നിരവധി മ്യൂച്വൽ ഫണ്ട് സ്കീമുകളിൽ നിക്ഷേപം നടത്തുന്നു, ഒരു നിശ്ചിത തലത്തിലുള്ള റിസ്കിൽ പരമാവധി വരുമാനം നേടുക എന്ന ലക്ഷ്യത്തോടെ ഫണ്ട് ഒപ്റ്റിമൽ രീതിയിൽ വകയിരുത്തുന്നു.
2. വൈവിധ്യമാർന്ന അസറ്റുകൾക്കുള്ള ഗേറ്റ്വേ
നിക്ഷേപങ്ങൾക്ക് എളുപ്പത്തിൽ ലഭ്യമല്ലാത്ത ഫണ്ടുകളിലേക്ക് പ്രവേശനം നേടാൻ മൾട്ടി-മാനേജ്മെന്റ് നിക്ഷേപം റീട്ടെയിൽ നിക്ഷേപകരെ സഹായിക്കുന്നു. ഒരൊറ്റ ഫണ്ട് ഫണ്ടിന് എക്സ്പോഷർ എടുക്കാംഇക്വിറ്റി ഫണ്ടുകൾ,ഡെറ്റ് ഫണ്ട് അല്ലെങ്കിൽ ചരക്ക് അടിസ്ഥാനമാക്കിയുള്ള മ്യൂച്വൽ ഫണ്ടുകൾ പോലും. ഇത് ഒരു മ്യൂച്വൽ ഫണ്ടിൽ പ്രവേശിച്ച് റീട്ടെയിൽ നിക്ഷേപകന് വൈവിധ്യവൽക്കരണം ഉറപ്പാക്കുന്നു.
3. ഡ്യൂ ഡിലിജൻസ് പ്രോസസ്
ഈ വിഭാഗത്തിന് കീഴിലുള്ള എല്ലാ ഫണ്ടുകളും ഫണ്ട് മാനേജർ നടത്തുന്ന ഒരു ജാഗ്രതാ പ്രക്രിയ പിന്തുടരുമെന്ന് പ്രതീക്ഷിക്കുന്നു, അവിടെ നിക്ഷേപം നടത്തുന്നതിന് മുമ്പ് അടിസ്ഥാന ഫണ്ട് മാനേജർമാരുടെ പശ്ചാത്തലവും യോഗ്യതാപത്രങ്ങളും പരിശോധിച്ച് തന്ത്രം പ്രതീക്ഷകൾക്ക് അനുസൃതമാണെന്ന് ഉറപ്പാക്കേണ്ടതുണ്ട്.
4. കുറഞ്ഞ നിക്ഷേപ തുക
കുറഞ്ഞ ടിക്കറ്റ് വലുപ്പമുള്ള ഈ നിക്ഷേപ വഴിയിലേക്ക് കടക്കാൻ ആഗ്രഹിക്കുന്ന റീട്ടെയിൽ നിക്ഷേപകർക്ക് ഇതൊരു നല്ല ഓപ്ഷനാണ്.
ഒരു ഫണ്ട് ഫണ്ട് എങ്ങനെയാണ് പ്രവർത്തിക്കുന്നത്?
മൾട്ടി-മാനേജർ നിക്ഷേപം എങ്ങനെ പ്രവർത്തിക്കുന്നു എന്നതിന്റെ രീതികൾ മനസ്സിലാക്കുന്നതിന്, വിലങ്ങുതടിയായതും അനിയന്ത്രിതവുമായ മാനേജ്മെന്റിന്റെ ആശയങ്ങൾ മനസ്സിലാക്കേണ്ടത് പ്രധാനമാണ്. മ്യൂച്വൽ ഫണ്ട് അതിന്റെ പണം സ്വന്തം കമ്പനി കൈകാര്യം ചെയ്യുന്ന ആസ്തികളും ഫണ്ടുകളും അടങ്ങുന്ന ഒരു പോർട്ട്ഫോളിയോയിൽ നിക്ഷേപിക്കുന്ന സാഹചര്യമാണ് ഫെറ്റർഡ് മാനേജ്മെന്റ്. മറ്റൊരു വിധത്തിൽ പറഞ്ഞാൽ, അതേ അസറ്റ് മാനേജ്മെന്റ് കമ്പനിയുടെ ഫണ്ടുകളിൽ പണം നിക്ഷേപിക്കുന്നു. ഇതിനു വിപരീതമായി, മ്യൂച്വൽ ഫണ്ട് മറ്റുള്ളവർ കൈകാര്യം ചെയ്യുന്ന ബാഹ്യ ഫണ്ടുകളിൽ നിക്ഷേപിക്കുന്ന ഒരു സാഹചര്യമാണ് അനിയന്ത്രിതമായ മാനേജ്മെന്റ്.അസറ്റ് മാനേജ്മെന്റ് കമ്പനികൾ. ഒരേ ഫാമിലി ഫണ്ടുകളിലേക്ക് സ്വയം പരിമിതപ്പെടുത്തുന്നതിനുപകരം നിരവധി ഫണ്ടുകളിൽ നിന്നും മറ്റ് സ്കീമുകളിൽ നിന്നുമുള്ള അവസരങ്ങൾ ചൂഷണം ചെയ്യാൻ കഴിയുന്നതിനാൽ, തടസ്സമില്ലാത്ത ഫണ്ടുകൾക്ക് ഫെറ്റർഡ് ഫണ്ടുകളേക്കാൾ ഒരു നേട്ടമുണ്ട്.
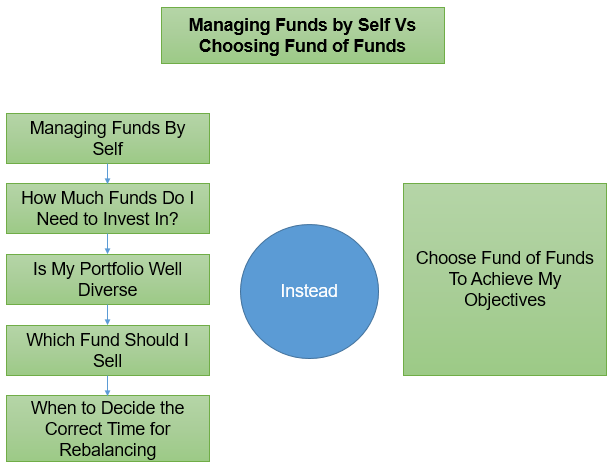
എന്തുകൊണ്ടാണ് ഫണ്ടുകളുടെ ഫണ്ട് തിരഞ്ഞെടുക്കുന്നത്?
ഒരു വ്യക്തിയുടെ ലക്ഷ്യങ്ങൾ കൈവരിക്കുന്നതിന് ലളിതമായ മ്യൂച്വൽ ഫണ്ടിന് പകരം മൾട്ടി-മാനേജ്മെന്റ് നിക്ഷേപം എങ്ങനെ സഹായിക്കുമെന്ന് ഇനിപ്പറയുന്ന ചിത്രം വ്യക്തത നൽകുന്നു.
മൾട്ടി-മാനേജ്മെന്റ് നിക്ഷേപത്തിന് ഇതുമായി ബന്ധപ്പെട്ട ധാരാളം നേട്ടങ്ങളുണ്ടെങ്കിലും, ഒരാൾ അറിഞ്ഞിരിക്കേണ്ട ഒരു പ്രധാന ഘടകമാണ് അതുമായി ബന്ധപ്പെട്ട ഫീസ്. ഒരു മ്യൂച്വൽ ഫണ്ട് ആകർഷിക്കുന്ന ഏതെങ്കിലും ചാർജുകളോ ചെലവുകളോ നിക്ഷേപകർ അറിഞ്ഞിരിക്കണം, അതനുസരിച്ച് അവരുടെ നിക്ഷേപം നടത്തുക. അതിനാൽ, ചുരുക്കത്തിൽ, മ്യൂച്വൽ ഫണ്ടുകളിൽ തടസ്സമില്ലാത്ത നിക്ഷേപം ആസ്വദിക്കാൻ ആഗ്രഹിക്കുന്ന നിക്ഷേപകർക്ക് അനുയോജ്യമായ നിക്ഷേപ ഓപ്ഷനാണ് ഫണ്ടുകളുടെ ഫണ്ട് എന്ന് നിഗമനം ചെയ്യാം.
FOF മ്യൂച്വൽ ഫണ്ടുകളിൽ ഓൺലൈനിൽ എങ്ങനെ നിക്ഷേപിക്കാം?
Fincash.com-ൽ ആജീവനാന്ത സൗജന്യ നിക്ഷേപ അക്കൗണ്ട് തുറക്കുക.
നിങ്ങളുടെ രജിസ്ട്രേഷനും KYC പ്രക്രിയയും പൂർത്തിയാക്കുക
രേഖകൾ അപ്ലോഡ് ചെയ്യുക (പാൻ, ആധാർ മുതലായവ).കൂടാതെ, നിങ്ങൾ നിക്ഷേപിക്കാൻ തയ്യാറാണ്!
പതിവുചോദ്യങ്ങൾ
1. FOF-കളുടെ ഏറ്റവും പ്രധാനപ്പെട്ട നേട്ടം എന്താണ്?
എ: FOF-കളുടെ ഏറ്റവും പ്രധാനപ്പെട്ട നേട്ടം അത് നിങ്ങളുടെ നിക്ഷേപത്തെ വൈവിധ്യവത്കരിക്കുകയും നല്ല വരുമാനം ഉറപ്പാക്കുകയും ചെയ്യുന്നു എന്നതാണ്. നിങ്ങളുടെ നിക്ഷേപ പോർട്ട്ഫോളിയോ വൈവിധ്യവത്കരിക്കാൻ നിങ്ങൾ പദ്ധതിയിടുകയാണെങ്കിൽ, FOF-കളിൽ നിക്ഷേപിക്കുന്നത് നല്ലതാണ്. ഇത് നിങ്ങളുടെ റിസ്ക് കുറയ്ക്കുകയും നിങ്ങളുടെ നിക്ഷേപങ്ങളിൽ നല്ല വരുമാനം ആസ്വദിക്കുകയും ചെയ്യുന്നു.
2. വ്യത്യസ്ത തരം FOF-കൾ ഏതൊക്കെയാണ്?
എ: അഞ്ച് വ്യത്യസ്ത തരം FOF-കൾ ഉണ്ട്, ഇവ താഴെ പറയുന്നവയാണ്:
- അസറ്റ് അലോക്കേഷൻ ഫണ്ടുകൾ
- സ്വർണ്ണ ഫണ്ടുകൾ
- അന്താരാഷ്ട്ര FOF-കൾ
- FOFs ഇടിഎഫുകൾ
- മൾട്ടി മാനേജർ FOF-കൾ
ഓരോ എഫ്ഒഎഫിനും തനതായ സവിശേഷതകളുണ്ട്. ഉദാഹരണത്തിന്, ഗോൾഡ് ഫണ്ടുകളിൽ നിങ്ങൾ നിക്ഷേപിക്കുംസ്വർണ്ണ ഇടിഎഫ് കൂടാതെ മൾട്ടി മാനേജർമാരുടെ FOF-കളിൽ നിങ്ങൾ വിവിധ തരത്തിലുള്ള മ്യൂച്വൽ ഫണ്ടുകളിൽ നിക്ഷേപിക്കും.
3. FOF-കളിൽ നിക്ഷേപിക്കുമ്പോൾ പരിഗണിക്കേണ്ട പാരാമീറ്ററുകൾ എന്തൊക്കെയാണ്?
എ: FOF-കൾ മ്യൂച്വൽ ഫണ്ടുകളാണ്, അതിനാൽ, നിങ്ങൾ നിക്ഷേപിക്കുമ്പോൾ, നിങ്ങളുടെ റിസ്ക് എടുക്കൽ ശേഷിയും നിങ്ങൾ നിക്ഷേപിക്കാൻ ആഗ്രഹിക്കുന്ന പണവും പരിഗണിക്കണം. തന്നിരിക്കുന്ന സമയത്ത് നിങ്ങൾ പ്രതീക്ഷിക്കുന്ന റിട്ടേണുകളുടെ ശതമാനം റിസ്ക് എടുക്കാനുള്ള നിങ്ങളുടെ കഴിവിനെ കുറിച്ച് ഒരു ആശയം നൽകും. അതിന്റെ അടിസ്ഥാനത്തിൽ, നിങ്ങൾ നിക്ഷേപിക്കാൻ ആഗ്രഹിക്കുന്ന പണം നിങ്ങൾ വിലയിരുത്തണം. FOF-കളിൽ നിങ്ങൾ എത്ര പണം നിക്ഷേപിക്കണമെന്ന് തീരുമാനിക്കാൻ നിങ്ങളുടെ സാമ്പത്തിക സ്ഥിതിയും നിങ്ങളെ സഹായിക്കും.
ഈ രണ്ട് ഘടകങ്ങളും നിങ്ങൾ വിലയിരുത്തിക്കഴിഞ്ഞാൽ, ഒരു പ്രത്യേക FOF തിരഞ്ഞെടുത്ത് നിക്ഷേപം ആരംഭിക്കുക.
4. ഏത് FOF ആണ് മികച്ച വരുമാനം കാണിച്ചത്?
എ: ഏറ്റവും സുരക്ഷിതമായ നിക്ഷേപങ്ങളിലൊന്നായാണ് ഗോൾഡ് എഫ്ഒഎഫുകൾ കണക്കാക്കപ്പെടുന്നത്. ഇവ സ്വർണ്ണ ഇടിഎഫുകൾ പോലെയാണ്, നിങ്ങൾ എപ്പോൾസ്വർണ്ണത്തിൽ നിക്ഷേപിക്കുക FOF, പണമടയ്ക്കൽ പോലുള്ള അധിക പ്രശ്നങ്ങളില്ലാതെ ഭൗതിക സ്വർണ്ണത്തിൽ നിക്ഷേപിക്കുന്നത് പോലെയാണ് ഇത്ജി.എസ്.ടി,വില്പന നികുതി, അല്ലെങ്കിൽ സമ്പത്ത് നികുതി. വിപണിയുമായി താരതമ്യപ്പെടുത്തുമ്പോൾ സ്വർണ്ണ വില ഒരിക്കലും വൻതോതിൽ കുറയാത്തതിനാൽ ഈ നിക്ഷേപം സുരക്ഷിതമാണ്, അതിനാൽ നല്ല വരുമാനം ലഭിക്കുന്നു. അതിനാൽ, പലപ്പോഴും സ്വർണ്ണ FOF ഏറ്റവും മികച്ചതും സുരക്ഷിതവുമായ നിക്ഷേപങ്ങളിലൊന്നായി കണക്കാക്കപ്പെടുന്നു.
5. ഏറ്റവും സാധാരണമായ ഏതെങ്കിലും FOF-കൾ ഉണ്ടോ?
എ: എക്സ്ചേഞ്ച് ട്രേഡഡ് ഫണ്ടുകൾ അല്ലെങ്കിൽ ഇടിഎഫുകൾ ഏറ്റവും ജനപ്രിയമായ FOF-കളാണ്, കാരണം ഈ ഫണ്ടുകളിൽ നിക്ഷേപിക്കുന്നത് എളുപ്പമാണ്. നിങ്ങൾ ചെയ്യേണ്ടത് ഒരു തുറക്കുക മാത്രമാണ്ഡീമാറ്റ് അക്കൗണ്ട് ETF-കളിൽ വ്യാപാരം നടത്തുന്നതിന്, നിങ്ങൾക്ക് ETF-കളിൽ നിക്ഷേപിക്കാൻ കഴിയുന്ന പണത്തിന് പരിമിതികളൊന്നുമില്ല.
6. FOF ന്റെ ഏറ്റവും നിർണായകമായ പരിമിതികളിൽ ഒന്ന് എന്താണ്?
എ: ഇത് നികുതി വിധേയമാണ്. ഒരു നിക്ഷേപകൻ എന്ന നിലയിൽ, നിങ്ങളുടെ നിക്ഷേപം റിഡീം ചെയ്യുമ്പോൾ നിങ്ങൾ പ്രധാന തുകയ്ക്ക് നികുതി നൽകേണ്ടിവരും. നിങ്ങൾ ഹ്രസ്വകാലത്തേക്ക് FOF ൽ നിക്ഷേപിക്കുകയാണെങ്കിൽ, നിങ്ങൾ പണം നൽകേണ്ടിവരുംനികുതികൾ പ്രിൻസിപ്പലിലും റിട്ടേണിലും. എന്നിരുന്നാലും, ഫണ്ട് ഹൗസ് നികുതി വഹിക്കുന്നതിനാൽ ലാഭവിഹിതം നികുതി നൽകേണ്ടതില്ല.
7. FOF-കൾക്ക് ദീർഘമായ ലോക്ക്-ഇൻ പിരീഡ് ഉണ്ടോ?
എ: വ്യത്യസ്ത എഫ്ഒഎഫുകൾക്ക് വ്യത്യസ്ത നിക്ഷേപ കാലയളവ് ഉണ്ട്. എന്നിരുന്നാലും, നിങ്ങൾക്ക് പരമാവധി വരുമാനം നേടാൻ താൽപ്പര്യമുണ്ടെങ്കിൽ, നിങ്ങൾ വളരെക്കാലം FOF-കളിൽ നിക്ഷേപിക്കണം.
ഇവിടെ നൽകിയിരിക്കുന്ന വിവരങ്ങൾ കൃത്യമാണെന്ന് ഉറപ്പാക്കാൻ എല്ലാ ശ്രമങ്ങളും നടത്തിയിട്ടുണ്ട്. എന്നിരുന്നാലും, ഡാറ്റയുടെ കൃത്യത സംബന്ധിച്ച് യാതൊരു ഉറപ്പും നൽകുന്നില്ല. എന്തെങ്കിലും നിക്ഷേപം നടത്തുന്നതിന് മുമ്പ് സ്കീം വിവര രേഖ ഉപയോഗിച്ച് പരിശോധിക്കുക.


AMFI Registration No. 112358 | CIN: U74999MH2016PTC282153
Shepard Technologies Pvt. Ltd. (with ARN code 112358) makes no warranties or representations, express or implied, on products offered through the platform. It accepts no liability for any damages or losses, however caused, in connection with the use of, or on the reliance of its product or related services. Terms and conditions of the website are applicable.
©2025 Shepard Technologies Private Limited. All Rights Reserved