
 +91-22-48913909
ہندوستان میں 7 بہترین فنڈز 2022
فنڈز کا فنڈ میں سے ایک ہےٹاپ میوچل فنڈز ان سرمایہ کاروں کے لیے جن کی سرمایہ کاری کی رقم بہت زیادہ نہیں ہے اور ان کے لیے متعدد فنڈز کے بجائے ایک فنڈ (فنڈز کا فنڈ) کا انتظام کرنا آسان ہے۔باہمی چندہ. میوچل فنڈ کی سرمایہ کاری کی حکمت عملی کی اس شکل میں، سرمایہ کاروں کو ایک ہی فنڈ کی چھتری کے نیچے متعدد فنڈز رکھنے کا موقع ملتا ہے، اس لیے اسے فنڈز کا نام دیا جاتا ہے۔
اکثر ملٹی مینیجر سرمایہ کاری کے نام سے جانا؛ اسے میوچل فنڈ کے زمروں میں سے ایک سمجھا جاتا ہے۔ ملٹی مینیجر سرمایہ کاری کا ایک اہم فائدہ یہ ہے کہ کم ٹکٹ سائز پر،سرمایہ کار میوچل فنڈ اسکیموں کے مختلف پہلوؤں میں خود کو متنوع بنا سکتے ہیں۔ تو آئیے ہم فنڈز کے فنڈ کے متعدد پہلوؤں جیسے فنڈز کے فنڈ میں سرمایہ کاری کیوں کریں، فنڈز کے فنڈز کے فوائد، ہندوستان میں فنڈز کے فنڈز، فنڈز کے فنڈ کی کارکردگی، اور دیگر اہم پہلوؤں کو دیکھیں۔
فنڈز کے فنڈز کیا ہیں؟
آسان الفاظ میں، aمیوچل فنڈ کی سرمایہ کاری دوسرے میوچل فنڈ (ایک یا شاید زیادہ) میں جمع کردہ رقم کو فنڈز کا فنڈ کہا جاتا ہے۔ اپنے پورٹ فولیو میں سرمایہ کار مختلف فنڈز کی نمائش کرتے ہیں اور ان کا الگ الگ ٹریک رکھتے ہیں۔ تاہم، کی طرف سےسرمایہ کاری ملٹی مینیجر میوچل فنڈز میں یہ عمل مزید آسان ہو جاتا ہے کیونکہ سرمایہ کاروں کو صرف ایک فنڈ کو ٹریک کرنے کی ضرورت ہوتی ہے، جس کے نتیجے میں اس میں متعدد میوچل فنڈز ہوتے ہیں۔ فرض کریں کہ ایک فرد نے 10 مختلف فنڈز میں سرمایہ کاری کی ہے جس میں مختلف مالیاتی اثاثوں جیسے اسٹاکس،بانڈز, سرکاری سیکیورٹیز، سونا، وغیرہ۔ تاہم، اسے ان فنڈز کا انتظام کرنے میں مشکل پیش آتی ہے کیونکہ اسے ہر فنڈ کا الگ الگ ٹریک رکھنے کی ضرورت ہوتی ہے۔ لہٰذا، اس طرح کی پریشانیوں سے بچنے کے لیے، سرمایہ کار کثیر انتظامی سرمایہ کاری (یا فنڈز کے ایک فنڈز کی حکمت عملی) میں رقم لگاتا ہے جس کے مختلف میوچل فنڈز میں داؤ لگے ہوتے ہیں۔
فنڈز کے فنڈز کی اقسام کیا ہیں؟
1. اثاثہ مختص کرنے کے فنڈز
یہ فنڈز ایک متنوع اثاثہ جات پر مشتمل ہوتے ہیں – جس میں ایکویٹی، قرض کے آلات، قیمتی دھاتیں وغیرہ شامل ہیں۔اثاثہ تین ہلاک پورٹ فولیو میں موجود نسبتاً مستحکم سیکیورٹیز کے ذریعہ کم خطرے کی سطح پر بہترین کارکردگی کا مظاہرہ کرنے والے آلے کے ذریعے زیادہ منافع حاصل کرنے کے لیے فنڈز۔
2. گولڈ فنڈز
مختلف میوچل فنڈز میں سرمایہ کاری، بنیادی طور پر گولڈ سیکیورٹیز میں تجارت گولڈ فنڈز ہیں۔ متعلقہ اثاثہ جات کی انتظامی کمپنی پر منحصر ہے کہ اس زمرے سے تعلق رکھنے والے فنڈز میں میوچل فنڈز یا گولڈ ٹریڈنگ کمپنیوں کا ایک پورٹ فولیو ہو سکتا ہے۔
3. فنڈز کا بین الاقوامی فنڈ
بیرونی ممالک میں کام کرنے والے میوچل فنڈز کو نشانہ بنایا جاتا ہے۔بین الاقوامی فنڈ فنڈز کی یہ سرمایہ کاروں کو متعلقہ ملک کے بہترین کارکردگی والے اسٹاک اور بانڈز کے ذریعے ممکنہ طور پر زیادہ منافع حاصل کرنے کی اجازت دیتا ہے۔
4. فنڈز کا ملٹی منیجر فنڈ
یہ فنڈز کی سب سے عام قسم ہے Mutual Funds میں دستیاب ہے۔مارکیٹ. ایسے فنڈ کی اثاثہ بنیاد مختلف پیشہ ورانہ طور پر منظم میوچل فنڈز پر مشتمل ہوتی ہے، جن میں سے سبھی کا پورٹ فولیو کا ارتکاز مختلف ہوتا ہے۔ فنڈز کے ملٹی منیجر فنڈ میں عام طور پر متعدد پورٹ فولیو مینیجر ہوتے ہیں، ہر ایک میوچل فنڈ میں موجود ایک مخصوص اثاثہ سے نمٹتا ہے۔
Talk to our investment specialist
5. فنڈز کا ETF فنڈ
پر مشتمل فنڈز کا فنڈایکسچینج ٹریڈڈ فنڈ ان کے پورٹ فولیو میں ملک میں سرمایہ کاری کا ایک مقبول ٹول ہے۔ فنڈز کے فنڈز کے ذریعے ETF میں سرمایہ کاری اس آلے میں براہ راست سرمایہ کاری سے زیادہ قابل رسائی ہے۔ اس کی وجہ یہ ہے کہ ETFs کو ڈیمیٹ کی ضرورت ہوتی ہے۔تجارتی اکاؤنٹ جبکہ فنڈز کے ETF فنڈ میں سرمایہ کاری کی ایسی کوئی حد نہیں ہے۔
تاہم، ETFs کا خطرہ قدرے زیادہ ہوتا ہے۔عنصر ان کے ساتھ وابستہ ہیں کیونکہ ان کی سٹاک مارکیٹ میں حصص کی طرح تجارت ہوتی ہے، جس سے یہ فنڈز مارکیٹ کی اتار چڑھاؤ کے لیے زیادہ حساس ہوتے ہیں۔
فنڈز کے فنڈز میں کون سرمایہ کاری کرے؟
فنڈز کے سرفہرست فنڈ کا بنیادی مقصد مختلف پورٹ فولیو میں سرمایہ کاری کرکے کم سے کم خطرہ لاحق ہو کر زیادہ سے زیادہ منافع حاصل کرنا ہے۔ ایسے افراد جن کے پاس مالی وسائل کے ایک چھوٹے سے تالاب تک رسائی ہے جسے وہ زیادہ طویل مدت کے لیے بچا سکتے ہیں وہ ایسے میوچل فنڈ کا انتخاب کر سکتے ہیں۔ چونکہ اس طرح کے فنڈز کا پورٹ فولیو مختلف پر مشتمل ہوتا ہے۔میوچل فنڈز کی اقسام، یہ اعلی تک رسائی کو یقینی بناتا ہے۔قدر فنڈز اس کے ساتھ ساتھ.
مثالی طور پر، نسبتاً کم وسائل والے سرمایہ کار اور کملیکویڈیٹی ضروریات مارکیٹ میں دستیاب فنڈز کے سب سے اوپر فنڈ میں سرمایہ کاری کرنے کا انتخاب کر سکتی ہیں۔ یہ انہیں کم سے کم خطرے پر زیادہ سے زیادہ منافع حاصل کرنے کے قابل بناتا ہے۔
فنڈز کے فنڈز میں سرمایہ کاری کے فوائد
مختلف ہیں۔سرمایہ کاری کے فوائد فنڈز کے فنڈ میں میوچل فنڈ -
1. تنوع
فنڈز کے فنڈز مختلف ہدفبہترین کارکردگی کا مظاہرہ کرنے والے میوچل فنڈز مارکیٹ میں، ہر ایک مخصوص اثاثہ یا فنڈ کے شعبے میں مہارت رکھتا ہے۔ یہ تنوع کے ذریعے فوائد کو یقینی بناتا ہے، کیونکہ پورٹ فولیو کی بنیادی اقسام کی وجہ سے منافع اور خطرات دونوں کو بہتر بنایا جاتا ہے۔
2. پیشہ ورانہ تربیت یافتہ مینیجرز
فنڈز کے فنڈز کا انتظام اعلیٰ تربیت یافتہ افراد کے ذریعے کیا جاتا ہے جن کا برسوں کا تجربہ ہوتا ہے۔ اس طرح کے پورٹ فولیو مینیجرز کی طرف سے مناسب تجزیہ اور حسابی مارکیٹ کی پیشین گوئیاں سرمایہ کاری کی پیچیدہ حکمت عملیوں کے ذریعے اعلیٰ پیداوار کو یقینی بناتی ہیں۔
3. کم وسائل کی ضروریات
محدود مالی وسائل کا حامل فرد زیادہ منافع کمانے کے لیے دستیاب فنڈز کے اعلیٰ فنڈ میں آسانی سے سرمایہ کاری کر سکتا ہے۔ سرمایہ کاری کے لیے فنڈز کے فنڈ کا انتخاب کرتے ہوئے ماہانہ سرمایہ کاری کی اسکیموں سے بھی فائدہ اٹھایا جا سکتا ہے۔
فنڈز کے فنڈز کی حدود
1. اخراجات کا تناسب
فنڈز کے فنڈ کا انتظام کرنے کے لیے اخراجات کا تناسب میوچل فنڈز معیاری میوچل فنڈز سے زیادہ ہوتے ہیں، کیونکہ اس میں انتظامی اخراجات زیادہ ہوتے ہیں۔ اضافی اخراجات میں بنیادی طور پر سرمایہ کاری کے لیے صحیح اثاثہ کا انتخاب شامل ہے، جو وقتاً فوقتاً اتار چڑھاؤ ہوتا رہتا ہے۔
2. ٹیکس
فنڈز کے فنڈ پر لگائے گئے ٹیکس ایک سرمایہ کار کے ذریعہ قابل ادائیگی ہیں، صرف اس دورانرہائی اصل رقم کا۔ تاہم، بحالی کے دوران، مختصر مدت اور طویل مدتی دونوںسرمایہ سالانہ کے لحاظ سے منافع ٹیکس کی کٹوتیوں سے مشروط ہیں۔آمدنی سرمایہ کار اور سرمایہ کاری کی مدت۔
سرمایہ کاری کے لیے فنڈز کا بہترین کارکردگی کا مظاہرہ کرنے والا فنڈ 2022
Fund NAV Net Assets (Cr) 3 MO (%) 6 MO (%) 1 YR (%) 3 YR (%) 5 YR (%) 2025 (%) PGIM India Euro Equity Fund Growth ₹20.87
↓ -0.19 ₹1,415 -1.7 -8.3 18.9 22.2 1.3 18.3 IDBI Nifty Index Fund Growth ₹36.2111
↓ -0.02 ₹208 9.1 11.9 16.2 20.3 11.7 Bandhan All Seasons Bond Fund Growth ₹46.8846
↑ 0.01 ₹1,865 0.9 2.6 5.3 7 5.9 7.1 ICICI Prudential Advisor Series - Hybrid Fund Growth ₹66.8046
↓ -0.03 ₹3,294 0.3 2.2 5 8.7 8.8 6.6 HDFC Dynamic PE Ratio Fund of Funds Growth ₹41.3728
↓ 0.00 ₹2,647 0.5 2.2 4.5 8.1 9.3 1.3 ICICI Prudential Advisor Series - Debt Management Fund Growth ₹47.4808
↓ -0.09 ₹106 -0.4 1.6 3.5 6.7 6 7.6 PGIM India Global Agribusiness Offshore Fund Growth ₹46.73
↑ 0.26 ₹1,677 -7.6 -2.6 0.2 15.1 3.3 7.9 Note: Returns up to 1 year are on absolute basis & more than 1 year are on CAGR basis. as on 19 Oct 26 Research Highlights & Commentary of 7 Funds showcased
Commentary PGIM India Euro Equity Fund IDBI Nifty Index Fund Bandhan All Seasons Bond Fund ICICI Prudential Advisor Series - Hybrid Fund HDFC Dynamic PE Ratio Fund of Funds ICICI Prudential Advisor Series - Debt Management Fund PGIM India Global Agribusiness Offshore Fund Point 1 Lower mid AUM (₹1,415 Cr). Bottom quartile AUM (₹208 Cr). Upper mid AUM (₹1,865 Cr). Highest AUM (₹3,294 Cr). Upper mid AUM (₹2,647 Cr). Bottom quartile AUM (₹106 Cr). Lower mid AUM (₹1,677 Cr). Point 2 Established history (19+ yrs). Established history (16+ yrs). Oldest track record among peers (22 yrs). Established history (22+ yrs). Established history (14+ yrs). Established history (22+ yrs). Established history (16+ yrs). Point 3 Rating: 2★ (lower mid). Rating: 1★ (bottom quartile). Rating: 3★ (upper mid). Rating: 3★ (upper mid). Rating: 3★ (lower mid). Top rated. Rating: 1★ (bottom quartile). Point 4 Risk profile: High. Risk profile: Moderately High. Risk profile: Moderately Low. Risk profile: Moderately High. Risk profile: Moderately High. Risk profile: Moderate. Risk profile: High. Point 5 5Y return: 1.25% (bottom quartile). 5Y return: 11.74% (top quartile). 5Y return: 5.93% (lower mid). 5Y return: 8.78% (upper mid). 5Y return: 9.28% (upper mid). 5Y return: 6.01% (lower mid). 5Y return: 3.35% (bottom quartile). Point 6 3Y return: 22.22% (top quartile). 3Y return: 20.28% (upper mid). 3Y return: 7.01% (bottom quartile). 3Y return: 8.66% (lower mid). 3Y return: 8.11% (lower mid). 3Y return: 6.72% (bottom quartile). 3Y return: 15.12% (upper mid). Point 7 1Y return: 18.92% (top quartile). 1Y return: 16.16% (upper mid). 1Y return: 5.27% (upper mid). 1Y return: 4.96% (lower mid). 1Y return: 4.49% (lower mid). 1Y return: 3.49% (bottom quartile). 1Y return: 0.17% (bottom quartile). Point 8 1M return: -9.38% (bottom quartile). 1M return: 3.68% (top quartile). 1M return: 0.17% (upper mid). 1M return: -0.34% (lower mid). 1M return: -0.04% (upper mid). 1M return: -0.85% (lower mid). 1M return: -2.99% (bottom quartile). Point 9 Alpha: -16.90 (bottom quartile). Alpha: -1.03 (lower mid). Alpha: 0.00 (top quartile). Alpha: 0.00 (upper mid). Alpha: 0.00 (upper mid). Alpha: 0.00 (lower mid). Alpha: -24.04 (bottom quartile). Point 10 Sharpe: 0.71 (upper mid). Sharpe: 1.04 (top quartile). Sharpe: 0.10 (lower mid). Sharpe: 0.22 (upper mid). Sharpe: -0.25 (bottom quartile). Sharpe: -0.24 (bottom quartile). Sharpe: 0.03 (lower mid). PGIM India Euro Equity Fund
IDBI Nifty Index Fund
Bandhan All Seasons Bond Fund
ICICI Prudential Advisor Series - Hybrid Fund
HDFC Dynamic PE Ratio Fund of Funds
ICICI Prudential Advisor Series - Debt Management Fund
PGIM India Global Agribusiness Offshore Fund
اثاثے >= 50 کروڑ & کی بنیاد پر ترتیب دیا گیا ہے۔1 سال کی واپسی۔.
(Erstwhile DHFL Pramerica Top Euroland Offshore Fund) The primary investment objective of the scheme is to generate long-term capital growth from a diversified portfolio of units of overseas mutual funds. Below is the key information for PGIM India Euro Equity Fund Returns up to 1 year are on The investment objective of the scheme is to invest in the stocks and equity related instruments comprising the S&P CNX Nifty Index in the same weights as these stocks represented in the Index with the intent to replicate the performance of the Total Returns Index of S&P CNX Nifty index. The scheme will adopt a passive investment strategy and will seek to achieve the investment objective by minimizing the tracking error between the S&P CNX Nifty index (Total Returns Index) and the scheme. Research Highlights for IDBI Nifty Index Fund Below is the key information for IDBI Nifty Index Fund Returns up to 1 year are on Seek to generate optimal returns with high liquidity by active management of
the portfolio by investing predominantly in debt oriented mutual fund schemes and money market instruments. However, there can be no assurance that the investment objectives of the Scheme will be realized. Research Highlights for Bandhan All Seasons Bond Fund Below is the key information for Bandhan All Seasons Bond Fund Returns up to 1 year are on (Erstwhile ICICI Prudential Advisor Series - Cautious Plan) The primary investment objective of this Plan is to seek to generate regular income primarily through investments in the schemes of domestic or offshore Mutual Fund(s) having asset allocation: • Primarily to fixed income securities • To a lesser extent (maximum 35%) in equity and equity related securities so as to generate long-term capital appreciation. However, there can be no assurance that the investment objectives of the Plan/s will be realized. Research Highlights for ICICI Prudential Advisor Series - Hybrid Fund Below is the key information for ICICI Prudential Advisor Series - Hybrid Fund Returns up to 1 year are on The Scheme seeks to generate regular income through investments in debt & money market instruments, along with capital appreciation through limited exposure to equity and equity related instruments. Research Highlights for HDFC Dynamic PE Ratio Fund of Funds Below is the key information for HDFC Dynamic PE Ratio Fund of Funds Returns up to 1 year are on (Erstwhile ICICI Prudential Advisor Series - Dynamic Accrual Plan) The primary investment objective of this Plan is to seek to provide reasonable returns, commensurate with low risk while providing a high level of liquidity, through investments made primarily in the schemes of domestic or offshore Mutual Fund(s) having asset allocation to: • Money market and debt securities. This Plan may be considered to be ideal for investors having a low risk appetite and a shorter duration of investment. However, there can be no assurance that the investment objectives of the Plan/s will be realized. Research Highlights for ICICI Prudential Advisor Series - Debt Management Fund Below is the key information for ICICI Prudential Advisor Series - Debt Management Fund Returns up to 1 year are on The primary investment objective of the scheme is to generate long-term capital growth by investing predominantly in units of overseas mutual funds, focusing on
agriculture and/or would be direct and indirect beneficiaries of the anticipated growth in the agriculture and/or affiliated/allied sectors. Research Highlights for PGIM India Global Agribusiness Offshore Fund Below is the key information for PGIM India Global Agribusiness Offshore Fund Returns up to 1 year are on 1. PGIM India Euro Equity Fund
PGIM India Euro Equity Fund
Growth Launch Date 11 Sep 07 NAV (19 Oct 26) ₹20.87 ↓ -0.19 (-0.90 %) Net Assets (Cr) ₹1,415 on 30 Sep 26 Category Others - Fund of Fund AMC Pramerica Asset Managers Private Limited Rating ☆☆ Risk High Expense Ratio 1.68 Sharpe Ratio 0.71 Information Ratio -0.43 Alpha Ratio -16.9 Min Investment 5,000 Min SIP Investment 1,000 Exit Load 0-12 Months (1%),12 Months and above(NIL) Growth of 10,000 investment over the years.
Date Value 30 Sep 21 ₹10,000 30 Sep 22 ₹6,031 30 Sep 23 ₹6,121 30 Sep 24 ₹8,039 30 Sep 25 ₹9,649 30 Sep 26 ₹12,168 Returns for PGIM India Euro Equity Fund
absolute basis & more than 1 year are on CAGR (Compound Annual Growth Rate) basis. as on 19 Oct 26 Duration Returns 1 Month -9.4% 3 Month -1.7% 6 Month -8.3% 1 Year 18.9% 3 Year 22.2% 5 Year 1.3% 10 Year 15 Year Since launch 3.9% Historical performance (Yearly) on absolute basis
Year Returns 2025 18.3% 2024 20.6% 2023 14.6% 2022 -35.6% 2021 -1.9% 2020 20.5% 2019 21.4% 2018 -10.3% 2017 14.6% 2016 -6.7% Fund Manager information for PGIM India Euro Equity Fund
Name Since Tenure Anandha Padmanabhan Anjeneyan 15 Feb 25 1.54 Yr. Vivek Sharma 15 Feb 25 1.54 Yr. Data below for PGIM India Euro Equity Fund as on 30 Sep 26
Asset Allocation
Asset Class Value Cash 10.01% Equity 89.99% Top Securities Holdings / Portfolio
Name Holding Value Quantity PGIM Jennison Emerging Mkts Eq USD W Acc
Investment Fund | -96% ₹1,362 Cr 982,813 Clearing Corporation Of India Ltd.
CBLO/Reverse Repo | -4% ₹51 Cr Net Receivables / (Payables)
Net Current Assets | -0% ₹1 Cr 2. IDBI Nifty Index Fund
IDBI Nifty Index Fund
Growth Launch Date 25 Jun 10 NAV (28 Jul 23) ₹36.2111 ↓ -0.02 (-0.06 %) Net Assets (Cr) ₹208 on 30 Jun 23 Category Others - Index Fund AMC IDBI Asset Management Limited Rating ☆ Risk Moderately High Expense Ratio 0.9 Sharpe Ratio 1.04 Information Ratio -3.93 Alpha Ratio -1.03 Min Investment 5,000 Min SIP Investment 500 Exit Load NIL Growth of 10,000 investment over the years.
Date Value Returns for IDBI Nifty Index Fund
absolute basis & more than 1 year are on CAGR (Compound Annual Growth Rate) basis. as on 19 Oct 26 Duration Returns 1 Month 3.7% 3 Month 9.1% 6 Month 11.9% 1 Year 16.2% 3 Year 20.3% 5 Year 11.7% 10 Year 15 Year Since launch 10.3% Historical performance (Yearly) on absolute basis
Year Returns 2025 2024 2023 2022 2021 2020 2019 2018 2017 2016 Fund Manager information for IDBI Nifty Index Fund
Name Since Tenure Data below for IDBI Nifty Index Fund as on 30 Jun 23
Asset Allocation
Asset Class Value Top Securities Holdings / Portfolio
Name Holding Value Quantity 3. Bandhan All Seasons Bond Fund
Bandhan All Seasons Bond Fund
Growth Launch Date 13 Sep 04 NAV (21 Oct 26) ₹46.8846 ↑ 0.01 (0.02 %) Net Assets (Cr) ₹1,865 on 30 Sep 26 Category Others - Fund of Fund AMC IDFC Asset Management Company Limited Rating ☆☆☆ Risk Moderately Low Expense Ratio 0.29 Sharpe Ratio 0.1 Information Ratio 0 Alpha Ratio 0 Min Investment 5,000 Min SIP Investment 1,000 Exit Load 0-3 Months (0.5%),3 Months and above(NIL) Growth of 10,000 investment over the years.
Date Value 30 Sep 21 ₹10,000 30 Sep 22 ₹10,226 30 Sep 23 ₹10,888 30 Sep 24 ₹11,771 30 Sep 25 ₹12,619 30 Sep 26 ₹13,338 Returns for Bandhan All Seasons Bond Fund
absolute basis & more than 1 year are on CAGR (Compound Annual Growth Rate) basis. as on 19 Oct 26 Duration Returns 1 Month 0.2% 3 Month 0.9% 6 Month 2.6% 1 Year 5.3% 3 Year 7% 5 Year 5.9% 10 Year 15 Year Since launch 7.2% Historical performance (Yearly) on absolute basis
Year Returns 2025 7.1% 2024 7.8% 2023 6.8% 2022 3.2% 2021 3.3% 2020 10.5% 2019 10.4% 2018 6.3% 2017 5.9% 2016 8.9% Fund Manager information for Bandhan All Seasons Bond Fund
Name Since Tenure Harshal Joshi 15 Jul 16 10.14 Yr. Data below for Bandhan All Seasons Bond Fund as on 30 Sep 26
Asset Allocation
Asset Class Value Cash 50.45% Debt 49.46% Other 0.09% Top Securities Holdings / Portfolio
Name Holding Value Quantity Bandhan Corporate Bond Dir Gr
Investment Fund | -58% ₹1,048 Cr 495,308,536
↑ 7,930,136 Bandhan Arbitrage Dir Gr
Investment Fund | -42% ₹751 Cr 198,911,352
↑ 2,970,790 Triparty Repo Trp_010926
CBLO/Reverse Repo | -0% ₹8 Cr Net Current Assets
Net Current Assets | -0% -₹2 Cr Cash Margin - Ccil
CBLO/Reverse Repo | -0% ₹0 Cr 4. ICICI Prudential Advisor Series - Hybrid Fund
ICICI Prudential Advisor Series - Hybrid Fund
Growth Launch Date 18 Dec 03 NAV (21 Oct 26) ₹66.8046 ↓ -0.03 (-0.05 %) Net Assets (Cr) ₹3,294 on 30 Sep 26 Category Others - Fund of Fund AMC ICICI Prudential Asset Management Company Limited Rating ☆☆☆ Risk Moderately High Expense Ratio 0.25 Sharpe Ratio 0.22 Information Ratio 0 Alpha Ratio 0 Min Investment 5,000 Min SIP Investment 1,000 Exit Load 0-1 Months (0.25%),1 Months and above(NIL) Growth of 10,000 investment over the years.
Date Value 30 Sep 21 ₹10,000 30 Sep 22 ₹10,390 30 Sep 23 ₹11,943 30 Sep 24 ₹13,801 30 Sep 25 ₹14,470 30 Sep 26 ₹15,319 Returns for ICICI Prudential Advisor Series - Hybrid Fund
absolute basis & more than 1 year are on CAGR (Compound Annual Growth Rate) basis. as on 19 Oct 26 Duration Returns 1 Month -0.3% 3 Month 0.3% 6 Month 2.2% 1 Year 5% 3 Year 8.7% 5 Year 8.8% 10 Year 15 Year Since launch 8.7% Historical performance (Yearly) on absolute basis
Year Returns 2025 6.6% 2024 12.3% 2023 14.4% 2022 6.7% 2021 10.8% 2020 9.2% 2019 8.6% 2018 6.4% 2017 5.8% 2016 9.6% Fund Manager information for ICICI Prudential Advisor Series - Hybrid Fund
Name Since Tenure Manish Banthia 16 Jun 17 9.22 Yr. Ritesh Lunawat 29 Dec 20 5.68 Yr. Data below for ICICI Prudential Advisor Series - Hybrid Fund as on 30 Sep 26
Asset Allocation
Asset Class Value Cash 49.65% Debt 50.3% Other 0.16% Top Securities Holdings / Portfolio
Name Holding Value Quantity ICICI Prudential Arbitrage Dir Gr
Investment Fund | -37% ₹1,209 Cr 305,547,819
↑ 3,795,616 ICICI Pru Corporate Bond Dir Gr
Investment Fund | -31% ₹1,023 Cr 305,392,121 ICICI Pru Floating Interest Dir Gr
Investment Fund | -12% ₹400 Cr 7,982,320
↑ 4,487,729 ICICI Pru Nifty PSU B Pl SDL Dir Gr
Investment Fund | -10% ₹327 Cr 244,319,061
↑ 7,504,372 ICICI Pru Gilt Dir Gr
Investment Fund | -7% ₹225 Cr 19,223,545
↓ -16,981,273 Treps
CBLO/Reverse Repo | -3% ₹96 Cr Net Current Assets
Net Current Assets | -0% -₹2 Cr 5. HDFC Dynamic PE Ratio Fund of Funds
HDFC Dynamic PE Ratio Fund of Funds
Growth Launch Date 6 Feb 12 NAV (21 Oct 26) ₹41.3728 ↓ 0.00 (-0.01 %) Net Assets (Cr) ₹2,647 on 30 Sep 26 Category Others - Fund of Fund AMC HDFC Asset Management Company Limited Rating ☆☆☆ Risk Moderately High Expense Ratio 0.38 Sharpe Ratio -0.25 Information Ratio 0 Alpha Ratio 0 Min Investment 5,000 Min SIP Investment 300 Exit Load 0-1 Years (1%),1 Years and above(NIL) Growth of 10,000 investment over the years.
Date Value 30 Sep 21 ₹10,000 30 Sep 22 ₹10,413 30 Sep 23 ₹12,476 30 Sep 24 ₹15,250 30 Sep 25 ₹14,979 30 Sep 26 ₹15,751 Returns for HDFC Dynamic PE Ratio Fund of Funds
absolute basis & more than 1 year are on CAGR (Compound Annual Growth Rate) basis. as on 19 Oct 26 Duration Returns 1 Month 0% 3 Month 0.5% 6 Month 2.2% 1 Year 4.5% 3 Year 8.1% 5 Year 9.3% 10 Year 15 Year Since launch 10.1% Historical performance (Yearly) on absolute basis
Year Returns 2025 1.3% 2024 12.9% 2023 22.8% 2022 7.3% 2021 21.6% 2020 14.4% 2019 6% 2018 -2.3% 2017 23.6% 2016 9% Fund Manager information for HDFC Dynamic PE Ratio Fund of Funds
Name Since Tenure Anil Bamboli 27 Jun 14 12.27 Yr. Data below for HDFC Dynamic PE Ratio Fund of Funds as on 30 Sep 26
Asset Allocation
Asset Class Value Cash 49.17% Debt 50.73% Other 0.22% Top Securities Holdings / Portfolio
Name Holding Value Quantity HDFC Corporate Bond Dir Gr
Investment Fund | -45% ₹1,182 Cr 336,154,858 HDFC Arbitrage Direct Growth
Investment Fund | -37% ₹969 Cr 445,629,422 HDFC Money Market Dir Gr
Investment Fund | -17% ₹447 Cr 709,144 Treps - Tri-Party Repo
CBLO/Reverse Repo | -1% ₹34 Cr Net Current Assets
Net Current Assets | -0% -₹6 Cr 6. ICICI Prudential Advisor Series - Debt Management Fund
ICICI Prudential Advisor Series - Debt Management Fund
Growth Launch Date 18 Dec 03 NAV (21 Oct 26) ₹47.4808 ↓ -0.09 (-0.18 %) Net Assets (Cr) ₹106 on 30 Sep 26 Category Others - Fund of Fund AMC ICICI Prudential Asset Management Company Limited Rating ☆☆☆☆ Risk Moderate Expense Ratio 0.62 Sharpe Ratio -0.25 Information Ratio 0 Alpha Ratio 0 Min Investment 5,000 Min SIP Investment 100 Exit Load 0-6 Months (0.5%),6 Months and above(NIL) Growth of 10,000 investment over the years.
Date Value 30 Sep 21 ₹10,000 30 Sep 22 ₹10,296 30 Sep 23 ₹11,023 30 Sep 24 ₹11,939 30 Sep 25 ₹12,865 30 Sep 26 ₹13,495 Returns for ICICI Prudential Advisor Series - Debt Management Fund
absolute basis & more than 1 year are on CAGR (Compound Annual Growth Rate) basis. as on 19 Oct 26 Duration Returns 1 Month -0.8% 3 Month -0.4% 6 Month 1.6% 1 Year 3.5% 3 Year 6.7% 5 Year 6% 10 Year 15 Year Since launch 7.1% Historical performance (Yearly) on absolute basis
Year Returns 2025 7.6% 2024 8.1% 2023 7.5% 2022 4% 2021 4.2% 2020 9.7% 2019 8.7% 2018 6.2% 2017 6.5% 2016 11.2% Fund Manager information for ICICI Prudential Advisor Series - Debt Management Fund
Name Since Tenure Manish Banthia 16 Jun 17 9.21 Yr. Ritesh Lunawat 29 Dec 20 5.67 Yr. Data below for ICICI Prudential Advisor Series - Debt Management Fund as on 30 Sep 26
Asset Allocation
Asset Class Value Cash 11.3% Equity 1.1% Debt 87.29% Other 0.3% Top Securities Holdings / Portfolio
Name Holding Value Quantity ICICI Pru All Seasons Bond Dir Gr
Investment Fund | -41% ₹43 Cr 10,182,323 ICICI Pru Short Term Dir Gr
Investment Fund | -33% ₹35 Cr 4,897,478 ICICI Pru Medium Term Dir Gr
Investment Fund | -12% ₹12 Cr 2,308,862 ICICI Pru Gilt Dir Gr
Investment Fund | -8% ₹8 Cr 686,142
↓ -508,813 ICICI Pru Floating Interest Dir Gr
Investment Fund | -6% ₹6 Cr 119,650
↑ 119,650 Treps
CBLO/Reverse Repo | -1% ₹1 Cr Net Current Assets
Net Current Assets | -0% ₹0 Cr 7. PGIM India Global Agribusiness Offshore Fund
PGIM India Global Agribusiness Offshore Fund
Growth Launch Date 14 May 10 NAV (19 Oct 26) ₹46.73 ↑ 0.26 (0.56 %) Net Assets (Cr) ₹1,677 on 30 Sep 26 Category Others - Fund of Fund AMC Pramerica Asset Managers Private Limited Rating ☆ Risk High Expense Ratio 1.57 Sharpe Ratio 0.03 Information Ratio -0.75 Alpha Ratio -24.04 Min Investment 5,000 Min SIP Investment 1,000 Exit Load 0-12 Months (1%),12 Months and above(NIL) Growth of 10,000 investment over the years.
Date Value 30 Sep 21 ₹10,000 30 Sep 22 ₹6,591 30 Sep 23 ₹8,306 30 Sep 24 ₹11,604 30 Sep 25 ₹13,059 30 Sep 26 ₹13,551 Returns for PGIM India Global Agribusiness Offshore Fund
absolute basis & more than 1 year are on CAGR (Compound Annual Growth Rate) basis. as on 19 Oct 26 Duration Returns 1 Month -3% 3 Month -7.6% 6 Month -2.6% 1 Year 0.2% 3 Year 15.1% 5 Year 3.3% 10 Year 15 Year Since launch 9.8% Historical performance (Yearly) on absolute basis
Year Returns 2025 7.9% 2024 24% 2023 39.5% 2022 -33.8% 2021 7% 2020 72.4% 2019 30.9% 2018 0.3% 2017 11.9% 2016 0.8% Fund Manager information for PGIM India Global Agribusiness Offshore Fund
Name Since Tenure Anandha Padmanabhan Anjeneyan 15 Feb 25 1.54 Yr. Vivek Sharma 15 Feb 25 1.54 Yr. Data below for PGIM India Global Agribusiness Offshore Fund as on 30 Sep 26
Asset Allocation
Asset Class Value Cash 6.79% Equity 93.21% Top Securities Holdings / Portfolio
Name Holding Value Quantity PGIM Jennison Global Eq Opps USD I Acc
Investment Fund | -96% ₹1,585 Cr 511,394 Clearing Corporation Of India Ltd.
CBLO/Reverse Repo | -4% ₹62 Cr Net Receivables / (Payables)
Net Current Assets | -0% -₹3 Cr
فنڈز کے فنڈز کے فوائد
ہر میوچل فنڈ کی طرح، فنڈز کے فنڈ کے بھی بے شمار فوائد ہیں۔ ان میں سے کچھ یہ ہیں:
1. پورٹ فولیو تنوع اور فنڈ مختص کرنا
اہم بنیادی فوائد میں سے ایک پورٹ فولیو تنوع ہے۔ یہاں، ایک ہی فنڈ میں سرمایہ کاری کرنے کے باوجود، سرمایہ کاری متعدد میوچل فنڈ اسکیموں میں کی جاتی ہے، جہاں فنڈ کو ایک بہترین انداز میں مختص کیا جاتا ہے تاکہ خطرے کی ایک دی گئی سطح پر زیادہ سے زیادہ منافع حاصل کیا جاسکے۔
2. متنوع اثاثوں کے لیے گیٹ وے
کثیر انتظامی سرمایہ کاری خوردہ سرمایہ کاروں کو ان فنڈز تک رسائی حاصل کرنے میں مدد کرتی ہے جو سرمایہ کاری کے لیے آسانی سے دستیاب نہیں ہیں۔ فنڈ کا ایک واحد فنڈ بدلے میں نمائش لے سکتا ہے۔ایکویٹی فنڈز,قرض فنڈ یا یہاں تک کہ اجناس پر مبنی میوچل فنڈز۔ یہ صرف ایک میوچل فنڈ میں شامل ہونے سے خوردہ سرمایہ کار کے لیے تنوع کو یقینی بناتا ہے۔
3. مستعدی کا عمل
اس زمرے کے تحت تمام فنڈز سے توقع کی جاتی ہے کہ وہ فنڈ مینیجر کے ذریعہ کئے گئے مستعدی کے عمل کی پیروی کریں جہاں انہیں سرمایہ کاری کرنے سے پہلے بنیادی فنڈ مینیجرز کے پس منظر اور اسناد کو چیک کرنے کی ضرورت ہے تاکہ یہ یقینی بنایا جا سکے کہ حکمت عملی توقعات کے مطابق ہے۔
4. کم سرمایہ کاری کی رقم
یہ ان خوردہ سرمایہ کاروں کے لیے ایک اچھا آپشن ہے جو کم ٹکٹ سائز کے ساتھ اس سرمایہ کاری کے راستے میں قدم رکھنا چاہتے ہیں۔
فنڈ کا ایک فنڈ کیسے کام کرتا ہے؟
کثیر مینیجر کی سرمایہ کاری کے کام کرنے کے طریقوں کو سمجھنے کے لیے، یہ ضروری ہے کہ ہم بیڑی اور بے لگام انتظام کے تصورات کو سمجھیں۔ فیٹرڈ مینجمنٹ ایک ایسی صورتحال ہے جب میوچل فنڈ اپنی رقم کو ایک ایسے پورٹ فولیو میں لگاتا ہے جس میں اثاثے اور فنڈز اس کی اپنی کمپنی کے زیر انتظام ہوتے ہیں۔ دوسرے الفاظ میں، پیسہ اسی اثاثہ مینجمنٹ کمپنی کے فنڈز میں لگایا جاتا ہے. اس کے برعکس، غیر متزلزل انتظام ایک ایسی صورت حال ہے جہاں میوچل فنڈ دوسرے کے زیر انتظام بیرونی فنڈز میں سرمایہ کاری کرتا ہے۔اثاثہ جات کے انتظام کی کمپنیاں. بے لگام فنڈز کو بند فنڈز پر فائدہ ہوتا ہے کیونکہ وہ اپنے آپ کو ایک ہی فیملی فنڈز تک محدود رکھنے کے بجائے متعدد فنڈز اور دیگر اسکیموں سے مواقع کا فائدہ اٹھا سکتے ہیں۔
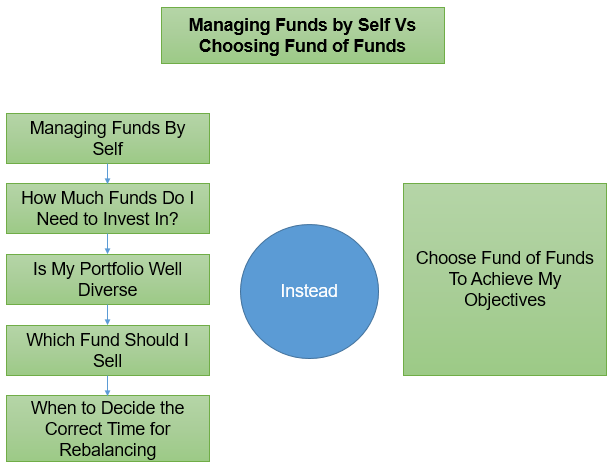
فنڈز کا فنڈ کیوں منتخب کریں؟
مندرجہ ذیل تصویر اس بات کو واضح کرتی ہے کہ کس طرح ایک سادہ میوچل فنڈ کے بجائے کثیر انتظامی سرمایہ کاری کسی فرد کو اپنے مقاصد حاصل کرنے میں مدد دے سکتی ہے۔
اگرچہ ملٹی مینجمنٹ انویسٹمنٹ کے اس سے وابستہ بہت سے فوائد ہیں، لیکن ایک اہم عنصر جس سے آگاہ ہونا ضروری ہے وہ ہے اس سے وابستہ فیس۔ سرمایہ کاروں کو کسی بھی چارجز یا اخراجات سے آگاہ ہونا چاہیے جو میوچل فنڈ اپنی طرف متوجہ کرے گا اور اسی کے مطابق اپنی سرمایہ کاری کرے گا۔ لہذا، مختصراً، یہ نتیجہ اخذ کیا جا سکتا ہے کہ فنڈز کا فنڈ ان سرمایہ کاروں کے لیے سرمایہ کاری کا ایک مثالی آپشن ہے جو میوچل فنڈز میں بغیر کسی پریشانی کے سرمایہ کاری سے لطف اندوز ہونا چاہتے ہیں۔
ایف او ایف میوچل فنڈز میں آن لائن سرمایہ کاری کیسے کی جائے؟
Fincash.com پر لائف ٹائم کے لیے مفت انویسٹمنٹ اکاؤنٹ کھولیں۔
اپنی رجسٹریشن اور KYC کا عمل مکمل کریں۔
دستاویزات اپ لوڈ کریں (PAN، آدھار، وغیرہ)۔اور، آپ سرمایہ کاری کے لیے تیار ہیں!
اکثر پوچھے گئے سوالات
1. FOFs کا سب سے اہم فائدہ کیا ہے؟
A: FOFs کا سب سے اہم فائدہ یہ ہے کہ یہ آپ کی سرمایہ کاری کو متنوع بناتا ہے اور اچھے منافع کو یقینی بناتا ہے۔ اگر آپ اپنے سرمایہ کاری کے پورٹ فولیو کو متنوع بنانے کا منصوبہ بنا رہے ہیں، تو FOFs میں سرمایہ کاری کرنا اچھا ہے۔ یہ آپ کے خطرے کو کم کرتا ہے اور اس بات کو یقینی بناتا ہے کہ آپ اپنی سرمایہ کاری پر اچھے منافع سے لطف اندوز ہوں۔
2. FOFs کی مختلف اقسام کیا ہیں؟
A: FOFs کی پانچ مختلف اقسام ہیں، اور یہ درج ذیل ہیں:
- اثاثہ مختص فنڈز
- گولڈ فنڈز
- بین الاقوامی ایف او ایف
- FOFs ETFs
- ملٹی مینیجر FOFs
FOF میں سے ہر ایک میں منفرد خصوصیات ہیں۔ مثال کے طور پر، سونے کے فنڈز میں آپ سرمایہ کاری کریں گے۔گولڈ ETF اور ملٹی مینیجرز FOFs میں آپ مختلف قسم کے میوچل فنڈز میں سرمایہ کاری کریں گے۔
3. FOFs میں سرمایہ کاری کرتے وقت کن پیرامیٹرز پر غور کرنا چاہیے؟
A: FOFs میوچل فنڈز ہیں، لہذا، جب آپ سرمایہ کاری کرتے ہیں تو آپ کو اپنی رسک لینے کی صلاحیت اور رقم کی رقم پر غور کرنا چاہیے جو آپ سرمایہ کاری کرنا چاہتے ہیں۔ مقررہ وقت میں آپ کی توقع کے مطابق منافع کا فیصد آپ کو خطرہ مول لینے کی آپ کی صلاحیت کا اندازہ دے گا۔ اس کی بنیاد پر، آپ کو اس رقم کا اندازہ لگانا چاہیے جس کی آپ سرمایہ کاری کرنا چاہتے ہیں۔ آپ کی مالی حالت یہ فیصلہ کرنے میں بھی آپ کی مدد کرے گی کہ آپ کو FOFs میں کتنی رقم لگانی چاہیے۔
ایک بار جب آپ ان دو عوامل کا اندازہ لگا لیں، ایک خاص FOF منتخب کریں اور سرمایہ کاری شروع کریں۔
4. کس ایف او ایف نے بہترین منافع دکھایا ہے؟
A: گولڈ ایف او ایف کو سب سے محفوظ سرمایہ کاری میں سے ایک سمجھا جاتا ہے۔ یہ گولڈ ای ٹی ایف کی طرح ہیں، اور جب آپسونے میں سرمایہ کاری کریں FOF، یہ ادائیگی جیسے اضافی مسائل کے بغیر جسمانی سونے میں سرمایہ کاری کرنے جیسا ہے۔جی ایس ٹی,سیلز ٹیکس، یا دولت ٹیکس۔ یہ سرمایہ کاری محفوظ ہے کیونکہ سونے کی قیمت مارکیٹ کے مقابلے میں کبھی بھی بڑے پیمانے پر نہیں گرتی ہے اور اس وجہ سے اچھا منافع ہوتا ہے۔ اس طرح، اکثر گولڈ ایف او ایف کو بہترین اور محفوظ ترین سرمایہ کاری میں سے ایک سمجھا جاتا ہے۔
5. کیا کوئی عام FOFs ہے؟
A: ایکسچینج ٹریڈڈ فنڈز یا ETFs سب سے زیادہ مقبول FOFs ہیں کیونکہ ان فنڈز میں سرمایہ کاری کرنا سب سے آسان ہے۔ آپ کو بس کھولنے کی ضرورت ہے۔ڈیمیٹ اکاؤنٹ ETFs میں تجارت کرنے کے لیے، اور ETFs میں آپ کتنی رقم کی سرمایہ کاری کر سکتے ہیں اس کی کوئی حد نہیں ہے۔
6. FOF کی سب سے اہم حدود میں سے ایک کیا ہے؟
A: یہ قابل ٹیکس ہے۔ ایک سرمایہ کار کے طور پر، جب آپ اپنی سرمایہ کاری کو چھڑاتے ہیں تو آپ کو اصل رقم پر ٹیکس ادا کرنا ہوگا۔ اگر آپ FOF میں مختصر مدت کے لیے سرمایہ کاری کرتے ہیں، تو آپ کو ادائیگی کرنی ہوگی۔ٹیکس پرنسپل اور واپسی پر۔ تاہم، حاصل کردہ ڈیویڈنڈ قابل ٹیکس نہیں ہے کیونکہ فنڈ ہاؤس ٹیکس برداشت کرتا ہے۔
7. کیا FOFs کا لاک ان پیریڈ طویل ہے؟
A: مختلف FOFs میں مختلف سرمایہ کاری کی مدت ہوتی ہے۔ تاہم، اگر آپ زیادہ سے زیادہ منافع کمانا چاہتے ہیں، تو آپ کو FOFs میں معقول حد تک طویل عرصے کے لیے سرمایہ کاری کرنی چاہیے۔
یہاں فراہم کردہ معلومات کے درست ہونے کو یقینی بنانے کے لیے تمام کوششیں کی گئی ہیں۔ تاہم، ڈیٹا کی درستگی کے حوالے سے کوئی ضمانت نہیں دی جاتی ہے۔ براہ کرم کوئی بھی سرمایہ کاری کرنے سے پہلے اسکیم کی معلومات کے دستاویز کے ساتھ تصدیق کریں۔
You Might Also Like









AMFI Registration No. 112358 | CIN: U74999MH2016PTC282153
Shepard Technologies Pvt. Ltd. (with ARN code 112358) makes no warranties or representations, express or implied, on products offered through the platform. It accepts no liability for any damages or losses, however caused, in connection with the use of, or on the reliance of its product or related services. Terms and conditions of the website are applicable.
©2026 Shepard Technologies Private Limited. All Rights Reserved
Research Highlights for PGIM India Euro Equity Fund