Table of Contents
- میوچل فنڈز میں یکمشت سرمایہ کاری سے آپ کا کیا مطلب ہے؟
- 2022 - 2023 میں یکمشت سرمایہ کاری کے لیے بہترین میوچل فنڈ
- پچھلے 1 مہینے پر مبنی بہترین میوچل فنڈز
- یکمشت سرمایہ کاری کے دوران جن چیزوں پر غور کیا جانا چاہیے۔
- میوچل فنڈ یکمشت واپسی کیلکولیٹر
- میوچل فنڈ میں ایک وقتی سرمایہ کاری کے فائدے اور نقصانات
- نتیجہ
Top 5 Funds
میوچل فنڈز میں یکمشت سرمایہ کاری
کیا آپ جانتے ہیں کہ آپ اس میں یکمشت رقم لگا سکتے ہیں۔باہمی چندہ? اگر ہاں، تو یہ اچھی بات ہے۔ تاہم، اگر نہیں، تو فکر نہ کریں۔ یہ مضمون آپ کو اسی سلسلے میں رہنمائی کرے گا۔ Mutual Funds میں یکمشت سرمایہ کاری سے مراد ایسی صورت حال ہے جب کوئی فرد ایک وقت میں Mutual Funds میں رقم لگاتا ہے۔ یہاں، جمع متعدد بار نہیں ہوتا ہے۔ کے درمیان بہت فرق ہے۔گھونٹ اور سرمایہ کاری کا یکمشت موڈ۔ تو، آئیے میوچل فنڈز میں یکمشت سرمایہ کاری کے تصور کو سمجھیں،بہترین باہمی فنڈز یکمشت سرمایہ کاری کے لیے، اس مضمون کے ذریعے یکمشت سرمایہ کاری کے دوران جن چیزوں پر غور کیا جانا چاہیے، Mutual Fund Lump sum ریٹرن کیلکولیٹر، اور دیگر متعلقہ پہلو۔

میوچل فنڈز میں یکمشت سرمایہ کاری سے آپ کا کیا مطلب ہے؟
میوچل فنڈ میں یکمشت سرمایہ کاری ایک ایسا منظر نامہ ہے جہاں افرادمیوچل فنڈز میں سرمایہ کاری کریں۔ صرف ایک بار کے لیے. تاہم، سرمایہ کاری کے ایس آئی پی موڈ کے برعکس جہاں افراد یکمشت موڈ میں تھوڑی رقم جمع کرتے ہیں، افراد کافی رقم جمع کرتے ہیں۔ دوسرے الفاظ میں، یہ ایک شاٹ تکنیک ہےسرمایہ کاری میوچل فنڈز میں سرمایہ کاری کا یکمشت موڈ ان سرمایہ کاروں کے لیے موزوں ہے جن کے پاس اضافی فنڈز ہیں جو ان کے پاس مثالی ہیں۔بینک اکاؤنٹ اور مزید کمانے کے لیے چینلز تلاش کر رہے ہیں۔آمدنی میوچل فنڈز میں سرمایہ کاری کرکے۔
2022 - 2023 میں یکمشت سرمایہ کاری کے لیے بہترین میوچل فنڈ
اس سے پہلے کہ آپ یکمشت موڈ کے ذریعے میوچل فنڈز میں سرمایہ کاری کریں، افراد کو مختلف پیرامیٹرز جیسے کہ AUM، سرمایہ کاری کی رقم، اور بہت کچھ پر غور کرنے کی ضرورت ہے۔ لہذا، ان پیرامیٹرز کی بنیاد پر یکمشت سرمایہ کاری کے لیے چند بہترین میوچل فنڈز درج ذیل ہیں۔
ایکویٹی میوچل فنڈز میں بہترین سرمایہ کاری
ایکویٹی فنڈز وہ اسکیمیں ہیں جو مختلف کمپنیوں کے ایکویٹی اور ایکویٹی سے متعلقہ آلات میں اپنے کارپس کی سرمایہ کاری کرتی ہیں۔ ان اسکیموں کو طویل مدتی سرمایہ کاری کے لیے ایک اچھا آپشن سمجھا جاتا ہے۔ اگرچہ افراد ایکویٹی فنڈز میں یکمشت رقم کی سرمایہ کاری کر سکتے ہیں لیکن ایکویٹی فنڈز میں سرمایہ کاری کی تجویز کردہ تکنیک یا تو SIP کے ذریعے ہے یامنظم منتقلی کا منصوبہ (STP) موڈ۔ ایس ٹی پی موڈ میں، افراد پہلے کافی رقم جمع کرتے ہیں۔قرض فنڈ جیسا کہمائع فنڈز اور پھر رقم کو ایکویٹی فنڈز میں باقاعدہ وقفوں پر منتقل کیا جاتا ہے۔ کچھ ایکویٹی میوچل فنڈز جن پر سرمایہ کاری کے لیے غور کیا جا سکتا ہے وہ درج ذیل ہیں۔
Fund NAV Net Assets (Cr) Min Investment 3 MO (%) 6 MO (%) 1 YR (%) 3 YR (%) 5 YR (%) 2023 (%) Nippon India Small Cap Fund Growth ₹157.898
↑ 1.60 ₹55,491 5,000 -2 -9 6.2 21.6 39.3 26.1 ICICI Prudential Infrastructure Fund Growth ₹182.22
↓ -0.27 ₹7,214 5,000 2.7 -4.4 7.3 28 38.9 27.4 Motilal Oswal Midcap 30 Fund Growth ₹93.0829
↑ 0.70 ₹26,028 5,000 -2.5 -9.9 15.2 26.4 36.6 57.1 IDFC Infrastructure Fund Growth ₹47.851
↑ 0.17 ₹1,563 5,000 0.6 -7.5 5.4 25.7 36.2 39.3 SBI Contra Fund Growth ₹367.272
↑ 4.16 ₹42,220 5,000 0.7 -6.1 6.9 20.9 35.8 18.8 Note: Returns up to 1 year are on absolute basis & more than 1 year are on CAGR basis. as on 22 Apr 25
Talk to our investment specialist
ڈیبٹ میوچل فنڈز میں بہترین یکمشت سرمایہ کاری
ڈیبٹ فنڈز اپنے فنڈ کی رقم مختلف میں لگاتے ہیں۔مقررہ آمدنی ٹریژری بلز، کارپوریٹ جیسے آلاتبانڈز، اور بہت کچھ. ان اسکیموں کو مختصر اور درمیانی مدت کے لیے ایک اچھا اختیار سمجھا جاتا ہے۔ بہت سے لوگ ڈیبٹ میوچل فنڈز میں یکمشت رقم لگانے کا انتخاب کرتے ہیں۔ میں سے کچھبہترین قرض فنڈز جن کو یکمشت سرمایہ کاری کے لیے منتخب کیا جا سکتا ہے وہ درج ذیل ہیں۔
Fund NAV Net Assets (Cr) Min Investment 3 MO (%) 6 MO (%) 1 YR (%) 3 YR (%) 2023 (%) Debt Yield (YTM) Mod. Duration Eff. Maturity Aditya Birla Sun Life Medium Term Plan Growth ₹39.3376
↑ 0.01 ₹2,206 1,000 5.2 7.1 14.6 14.3 10.5 7.89% 3Y 7M 17D 4Y 10M 24D DSP BlackRock Credit Risk Fund Growth ₹48.7366
↑ 0.01 ₹207 1,000 15.6 17.7 22.5 14 7.8 7.81% 2Y 2M 8D 2Y 11M 12D Franklin India Credit Risk Fund Growth ₹25.3348
↑ 0.04 ₹104 5,000 2.9 5 7.5 11 0% Aditya Birla Sun Life Credit Risk Fund Growth ₹21.9558
↑ 0.01 ₹970 1,000 6.3 8.2 17.1 10.6 11.9 8.29% 2Y 5M 16D 3Y 9M 29D UTI Bond Fund Growth ₹73.4447
↑ 0.08 ₹320 1,000 3.9 5.6 11 10.2 8.5 7.17% 6Y 5M 1D 9Y 11M 5D Note: Returns up to 1 year are on absolute basis & more than 1 year are on CAGR basis. as on 22 Apr 25
یکمشت سرمایہ کاری کے لیے بہترین ہائبرڈ فنڈز
ہائبرڈ فنڈز کے نام سے بھی جانا جاتا ہے۔متوازن فنڈ اپنے پیسے کو ایکویٹی اور فکسڈ انکم انسٹرومنٹس دونوں میں لگائیں۔ یہ اسکیمیں ان افراد کے لیے موزوں ہیں جن کی تلاش ہے۔سرمایہ باقاعدہ آمدنی کے ساتھ پیداوار۔ متوازن اسکیموں کے نام سے بھی جانا جاتا ہے، افراد ہائبرڈ اسکیموں میں یکمشت رقم کی سرمایہ کاری کرنے کا انتخاب کرسکتے ہیں۔ یکمشت سرمایہ کاری کے لیے چند بہترین ہائبرڈ فنڈز ذیل میں درج ہیں۔
Fund NAV Net Assets (Cr) Min Investment 3 MO (%) 6 MO (%) 1 YR (%) 3 YR (%) 5 YR (%) 2023 (%) JM Equity Hybrid Fund Growth ₹117.258
↑ 0.32 ₹768 5,000 1.4 -6.2 7 20.8 28.1 27 HDFC Balanced Advantage Fund Growth ₹501.785
↑ 0.39 ₹90,375 5,000 3 0 9.6 19.4 25.8 16.7 ICICI Prudential Equity and Debt Fund Growth ₹379.33
↑ 0.10 ₹40,962 5,000 6.1 1 11.6 18.4 27.3 17.2 UTI Multi Asset Fund Growth ₹72.055
↑ 0.34 ₹5,285 5,000 3.3 -0.3 9.7 18.3 18.3 20.7 ICICI Prudential Multi-Asset Fund Growth ₹733.932
↑ 5.34 ₹55,360 5,000 5.4 2.6 13.3 17.9 26 16.1 Note: Returns up to 1 year are on absolute basis & more than 1 year are on CAGR basis. as on 22 Apr 25
یکمشت سرمایہ کاری کے لیے بہترین انڈیکس فنڈز
انڈیکس فنڈ کے پورٹ فولیو میں حصص اور دیگر آلات اسی تناسب سے ہوتے ہیں جس تناسب سے وہ انڈیکس میں ہوتے ہیں۔ دوسرے لفظوں میں، یہ اسکیمیں انڈیکس کی کارکردگی کی نقل کرتی ہیں۔ یہ غیر فعال طور پر منظم فنڈز ہیں اور انہیں یکمشت سرمایہ کاری کے لیے ایک اچھا اختیار سمجھا جا سکتا ہے۔ بہترین میں سے کچھانڈیکس فنڈز جن کو یکمشت سرمایہ کاری کے لیے منتخب کیا جا سکتا ہے وہ درج ذیل ہیں۔
Fund NAV Net Assets (Cr) 3 MO (%) 6 MO (%) 1 YR (%) 3 YR (%) 5 YR (%) 2023 (%) LIC MF Index Fund Sensex Growth ₹148.336
↑ 0.35 ₹84 4 -1 8.1 11.9 20.5 8.2 Nippon India Index Fund - Sensex Plan Growth ₹40.2569
↑ 0.09 ₹839 4.2 -0.7 8.8 12.3 21.1 8.9 SBI Nifty Index Fund Growth ₹212.351
↑ 0.36 ₹9,192 4.4 -1.1 9 12.8 22 9.5 IDBI Nifty Index Fund Growth ₹36.2111
↓ -0.02 ₹208 9.1 11.9 16.2 20.3 11.7 Franklin India Index Fund Nifty Plan Growth ₹193.9
↑ 0.33 ₹701 4.4 -1.1 8.9 12.6 21.7 9.5 Note: Returns up to 1 year are on absolute basis & more than 1 year are on CAGR basis. as on 22 Apr 25
پچھلے 1 مہینے پر مبنی بہترین میوچل فنڈز
"The primary investment objective of the Scheme is to seek capital appreciation by investing predominantly in units of MLIIF - WGF. The Scheme may, at the discretion of the Investment Manager, also invest in the units of other similar overseas mutual fund schemes, which may constitute a significant part of its corpus. The Scheme may also invest a certain portion of its corpus in money market securities and/or units of money market/liquid schemes of DSP Merrill Lynch Mutual Fund, in order to meet liquidity requirements from time to time. However, there is no assurance that the investment objective of the Scheme will be realized." DSP BlackRock World Gold Fund is a Equity - Global fund was launched on 14 Sep 07. It is a fund with High risk and has given a Below is the key information for DSP BlackRock World Gold Fund Returns up to 1 year are on The investment objective of the Scheme will be to generate returns that correspond closely to the returns generated by IDBI Gold Exchange Traded Fund (IDBI GOLD ETF). IDBI Gold Fund is a Gold - Gold fund was launched on 14 Aug 12. It is a fund with Moderately High risk and has given a Below is the key information for IDBI Gold Fund Returns up to 1 year are on The investment objective of the Scheme is to seek to provide returns that closely correspond to returns provided by Reliance ETF Gold BeES. Nippon India Gold Savings Fund is a Gold - Gold fund was launched on 7 Mar 11. It is a fund with Moderately High risk and has given a Below is the key information for Nippon India Gold Savings Fund Returns up to 1 year are on An Open ended Fund of Funds Scheme with the investment objective to provide returns that tracks returns provided by Birla Sun Life Gold ETF (BSL Gold ETF). Aditya Birla Sun Life Gold Fund is a Gold - Gold fund was launched on 20 Mar 12. It is a fund with Moderately High risk and has given a Below is the key information for Aditya Birla Sun Life Gold Fund Returns up to 1 year are on To provide returns that closely corresponds to returns provided by Invesco India Gold Exchange Traded Fund. Invesco India Gold Fund is a Gold - Gold fund was launched on 5 Dec 11. It is a fund with Moderately High risk and has given a Below is the key information for Invesco India Gold Fund Returns up to 1 year are on 1. DSP BlackRock World Gold Fund
CAGR/Annualized return of 6.4% since its launch. Ranked 11 in Global category. Return for 2024 was 15.9% , 2023 was 7% and 2022 was -7.7% . DSP BlackRock World Gold Fund
Growth Launch Date 14 Sep 07 NAV (17 Apr 25) ₹29.7321 ↓ -0.43 (-1.42 %) Net Assets (Cr) ₹1,146 on 31 Mar 25 Category Equity - Global AMC DSP BlackRock Invmt Managers Pvt. Ltd. Rating ☆☆☆ Risk High Expense Ratio 1.35 Sharpe Ratio 1.49 Information Ratio -0.12 Alpha Ratio 0.84 Min Investment 1,000 Min SIP Investment 500 Exit Load 0-12 Months (1%),12 Months and above(NIL) Growth of 10,000 investment over the years.
Date Value 31 Mar 20 ₹10,000 31 Mar 21 ₹13,604 31 Mar 22 ₹15,152 31 Mar 23 ₹14,266 31 Mar 24 ₹13,920 31 Mar 25 ₹20,792 Returns for DSP BlackRock World Gold Fund
absolute basis & more than 1 year are on CAGR (Compound Annual Growth Rate) basis. as on 17 Apr 25 Duration Returns 1 Month 14.9% 3 Month 37.8% 6 Month 27.4% 1 Year 63.6% 3 Year 14.5% 5 Year 13.1% 10 Year 15 Year Since launch 6.4% Historical performance (Yearly) on absolute basis
Year Returns 2023 15.9% 2022 7% 2021 -7.7% 2020 -9% 2019 31.4% 2018 35.1% 2017 -10.7% 2016 -4% 2015 52.7% 2014 -18.5% Fund Manager information for DSP BlackRock World Gold Fund
Name Since Tenure Jay Kothari 1 Mar 13 12.01 Yr. Data below for DSP BlackRock World Gold Fund as on 31 Mar 25
Equity Sector Allocation
Sector Value Basic Materials 92.86% Asset Allocation
Asset Class Value Cash 3.12% Equity 93.16% Debt 0.02% Other 3.7% Top Securities Holdings / Portfolio
Name Holding Value Quantity BGF World Gold I2
Investment Fund | -80% ₹844 Cr 1,880,211
↓ -73,489 VanEck Gold Miners ETF
- | GDX19% ₹199 Cr 573,719 Treps / Reverse Repo Investments
CBLO/Reverse Repo | -2% ₹19 Cr Net Receivables/Payables
CBLO | -0% -₹4 Cr 2. IDBI Gold Fund
CAGR/Annualized return of 7.9% since its launch. Return for 2024 was 18.7% , 2023 was 14.8% and 2022 was 12% . IDBI Gold Fund
Growth Launch Date 14 Aug 12 NAV (22 Apr 25) ₹26.3342 ↑ 0.82 (3.23 %) Net Assets (Cr) ₹104 on 31 Mar 25 Category Gold - Gold AMC IDBI Asset Management Limited Rating Risk Moderately High Expense Ratio 0.65 Sharpe Ratio 1.62 Information Ratio 0 Alpha Ratio 0 Min Investment 5,000 Min SIP Investment 500 Exit Load 0-12 Months (1%),12 Months and above(NIL) Growth of 10,000 investment over the years.
Date Value 31 Mar 20 ₹10,000 31 Mar 21 ₹10,000 31 Mar 22 ₹11,326 31 Mar 23 ₹13,151 31 Mar 24 ₹14,541 31 Mar 25 ₹19,184 Returns for IDBI Gold Fund
absolute basis & more than 1 year are on CAGR (Compound Annual Growth Rate) basis. as on 17 Apr 25 Duration Returns 1 Month 13.4% 3 Month 24.8% 6 Month 27.1% 1 Year 32.4% 3 Year 22.8% 5 Year 14.8% 10 Year 15 Year Since launch 7.9% Historical performance (Yearly) on absolute basis
Year Returns 2023 18.7% 2022 14.8% 2021 12% 2020 -4% 2019 24.2% 2018 21.6% 2017 5.8% 2016 1.4% 2015 8.3% 2014 -8.7% Fund Manager information for IDBI Gold Fund
Name Since Tenure Sumit Bhatnagar 1 Jun 24 0.75 Yr. Data below for IDBI Gold Fund as on 31 Mar 25
Asset Allocation
Asset Class Value Cash 1.33% Other 98.67% Top Securities Holdings / Portfolio
Name Holding Value Quantity LIC MF Gold ETF
- | -99% ₹92 Cr 119,347
↑ 12,271 Treps
CBLO/Reverse Repo | -1% ₹1 Cr Net Receivables / (Payables)
Net Current Assets | -1% -₹1 Cr 3. Nippon India Gold Savings Fund
CAGR/Annualized return of 10% since its launch. Return for 2024 was 19% , 2023 was 14.3% and 2022 was 12.3% . Nippon India Gold Savings Fund
Growth Launch Date 7 Mar 11 NAV (22 Apr 25) ₹38.308 ↑ 0.84 (2.25 %) Net Assets (Cr) ₹2,744 on 31 Mar 25 Category Gold - Gold AMC Nippon Life Asset Management Ltd. Rating ☆☆ Risk Moderately High Expense Ratio 0.34 Sharpe Ratio 1.55 Information Ratio 0 Alpha Ratio 0 Min Investment 5,000 Min SIP Investment 100 Exit Load 0-1 Years (2%),1 Years and above(NIL) Growth of 10,000 investment over the years.
Date Value 31 Mar 20 ₹10,000 31 Mar 21 ₹9,956 31 Mar 22 ₹11,456 31 Mar 23 ₹13,213 31 Mar 24 ₹14,599 31 Mar 25 ₹19,055 Returns for Nippon India Gold Savings Fund
absolute basis & more than 1 year are on CAGR (Compound Annual Growth Rate) basis. as on 17 Apr 25 Duration Returns 1 Month 12.1% 3 Month 22.5% 6 Month 25.9% 1 Year 33.8% 3 Year 21.9% 5 Year 13.8% 10 Year 15 Year Since launch 10% Historical performance (Yearly) on absolute basis
Year Returns 2023 19% 2022 14.3% 2021 12.3% 2020 -5.5% 2019 26.6% 2018 22.5% 2017 6% 2016 1.7% 2015 11.6% 2014 -8.1% Fund Manager information for Nippon India Gold Savings Fund
Name Since Tenure Himanshu Mange 23 Dec 23 1.19 Yr. Data below for Nippon India Gold Savings Fund as on 31 Mar 25
Asset Allocation
Asset Class Value Cash 3.07% Other 96.93% Top Securities Holdings / Portfolio
Name Holding Value Quantity Nippon India ETF Gold BeES
- | -98% ₹2,580 Cr 362,884,792
↑ 9,655,000 Net Current Assets
Net Current Assets | -1% ₹31 Cr Triparty Repo
CBLO/Reverse Repo | -0% ₹12 Cr Cash Margin - Ccil
CBLO | -0% ₹0 Cr 4. Aditya Birla Sun Life Gold Fund
CAGR/Annualized return of 8.5% since its launch. Return for 2024 was 18.7% , 2023 was 14.5% and 2022 was 12.3% . Aditya Birla Sun Life Gold Fund
Growth Launch Date 20 Mar 12 NAV (22 Apr 25) ₹29.0362 ↑ 0.42 (1.47 %) Net Assets (Cr) ₹555 on 31 Mar 25 Category Gold - Gold AMC Birla Sun Life Asset Management Co Ltd Rating ☆☆☆ Risk Moderately High Expense Ratio 0.51 Sharpe Ratio 1.65 Information Ratio 0 Alpha Ratio 0 Min Investment 100 Min SIP Investment 100 Exit Load 0-365 Days (1%),365 Days and above(NIL) Growth of 10,000 investment over the years.
Date Value 31 Mar 20 ₹10,000 31 Mar 21 ₹9,940 31 Mar 22 ₹11,371 31 Mar 23 ₹13,025 31 Mar 24 ₹14,416 31 Mar 25 ₹18,985 Returns for Aditya Birla Sun Life Gold Fund
absolute basis & more than 1 year are on CAGR (Compound Annual Growth Rate) basis. as on 17 Apr 25 Duration Returns 1 Month 12% 3 Month 22.2% 6 Month 25.9% 1 Year 35% 3 Year 21.9% 5 Year 14.3% 10 Year 15 Year Since launch 8.5% Historical performance (Yearly) on absolute basis
Year Returns 2023 18.7% 2022 14.5% 2021 12.3% 2020 -5% 2019 26% 2018 21.3% 2017 6.8% 2016 1.6% 2015 11.5% 2014 -7.2% Fund Manager information for Aditya Birla Sun Life Gold Fund
Name Since Tenure Priya Sridhar 31 Dec 24 0.16 Yr. Data below for Aditya Birla Sun Life Gold Fund as on 31 Mar 25
Asset Allocation
Asset Class Value Cash 1.87% Other 98.13% Top Securities Holdings / Portfolio
Name Holding Value Quantity Aditya BSL Gold ETF
- | -100% ₹511 Cr 67,773,270
↑ 3,265,683 Clearing Corporation Of India Limited
CBLO/Reverse Repo | -1% ₹3 Cr Net Receivables / (Payables)
Net Current Assets | -0% -₹2 Cr 5. Invesco India Gold Fund
CAGR/Annualized return of 8.1% since its launch. Return for 2024 was 18.8% , 2023 was 14.5% and 2022 was 12.8% . Invesco India Gold Fund
Growth Launch Date 5 Dec 11 NAV (22 Apr 25) ₹28.2018 ↑ 0.49 (1.78 %) Net Assets (Cr) ₹142 on 31 Mar 25 Category Gold - Gold AMC Invesco Asset Management (India) Private Ltd Rating ☆☆☆ Risk Moderately High Expense Ratio 0.45 Sharpe Ratio 1.6 Information Ratio 0 Alpha Ratio 0 Min Investment 5,000 Min SIP Investment 500 Exit Load 0-6 Months (2%),6-12 Months (1%),12 Months and above(NIL) Growth of 10,000 investment over the years.
Date Value 31 Mar 20 ₹10,000 31 Mar 21 ₹10,219 31 Mar 22 ₹11,561 31 Mar 23 ₹13,495 31 Mar 24 ₹14,930 31 Mar 25 ₹19,501 Returns for Invesco India Gold Fund
absolute basis & more than 1 year are on CAGR (Compound Annual Growth Rate) basis. as on 17 Apr 25 Duration Returns 1 Month 11.9% 3 Month 21.7% 6 Month 25.1% 1 Year 32.8% 3 Year 21.9% 5 Year 14.6% 10 Year 15 Year Since launch 8.1% Historical performance (Yearly) on absolute basis
Year Returns 2023 18.8% 2022 14.5% 2021 12.8% 2020 -5.5% 2019 27.2% 2018 21.4% 2017 6.6% 2016 1.3% 2015 21.6% 2014 -15.1% Fund Manager information for Invesco India Gold Fund
Name Since Tenure Krishna Cheemalapati 1 Mar 25 0 Yr. Data below for Invesco India Gold Fund as on 31 Mar 25
Asset Allocation
Asset Class Value Cash 3.81% Other 96.19% Top Securities Holdings / Portfolio
Name Holding Value Quantity Invesco India Gold ETF
- | -98% ₹124 Cr 166,343
↑ 11,350 Triparty Repo
CBLO/Reverse Repo | -3% ₹4 Cr Net Receivables / (Payables)
Net Current Assets | -1% -₹1 Cr
یکمشت سرمایہ کاری کے دوران جن چیزوں پر غور کیا جانا چاہیے۔
میوچل فنڈز میں سرمایہ کاری کرنے سے پہلے افراد کو بہت سارے پیرامیٹرز کا خیال رکھنے کی ضرورت ہے۔ اس میں شامل ہیں:
مارکیٹ کی ٹائمنگ
جب بات یکمشت سرمایہ کاری کی ہو تو افراد کو ہمیشہ تلاش کرنے کی ضرورت ہوتی ہے۔مارکیٹ اوقات خاص طور پر ایکویٹی پر مبنی فنڈز کے حوالے سے۔ یکمشت سرمایہ کاری کرنے کا ایک اچھا وقت وہ ہے جب مارکیٹیں کم ہوں اور اس کی گنجائش ہے کہ وہ جلد ہی تعریف کرنا شروع کر دیں گے۔ تاہم، اگر مارکیٹیں پہلے ہی عروج پر ہیں تو، یکمشت سرمایہ کاری سے دور رہنا بہتر ہے۔
تنوع
تنوع بھی ایک اہم پہلو ہے جس پر یکمشت سرمایہ کاری کرنے سے پہلے غور کرنے کی ضرورت ہے۔ یکمشت سرمایہ کاری کی صورت میں افراد کو متعدد راستوں میں پھیل کر اپنی سرمایہ کاری کو متنوع بنانا چاہیے۔ اس سے اس بات کو یقینی بنانے میں مدد ملے گی کہ ان کا مجموعی پورٹ فولیو اچھی کارکردگی کا مظاہرہ کرتا ہے یہاں تک کہ اگر اسکیموں میں سے کوئی بھی کارکردگی کا مظاہرہ نہیں کرتا ہے۔
اپنی سرمایہ کاری اپنے مقصد کے مطابق کریں۔
کوئی بھی سرمایہ کاری جو افراد کرتے ہیں وہ ایک خاص مقصد حاصل کرنا ہے۔ لہذا، افراد کو جانچنا چاہیے کہ آیا اسکیم کا طریقہ کار کے مطابق ہے۔سرمایہ کارکا مقصد یہاں، افراد کو مختلف پیرامیٹرز کی تلاش کرنی چاہیے جیسےسی اے جی آر اسکیم میں سرمایہ کاری کرنے سے پہلے ریٹرن، مطلق واپسی، ٹیکس کا اثر اور بہت کچھ۔
فدیہ صحیح وقت پر کیا جائے۔
افراد کو اپنا کام کرنا چاہیے۔رہائی یکمشت سرمایہ کاری میں صحیح وقت پر۔ اگرچہ یہ ابھی تک سرمایہ کاری کے مقصد کے مطابق ہوسکتا ہے؛ افراد کو اس اسکیم کا بروقت جائزہ لینا چاہیے جس میں وہ سرمایہ کاری کرنے کا ارادہ رکھتے ہیں۔ تاہم، انہیں اپنی سرمایہ کاری کو طویل مدت تک رکھنے کی بھی ضرورت ہے تاکہ وہ زیادہ سے زیادہ فوائد سے لطف اندوز ہو سکیں۔
میوچل فنڈ یکمشت واپسی کیلکولیٹر
میوچل فنڈ کی یکمشت واپسی کیلکولیٹر افراد کو یہ بتانے میں مدد کرتا ہے کہ کسی فرد کی یکمشت سرمایہ کاری ایک مقررہ وقت کے دوران کیسے بڑھتی ہے۔ کچھ اعداد و شمار جنہیں یکمشت کیلکولیٹر میں داخل کرنے کی ضرورت ہوتی ہے ان میں سرمایہ کاری کی مدت، ابتدائی سرمایہ کاری کی رقم، طویل مدتی متوقع ترقی کی شرح اور بہت کچھ شامل ہوتا ہے۔ میوچل فنڈ کے یکمشت واپسی کیلکولیٹر کی ایک مثال درج ذیل ہے۔
مثال
یکمشت سرمایہ کاری: 25 روپے،000
سرمایہ کاری کی مدت: 15 سال
طویل مدتی ترقی کی شرح (تقریباً): 15%
یکمشت کیلکولیٹر کے مطابق متوقع واپسی: INR 2,03,427
سرمایہ کاری پر خالص منافع: 1,78,427 روپے
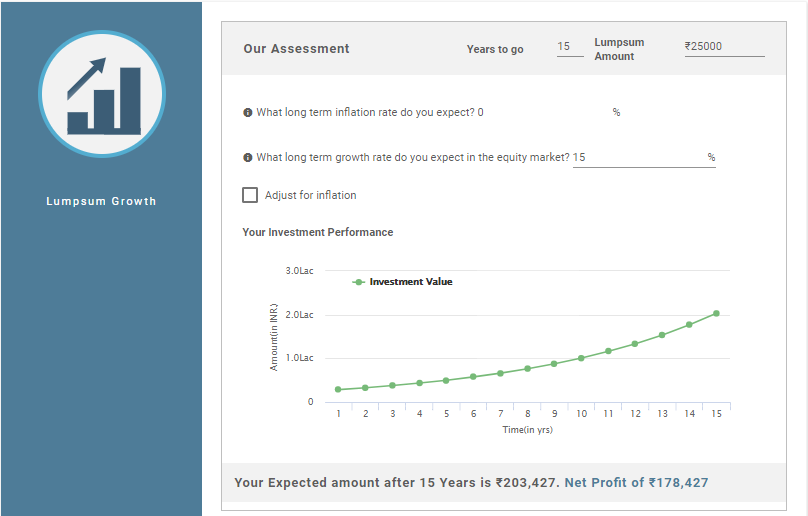
اس طرح، مندرجہ بالا حساب سے پتہ چلتا ہے کہ آپ کی سرمایہ کاری پر سرمایہ کاری پر خالص منافع INR 1,78,427 ہے جبکہ آپ کی سرمایہ کاری کی کل قیمت INR 2,03,427 ہے۔.
میوچل فنڈ میں ایک وقتی سرمایہ کاری کے فائدے اور نقصانات
SIP کی طرح، Lump Sum Investment کے بھی اپنے فوائد اور نقصانات ہیں۔ تو آئیے ان فوائد اور نقصانات کو دیکھتے ہیں۔
فوائد
Lump Sum سرمایہ کاری کے فوائد درج ذیل ہیں۔
- بڑی رقم کی سرمایہ کاری کریں: افراد میوچل فنڈز میں بڑی رقم کی سرمایہ کاری کر سکتے ہیں اور فنڈز کو بیکار رکھنے کے بجائے زیادہ منافع کما سکتے ہیں۔
- طویل مدتی کے لیے مثالی: سرمایہ کاری کا لمپ سم موڈ طویل مدتی سرمایہ کاری کے لیے اچھا ہے خاص طور پر ایکویٹی فنڈز کے معاملے میں۔ تاہم، قرض کے فنڈز کی صورت میں، مدت مختصر یا درمیانی مدت کی ہو سکتی ہے۔
- سہولت: یکمشت سرمایہ کاری کا طریقہ آسان ہے کیونکہ ادائیگی صرف ایک بار کی جاتی ہے اور باقاعدہ وقفوں پر کٹوتی نہیں کی جاتی ہے۔
نقصانات
یکمشت سرمایہ کاری کے نقصانات یہ ہیں:
- بے قاعدہ سرمایہ کاری: یکمشت سرمایہ کاری کسی سرمایہ کار کی باقاعدہ بچت کو یقینی نہیں بناتی ہے کیونکہ یہ بچت کی باقاعدہ عادت نہیں ڈالتی ہے۔
- زیادہ خطرہ: یکمشت سرمایہ کاری میں، اوقات کو دیکھنا ضروری ہے۔ اس کی وجہ یہ ہے کہ یکمشت موڈ میں سرمایہ کاری صرف ایک بار کی جاتی ہے نہ کہ باقاعدہ وقفوں پر۔ لہذا، اگر لوگ وقت پر غور نہیں کرتے ہیں، تو وہ نقصان میں ختم ہوسکتے ہیں.
نتیجہ
اس طرح، مندرجہ بالا نکات سے، یہ کہا جا سکتا ہے کہ یکمشت موڈ بھی Mutual Funds میں سرمایہ کاری کرنے کا ایک اچھا طریقہ ہے۔ تاہم، افراد کو اسکیم میں یکمشت رقم کی سرمایہ کاری کرتے وقت پراعتماد ہونے کی ضرورت ہے۔ اگر نہیں، تو وہ سرمایہ کاری کے SIP موڈ کا انتخاب کر سکتے ہیں۔ اس کے علاوہ، لوگوں کو سرمایہ کاری کرنے سے پہلے اسکیم کے طریقوں کو سمجھنا چاہیے۔ اگر ضرورت ہو تو وہ ایک سے بھی مشورہ کر سکتے ہیں۔مشیر خزانہ. اس سے انہیں یہ یقینی بنانے میں مدد ملے گی کہ ان کا پیسہ محفوظ ہے اور ان کے مقاصد وقت پر پورے ہو گئے ہیں۔.
یہاں فراہم کردہ معلومات کے درست ہونے کو یقینی بنانے کے لیے تمام کوششیں کی گئی ہیں۔ تاہم، ڈیٹا کی درستگی کے حوالے سے کوئی ضمانت نہیں دی جاتی ہے۔ براہ کرم کوئی بھی سرمایہ کاری کرنے سے پہلے اسکیم کی معلومات کے دستاویز کے ساتھ تصدیق کریں۔
You Might Also Like


")
AMFI Registration No. 112358 | CIN: U74999MH2016PTC282153
Shepard Technologies Pvt. Ltd. (with ARN code 112358) makes no warranties or representations, express or implied, on products offered through the platform. It accepts no liability for any damages or losses, however caused, in connection with the use of, or on the reliance of its product or related services. Terms and conditions of the website are applicable.
©2025 Shepard Technologies Private Limited. All Rights Reserved